
 ?Mathematical formulae have been encoded as MathML and are displayed in this HTML version using MathJax in order to improve their display. Uncheck the box to turn MathJax off. This feature requires Javascript. Click on a formula to zoom.
Abstract
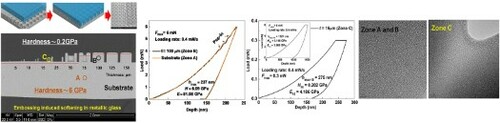
While shear softening is widely acknowledged inflow of metallic glasses (MGs), the underlying structural origin remains obscure. Here a Zr35Ti30Be26.75Cu8.25 MG was squeezed into annular gaps of an exterior diameter of 300 µm and widths of 5∼150 µm by thermoplastic embossing. Pronounced softening was detected for MG flowing in gaps smaller than 50 µm, showing a hardness value ∼1/30 of MG outside the gap. Nanofoam-like feature was observed in the atomic structure of softened MG. This is attributed to the increased shear in MG flowing in smaller gaps and proposed to be the main cause for the pronounced softening.
GRAPHICAL ABSTRACT
IMPACT STATEMENT
The effects of shear in micro annular gap flow on the structure and mechanical properties of metallic glass were revealed.
1. Introduction
Softening in metallic glasses (MGs) induced by flow was early recognized in the 1970s [Citation1] and has attracted widespread attentions since then [Citation2–9]. However, the origin of softening in MGs remains under debate [Citation10–12] for insufficient information about structural evolution of MGs inflow. This is mainly for the high propensity to softening of MGs which causes the plastic deformation of MGs at ambient temperature to rapidly (in micro-to-milliseconds) localize into thin (10∼50 nm) shear bands [Citation3,Citation13]. These temporal and spatial limitations largely hamper examination on structural evolution inside shear bands [Citation5–9,Citation14–16].
With the difficulties faced above, the supercooled liquid state of MGs exhibiting excellent micro and even nanoscale formability in imprinting, embossing and molding [Citation17], provides an alternative approach to examine the structure of MGs inflow. By squeezing MG in supercooled liquid state into micro gaps could partially simulate the flow of MG inside shear bands while avoiding the above limitations, especially noting the micrometer-sized shear band affected zones [Citation15,Citation18,Citation19]. Meantime, examining the effect of flow in thin gaps on the structure and mechanical properties of MGs which determine the integrity and robustness of MG micro-structures is critical to the application of the formed MG microparts [Citation20–24]. Also, it is noteworthy that although nano-and-micro pillar samples of MGs have been widely investigated in past decades [Citation25], it was found that the manufacture path of these small samples would have an important effect on their deformation behaviors [Citation21,Citation26,Citation27]. Thereby, research on the effect of flow in micro gaps on MG could as well be a necessary complement to previous works [Citation25] on nano-and-micro-sized MG specimens. In this work, by thermoplastic embossing (as will be illustrated in Figure ), a Zr35Ti30Be26.75Cu8.25 MG was squeezed into annular gaps of an exterior diameter of 300 µm and different widths to realize micro gap flow. Annular gaps are selected for convenient flow analysis due to rotational symmetry.
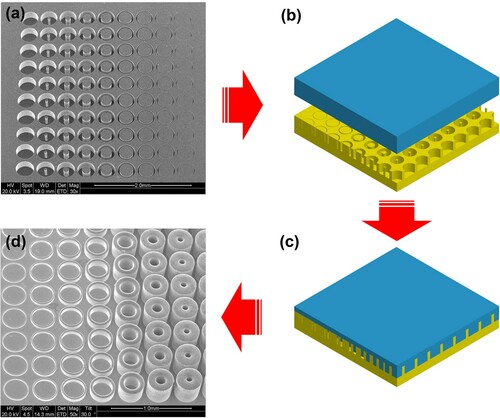
Figure 1. Illustration on thermoplastic embossing of metallic glass (MG) by which MG was squeezed into annular gaps. (a) Silicon mold fabricated with annular gaps; (b) Laying MG (blue) atop silicon mold (yellow); (c) MG squeezed into annular gaps after embossing; (d) Annular features embossed on MG by squeezing MG into the annular gaps, with the silicon mold etched away in KOH solution.
2. Material and methods
Annular gaps were fabricated on a silicon wafer of 0.5 mm in thickness and 4 in. in diameter via deep reactive ion etching. Individual silicon mold for embossing was a square piece of 4.5 × 4.5 × 0.5 mm3 in size, as shown in Figure (a). Each silicon mold contains an array of annular gaps of an exterior diameter of 300 μm and different widths of 5, 10, 15, 25, 50, 75, 100, 125 and 150 μm (i.e. pillar). The annular gaps are of an increasing depth between 170 and 350 μm with increased width, and a spacing of 50 μm along both transversal and longitudinal directions.
Zr35Ti30Be26.75Cu8.25 (at.%) MG was chosen for its excellent anti-oxidation capability and thermal stability [Citation28], showing a glass transition temperature Tg of 305 °C and a crystallization temperature Tx of 445°C, i.e. a wide supercooled liquid region of 140°C. MG specimens for embossing were 4.5 × 4.5 × 1.5 mm3 in size. According to ref. [Citation28], embossing was performed at 380°C at a loading rate of 0.0015 mm·s−1 on a materials testing machine (Zwick/Roell 020). For embossing, MG was stacked onto silicon mold (Figure (b)). After embossing, the MG was squeezed into the annular gaps (Figure (c)) and could be released by etching away the mold in KOH solution. Annular features of MG flowing into the gaps were observed with scanning electron microscopy (SEM, FEI Sirion 200) and a transmission electron microscope (TEM, Tecnai G2 F30). As shown in Figure (d), the annular features show no obvious defects. Nanoindentation was performed on the annular features embedded in an epoxy resin base with a Hysitron Triboindenter (Hysitron TI 750) using a Berkovich-type tip.
3. Results and discussion
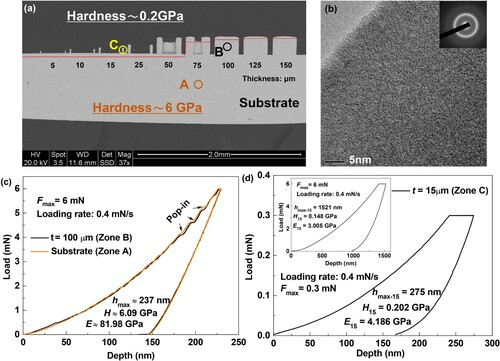
Figure (a) shows cross-section of the annular features of Zr35Ti30Be26.75Cu8.25 MG squeezed into the annular gaps. Thickness of annular features corresponds to the annular gap width. Filling depth of annular features into the gap increases with the gap width, indicating the increased filling ability of MG into gaps of larger width. Figure (b) shows the high-resolution TEM image of Zr35Ti30Be26.75Cu8.25 MG outside the gap (i.e. the substrate) after embossing. The inset shows the selected area electron diffraction pattern. The disordered atomic packing and the appearance of a halo ring indicate that the MG maintained amorphous after embossing. Figure (c and d) shows the representative load (P) vs. displacement (h) curves in nanoindentation for Zone A, B and C (i.e. MG substrate, annular feature of a thickness of 100 µm and annular feature of a thickness of 15 µm, as indicated by circles in Figure (a)). In Figure (c), the P vs. h curves for Zone A and B showing a maximum depth of ∼235 nm and a maximum load of 6 mN almost overlap with each other, indicating that MG substrate and MG annular feature of a thickness of 100 µm exhibited similar mechanical properties. The hardness and reduced modulus are 6.09 and 81.98 GPa, respectively. Figure (d) shows the P vs. h curve showing a maximum depth of 275 nm and a maximum load of 0.3 mN for zone C, suggesting a hardness value of 0.20 GPa and a modulus of 4.18 GPa. The inset is the P vs. h curve showing a maximum load of 6 mN and a much increased maximum depth of 1520 nm for zone C, suggesting a hardness value of 0.15 GPa and a modulus of 3.0 GPa. This result indicates that flow in annular gap of 15 µm in width led to pronounced softening of MG.
Figure 2. Nanoindentation and softening. (a) Cross-section of annular features of MG squeezed into annular gaps with various widths from 5 to 150 μm (i.e. a pillar). (b) High-resolution TEM images of atomic structure of the MG substrate. Inset shows the SAED pattern. (c) Load-displacement (P–h) curves of zone A (substrate) and B (annular feature with a thickness of 100 μm). (d) The P–h curve for zone C (annular feature of 15 μm in thickness). Thickness of annular features corresponds to annular gap width.
To chart the softened region, Figure (a) shows the P–h curves for annular features of thicknesses ranging from 10 to 50 μm (P10–P50), top part of the annular feature of a thickness of 150 μm (P150-top), and edge of the MG substrate (Ps-e). For these tests, a maximum load of 0.3 mN was adopted. The indent depth, hardness, and modulus are ∼279 nm, ∼0.2 GPa, and ∼3.8 GPa, respectively, indicating the occurrence of softening. Figure (b) shows the variation of hardness and modulus for the top part and body part of annular features with increasing thickness. It is seen that the top part of annular feature exhibits softening for all thickness, while the softening phenomenon disappears in the body part for annular features of a thickness greater than 50 μm. Similarly, Figure (c) provides the variation of hardness and modulus with increasing distance from the edge to the interior of MG substrate. It is seen that there is a softened region of a width of about 50 μm from the edge. The inset shows the annular feature embedded in epoxy resin and the direction from edge to the interior of MG substrate.
Figure 3. Nanoindentation on annular features. (a) Load-displacement (P–h) curves of annular features with various thickness (10–50 μm, P10–P50), top part of annular feature of 150 μm (P150-top), and edge part (Ps-e) of substrate. (b) Hardness and modulus for the body part and top part of annular features. (c) Hardness and modulus for the edge part of MG substrate, indicating a softened region of ∼50 μm. Inset shows the annular feature embedded in epoxy resin and the direction from edge to interior of MG substrate. (d) P–h curves for annealed annular features, demonstrating the removal of softening after annealing.
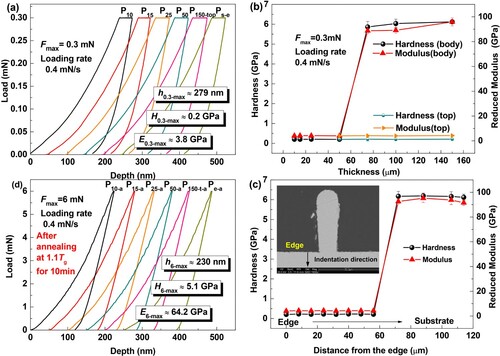
To confirm the softening effect, nanoindentation was also performed on MG annular features thermally annealed at 360°C (∼1.1Tg) for 10 min. Figure (d) presents the P–h curves for annular features of thicknesses ranging from 10 to 50 μm (P10-a–P50-a), top part of the annular feature of a thickness of 150 μm (P150-t-a) and edge of the MG substrate (Pe-a). It is noted that the hardness and modulus recovered to 5.1 and 64.2 GPa, respectively, indicating the removal of softening. Thereby, a boundary can be drawn as the red line in Figure (a) for the softened region. Above the line, the hardness is ∼0.2 GPa, while below the line, the hardness is ∼6 GPa. Critical size of the geometric feature for softening could be identified as 50 μm. Namely, when the thickness of the annular feature is less than 50 μm, the whole feature exhibits softening. For annular features of a thickness larger than 50, the softened region was located at the top part with a distance less than 50 μm from the surface. With increasing thickness of the annular feature, the softened region shrinks rapidly.
Generally, the softening of MGs in flow stems from shear as in shear bands [Citation13,Citation29]. Here, due to the decreased gap width, the strong viscous traction effect on the surface of the silicon mold would lead to strong shear in the annular gap flow of MG. To calculate the flow state of MG in the annular gap, it is first assumed that the capillary force is negligible as the gap width is well above 100 nm [Citation30]. Moreover, for the high viscosity of MG (approximately 2 × 10⁷ Pa s), the flow kinetics involves simple laminar flow [Citation31]. Figure (a) shows the illustration of the velocity distribution of MG on the cross-section of the annular gap. Assuming a non-sliding boundary condition, the strain rate at the surfaces of the gap could be obtained from the velocity distribution u on the radial cross-section of the annular gap:
(1)
(1) where η is viscosity, l is filling depth into the annular gap; R and r are the exterior and interior radii of the annular gap. t is the distance from the inner cylindrical surface along the radial direction. ΔP is the squeezing pressure and could be estimated with the Hagen–Poiseuille equation, where τ is filling time,
(2)
(2) It is reasonable to consider that the filling times of all the annular features are the same and equal the duration period of the embossing process. Figure (b) shows the dimensionless forming pressure (ΔPτ/8η) required for the annular features and the corresponding filling depth. It is seen that the annular feature of a thickness of d = 5 µm with a filling length l = 30 µm requires a forming pressure ∼10 times of that of the annular feature of a thickness d = 125 µm with a filling length l = 230 µm. Thereby, more significant shear occurs inside annular gaps with a smaller width. The distribution of shear strain rate reads:
(3)
(3) and the maximum strain rates occurred at the exterior and interior surfaces of the annular gap. The
at the interior and exterior surfaces respectively reads:
(4)
(4)
(5)
(5) Based on the above equations, the strain rate normalized as (
) at the surfaces of the annular gaps of different thickness is shown in Figure (c). It is seen that with decreased width, the strain rate increases rapidly. The total embossing time is approximately 500 s. However, the filling time τ is less than this for the ramping loading process. The lower limit of the strain rate in the annular gap of 50 µm in width is ∼0.05 s−1 and roughly the critical strain rate for shear thinning in the Zr35Ti30Be26.75Cu8.25 supercooled liquid at 380°C [Citation32]. This result reasonably interprets the observed softening with decreasing gap width.
Figure 4. Theoretical calculation on the annular gap flow. (a) Velocity distribution on the cross-section of annular gap; (b) dimensionless filling pressure for annular features of different thickness; (c) normalized shear strain rate at the surface of annular gaps.
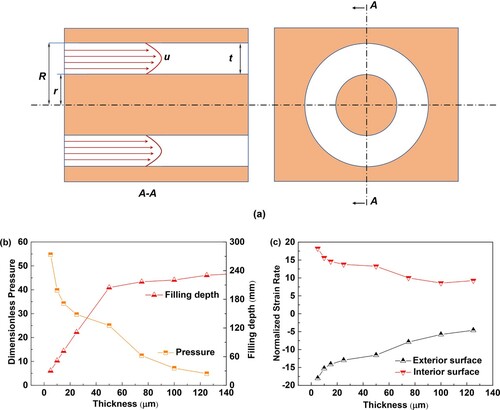
The critical thickness of ∼50 µm of the annular features for softening could also be partially understood based on the annular gap flow of MG. The normalized strain rate () in Figure (c) is actually half the strain at the surface of the annular gap. It is seen that the accumulated strain for annular features thinner than 50 µm is greater than ∼20, while that for the thicker ones is less than ∼20. This critical strain near 20 coincides with the observation made by Liu et al. [Citation8] that the accumulated strain inside shear bands starts to progressively reduce the density (i.e. increase the volume) of MGs. Liu et al. [Citation8] also showed that a shear strain of the order of 101 would increase the volume by ∼2% inside shear band. Evaluation on the specific volume of MGs shows that with a volume increase of ∼1.5% the amorphous structure of MGs would rise into the supercooled liquid state [Citation33]. Here, the hardness of MG is as low as 0.2 GPa with a modulus of ∼4 GPa. According to the mechanical relaxation spectroscopy of Zr35Ti30Be26.75Cu8.25 MG [Citation34], the modulus corresponds to a state in the supercooled region at 360∼370°C. Thereby, the softening of MG observed here is likely an equivalent to the softening of MG inside the core of shear bands. The observed softening on the edge of MG substrate and at the top of annular features may also be due to shear at the surface of MG.
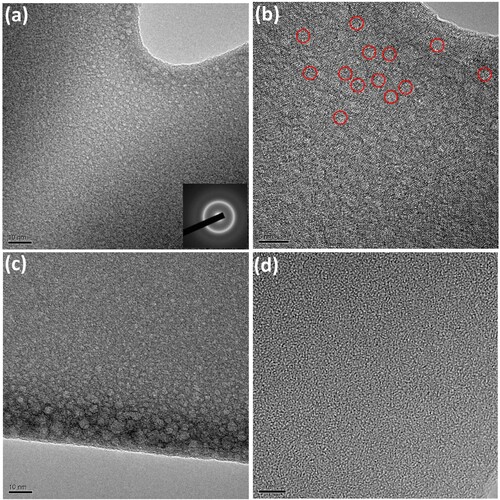
To rationalize the observed softening, HRTEM images of the MG after annular gap flow are shown in Figure . In contrast to the substrate shown in Figure (b), it is seen in Figure (a–c) that spots with low contrast can be observed for annular features of a thickness of 25 µm and the edge of MG substrate. For the low contrast, these spots are highly likely containing sub-nanovoids [Citation35,Citation36] (i.e. of low densities) and lead to the observed softening, resembling nanofoams. While for annular feature of a thickness of 100 µm, no such spots exists, as shown in Figure (d). The precipitation of nanofoam-like structures in the softened annular feature is in alignment with and corroborates the shear-thinning theory proposed by Furukawa and Tanaka [Citation10] that the softening in MGs originates from simple shear flow-induced density fluctuation, as the viscosity of MGs is highly density-dependent (i.e. free volume-dependent). Nevertheless, for in-depth understandings, more works on the structure evolution in MG amid microscale shear flow are required.
Figure 5. High-resolution TEM images on the atomic structure of annular features embossed on Zr-based MG. (a) Annular feature of a thickness of 25 µm, (b) zoom-in of (a); (c) the edge of MG substrate; (d) annular feature of a thickness of 100 µm. The scale bars in (a) and (c) are 10 nm, in (c) and (d) are 5 nm.
4. Conclusions
In summary, micro annular gap flow leads to pronounced softening in Zr35Ti30Be26.75Cu8.25 MG when the annular gap is smaller than 50 µm. The softened MG shows a hardness value ∼1/30 of MG outside the gap, equaling a softened state inside shear bands. The observed softening could be removed by thermal annealing at temperatures above Tg. The pronounced softening could be rationalized with the formation of atomic level nanofoam-like features which was probably caused by higher strain rate and larger accumulated shear strain in MG flowing in smaller gaps. Our work supports the scenario of shear softening induced by density fluctuation under simple shear flow.
Acknowledgements
The authors are also grateful to the Analytical and Testing Center, Huazhong University of Science and Technology for technical assistance.
Disclosure statement
No potential conflict of interest was reported by the author(s).
Additional information
Funding
References
- Spaepen F. A microscopic mechanism for steady state inhomogeneous flow in metallic glasses. Acta Metall. 1977;25:407–415.
- de Hey P, Sietsma J, van den Beukel A. Structural disordering in amorphous Pd40Ni40P20 induced by high temperature deformation. Acta Mater. 1998;46:5873–5882.
- Jiang MQ, Dai LH. On the origin of shear banding instability in metallic glasses. J Mech Phys Solids. 2009;57:1267–1292.
- Pan J, Chen Q, Liu L, et al. Softening and dilatation in a single shear band. Acta Mater. 2011;59:5146–5158.
- Bokeloh J, Divinski SV, Reglitz G, et al. Tracer measurements of atomic diffusion inside shear bands of a bulk metallic glass. Phys Rev Lett. 2011;107:235503.
- Rosner H, Peterlechner M, Kubel C, et al. Density changes in shear bands of a metallic glass determined by correlative analytical transmission electron microscopy. Ultramicroscopy. 2014;142:1–9.
- Liu C, Roddatis V, Kenesei P, et al. Shear-band thickness and shear-band cavities in a Zr-based metallic glass. Acta Mater. 2017;140:206–216.
- Liu C, Ikeda Y, Maass R. Strain-dependent shear-band structure in a Zr-based bulk metallic glass. Scr Mater. 2021;190:75–79.
- Schmidt V, Rösner H, Peterlechner M, et al. Quantitative measurement of density in a shear band of metallic glass monitored along its propagation direction. Phys Rev Lett. 2015;115:035501.
- Furukawa A, Tanaka H. Violation of the incompressibility of liquid by simple shear flow. Nature. 2006;443:434–438.
- Zhang M, Chen Y, Li W. On the origin of softening in the plastic deformation of metallic glasses. Int J Plast. 2019;116:24–38.
- Lobzenko I, Shiihara Y, Iwashita T, et al. Shear softening in a metallic glass: first-principles local-stress analysis. Phys Rev Lett. 2020;124:085503.
- Greer AL, Cheng YQ, Ma E. Shear bands in metallic glasses. Mater Sci Eng R Rep. 2013;74:71–132.
- He J, Kaban I, Mattern N, et al. Local microstructure evolution at shear bands in metallic glasses with nanoscale phase separation. Sci Rep. 2016;6:25832.
- Mu XK, Chellali MR, Boltynjuk E, et al. Unveiling the local atomic arrangements in the shear band regions of metallic glass. Adv Mater. 2021;33:2007267.
- Chellali MR, Nandam SH, Hahn H. Deformation-Induced chemical inhomogeneity and short-circuit diffusion in shear bands of a bulk metallic glass. Phys Rev Lett. 2020;125:205501.
- Schroers J. Processing of bulk metallic glass. Adv Mater. 2010;22:1566–1597.
- Shen LQ, Luo P, Hu YC, et al. Shear-band affected zone revealed by magnetic domains in a ferromagnetic metallic glass. Nat Commun. 2018;9:4414.
- Davani FA, Hilke S, Rosner H, et al. On the shear-affected zone of shear bands in bulk metallic glasses. J Alloy Compd. 2020;837:155494.
- He JJ, Li N, Tang N, et al. The precision replication of a microchannel mould by hot-embossing a Zr-based bulk metallic glass. Intermetallics. 2012;21:50–55.
- Li N, Chen W, Liu L. Thermoplastic micro-forming of bulk metallic glasses: a review. JOM. 2016;68:1246–1261.
- Xia T, Li N, Wu Y, et al. Patterned superhydrophobic surface based on Pd-based metallic glass. Appl Phys Lett. 2012;101:081601.
- Li N, Xia T, Heng LP, et al. Superhydrophobic Zr-based metallic glass surface with high adhesive force. Appl Phy Lett. 2013;102:251603.
- Li N, Xu EJ, Li Z, et al. Tuning apparent friction coefficient by controlled patterning bulk metallic glasses surfaces. Sci Rep. 206;6:39388.
- Greer JR, De Hosson JTM. Plasticity in small-sized metallic systems: intrinsic versus extrinsic size effect. Prog Mater Sci. 2011;56:654–724.
- Chen DZ, Jang D, Guan KM, et al. Nanometallic glasses: size reduction brings ductility, surface state drives its extent. Nano Lett. 2013;13:4462–4468.
- Liontas R, Jafary-Zadeh M, Zeng QS, et al. Substantial tensile ductility in sputtered Zr-Ni-Al nano-sized metallic glass. Acta Mater. 2016;118:270–285.
- Duan G, Wiest A, Lind ML, et al. Bulk metallic glass with benchmark thermoplastic processability. Adv Mater. 2007;19:4272–4275.
- Hufnagel TC, Schuh CA, Falk ML. Deformation of metallic glasses: recent developments in theory, simulations, and experiments. Acta Mater. 2016;109:375–393.
- Kumar G, Tang HX, Schroers J. Nanomoulding with amorphous metals. Nature. 2009;457:868–872.
- Ma J, Huo LS, Zhao DQ, et al. Micro mold filling kinetics of metallic glasses in supercooled liquid state. J Appl Phys. 2013;113:104505.
- Li N, Chen Y, Jiang MQ, et al. A thermoplastic forming map of a Zr-based bulk metallic glass. Acta Mater. 2013;61:1921–1931.
- Mukherjee S, Schroers J, Zhou Z, et al. Viscosity and specific volume of bulk metallic glass-forming alloys and their correlation with glass forming ability. Acta Mater. 2004;52:3689–3695.
- Li Z, Zhang M, Li N. On the vibration-enhanced thermoplastic formability in bulk metallic glasses. Materialia. 2021;19:101189.
- Jiang WH, Atzmon M. Mechanically-assisted nanocrystallization and defects in amorphous alloys: a high-resolution transmission electron microscopy study. Scr Mater. 2006;54:333–336.
- Li J, Wang ZL, Hufnagel TC. Characterization of nanometer-scale defects in metallic glasses by quantitative high-resolution transmission electron microscopy. Phys Rev B. 2002;65:144201.