
 ?Mathematical formulae have been encoded as MathML and are displayed in this HTML version using MathJax in order to improve their display. Uncheck the box to turn MathJax off. This feature requires Javascript. Click on a formula to zoom.
Abstract
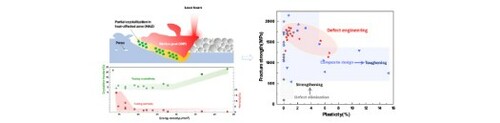
3D printing provides a novel approach to fabricate bulk metallic glass components without limitations in size and geometry. However, defects (porosity and partial crystallization) are inevitable, which are detrimental to mechanical properties. The present work shows that by careful control of these defects in a 3D-printed BMG (Zr60.14Cu22.31Fe4.85Al9.7Ag3), a promising combination of high strength (1.8 GPa), and fairly good plasticity (>1%) and fracture toughness (∼45 MPa m1/2) can be achieved via utilizing the strengthening effect (nanocrystalline precipitation) and toughening effect (micropores-induced shear banding). The results indicate that the mechanical properties of 3D-printed BMGs could be tailored by the defect engineering strategy.
GRAPHICAL ABSTRACT
IMPACT STATEMENT
A promising combination of high strength, and fairly good plasticity and fracture toughness is achieved in 3D-printed bulk metallic glasses via a novel strategy, namely synergistic defect engineering.
Introduction
Bulk metallic glasses (BMGs), a new type of metallic material, have attracted considerable interest due to their disordered atomic structure and unique properties [Citation1–3]. However, the current preparation of BMGs mainly relies on the conventional casting methods [Citation4], imposing the limitation of the size and geometries. In recent years, additive manufacturing (AM), especially selective laser melting (SLM), seems to break through the limitations and could fabricate BMG components with big size and complex geometries [Citation5–8]. Unfortunately, almost all the 3D-printed BMGs prepared by SLM exhibit limited plasticity and fracture toughness, which are even worse than their cast counterparts, due to the introduction of various kinds of defects (e.g. pores, impurity, crystallization, and micro-cracks) during SLM process [Citation9–13]. For example, Bordeenithikasem et al. [Citation11] reported that the involvement of porosity of 0.04% in the printed Zr59.3Cu28.8Nb1.5Al10.4 BMG leads to zero plasticity, while Best et al. [Citation13,Citation14] argued that the inclusion of a small number of oxide impurities could significantly reduce the fracture toughness. In addition, partial crystallization in the heat-affected zone (HAZs), which is another kind of defect, was also found to be harmful to both strength and plasticity in the SLMed Zr55Cu30Ni5Al10 BMG [Citation10]. Therefore, extensive efforts have been devoted to reducing or eliminating these defects to improve the mechanical properties of 3D-printed BMGs.
In fact, defects do not necessarily deteriorate the mechanical properties of BMGs. For example, by introducing micropores, tensile ductility can be achieved in a Zr35Ti30Cu7.5Be27.5 BMG due to the interaction between the micropores and shear bands [Citation15]. Notably, it is reported that the yield strength of 3D-printed Zr50Ti5Cu27Ni10Al8 BMGs could be enhanced by in-situ precipitation of nanocrystals in HAZs [Citation16]. These works indicate that manipulation of defects can be a potential route in tuning mechanical properties of 3D-printed BMGs. Therefore, in the present work, we proposed a new concept of synergistic defects engineering, i.e. by carefully and simultaneously controlling porosity and crystallinity, to achieve a good strength-plasticity/toughness combination in a 3D-printed Zr60.14Cu22.31Fe4.85Al9.7Ag3 BMG. The underlying mechanism for the enhancement of plasticity and toughness by this synergistic effect of defects is discussed.
Materials and methods
Gas atomized powders (<60 μm) of the pre-alloyed Zr60.14Cu22.31Fe4.85Al9.7Ag3 (at%) were used as the feedstock. SLM experiments were conducted with a commercial machine (FORWEDO LM-120, Forwedo) equipped with a Nd: YAG fiber laser device. The laser has a wavelength of 1.06 μm, maximum power of 500 W, and a spot diameter of 80 μm. A strategy of scanning direction of 90° alternatively among layers was adopted to reduce residual stress. The chamber of the SLM machine was vacuumed firstly, then filled with high-purity argon gas to keep the oxygen content less than 100 ppm during SLM process. To investigate the effect of defects on mechanical properties, a set of experiments with various energy densities (E = P/vht [Citation17], where P is the laser power, v is the scanning speed, h is the hatch spacing and t is the powder layer thickness) were conducted, as the two types of defects, i.e. porosity and crystallization fraction, can be adjusted by the applied energy density. The process parameters, such as layer thickness (h = 60 μm) and hatch distance (t = 100 μm), were kept to be constant, while scanning speed and laser power were varied (i.e. v = 1000–1800 mm/s, P = 120–260 W).
The microstructure of the 3D-printed samples under different energy densities was examined by X-ray diffraction (XRD, 7000SX, Shimadzu), scanning electron microscopy (SEM, FEI Sirion 200), and transmission electron microscopy (TEM, FEI Tecnai G20, 300 kV). The fraction of crystallinity of the printed samples was determined by differential scanning calorimetry (DSC, TA Q2000). The relative mass density of the 3D-printed samples was measured using the Archimedes principle. The density of the as-cast sample (i.e. 6.67 ± 0.01 g/cm3, also measured with Archimedes principle) was set as the reference. The crystallization fraction of 3D-printed samples was obtained by comparing the crystallization enthalpy of the 3D-printed samples with that of the reference amorphous powders [Citation18]. The strength and plasticity of the 3D-printed BMGs were measured by uniaxial compression test at a strain rate of 10−4 s−1 using a Zwick machine (Zwick/Roell 020). The strain rate was controlled by the displacement rate of the crosshead, referring to the elastic part. The true strain was calculated by the formula: εture = −ln(1−εengineering). The compression specimens have the dimension of φ2 mm × 4 mm. The fracture toughness was evaluated via a three-point bending test, and the samples have dimensions of 2 × 4 × 20 mm3 with all surfaces being mechanically polished to a mirror finish. The span was set to be 16 mm, the roller diameter is 2 mm, and the notch depth was half of the sample height with a root radius of approximately 230 μm. The Kq toughness was calculated using the equation [Citation19]:
(1)
(1)
where P is the fracture stress, S is the span between the two support rollers, B is the specimen thickness, W is the specimen width, a is the notch depth and F(a/W) is a configuration correction factor. At least three tests were repeated for each sample to verify the accuracy of the data. Finite element modeling (FEM) simulation was conducted to study the stress/strain distribution in the samples containing various amounts of defects upon compression and three-point bending, and the details of the simulations are described in Figure S1 and Supplementary Note 1 in the Supplementary Materials.
Results and discussion
(a) shows the XRD curves of a few SLMed BMG samples prepared using different energy densities. It can be seen that the structure of the printed samples is closely related to the energy densities applied. Nearly fully amorphous structure is obtained when energy density is below 36.67 J/mm3, while partial crystallization occurs when energy density reaches 43.33 J/mm3, as indicated by the appearance of a few weak diffraction peaks. Quantitatively, the proportion of the crystalline phase in 3D-printed samples was measured by DSC. (b) shows the typical DSC curves of the amorphous powders and a few SLMed samples under different energy densities. The summary of the crystallization fraction under different energy densities is shown in (c). The crystallization fraction is below 8.38% when the energy density is in the range of 14.29–26.67 J/mm3, and increases to 18.12% when the energy density is higher than 36.67 J/mm3. A representative crystalline region (i.e. HAZ) in a printed BMG sample prepared under 19.05 J/mm3 is shown in (d), where spherical-like nanocrystals with diameter ranging from 50 to 200 nm are randomly distributed in the HAZ region (1.83 μm in width). The nanocrystals can be indexed as Al2Zr intermetallic compound based on the selected area electron diffraction (SAED) pattern (see insets of (d)). The molten pools are fully amorphous as expected, due to the fast cooling rate achieved in SLM process.
Figure 1. (a, b) XRD and DSC results of the SLMed Zr60.14Cu22.31Fe4.85Al9.7Ag3 BMG samples fabricated using different energy densities, compared with the original powders; (c) Correlation between the crystallization/porosity fractions of as-printed samples and the energy density; (d) The bright field TEM image of the as-printed BMG with a crystalline fraction of 7.03%. Insets are the selected area electron diffraction (SAED) patterns from regions S1 and S2, respectively; (e) SEM images showing the samples with various porosities.
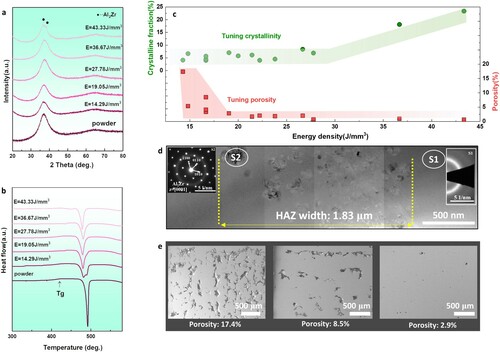
The porosity of 3D-printed BMGs can be also adjusted by changing the energy density, as illustrated in (c). The porosity decreases linearly from 17.4% at the lowest energy density of 14.29 J/mm3 to 3.38% at a modest energy density of 16.67 J/mm3. Further increase of energy density could lead to very low porosity (∼0.67%). (e) shows the typical cross-sectional SEM micrographs of three samples prepared under the energy density of 19.05, 16.67 and 14.29 J/mm3, which have the porosity of 2.87%, 8.47% and 17.40%, respectively. In addition, the size and distribution of pores in the 3D-printed BMGs with low porosity were evaluated by X-ray tomography (XRT). It was found that the pores distribute randomly in the whole sample and most pores have a size of 10–30 μm, and both size and distribution of pores do not show significant difference in the samples with low porosity. These results demonstrate that both the porosity and crystalline fraction could be well adjusted by controlling the energy density, and the trend of the porosity and crystallization is opposite with the increase of energy density ((c)).
Compressive stress–strain curves for the 3D-printed BMGs with varying porosity and crystalline fractions are shown in (a). The results of yield strength (σy), fracture strength (σf) and plasticity (εf) are summarized in Table S1. In (a), the change of mechanical properties in terms of fracture strength and plastic strain can be roughly divided into two regimes, i.e. the crystallization-controlled regime and porosity-controlled regime. In the former, the strength increases gradually with the decrease of crystallization fraction, and the plasticity in this regime is nearly zero. It is worthy of noting that, when the crystalline fraction is between 4% and 7%, the strength of the SLMed BMG samples is enhanced with the increase of crystalline phase, as shown in Table S1. In the porosity-controlled regime, the plasticity increases with increasing porosity. For example, the plastic strain increases from 1.05% to 6.6% as the porosity increases from 2.87% to 17.4%. Notably, even though the fracture strength starts to decrease when the porosity is higher than 5.36%, the 3D-printed BMG still has a strength of 1100 MPa when the porosity reaches 17.4%, this strength value exceeds that of most 3D-printed high-strength alloys reported so far [Citation20].
Figure 2. (a) Compressive stress-strain curves and (b) fracture toughness of the SLMed BMG samples with varying porosity and crystallization fractions.
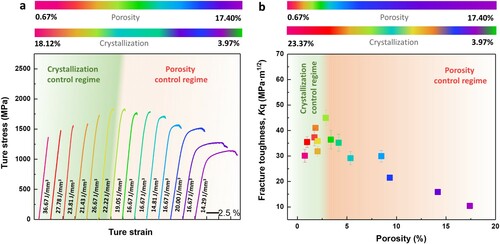
The notch fracture toughness (Kq) of the as-printed BMG samples with different porosities and crystallization fractions were also measured by a three-point bending test, and the results are presented in (b). Similar to the trend in (a), the fracture toughness can be tailored by controlling the crystallization fraction and porosity, which also fallen into two distinct regimes. In the left regime where the porosity is below 2.87%, increasing porosity leads to the enhancement of fracture toughness. For instance, when the porosity increases from 0.67 to 2.87%, and simultaneously the crystallization fraction decreases from 23.37% to 7.03%, the Kq value increases from approximately 30 to 45 MPa m1/2. In contrast, in the right regime where the porosity is above 2.87%, the toughness decreases with the increase of porosity even though the crystallization fraction is kept at a low level (<6.65%). The decrease of toughness in the right regime is attributed to the decreased strength of the high-porosity samples although the plasticity is increased with porosity in this regime. Notably, when the porosity is higher, e.g. at 8.5%, some irregular pores in addition to the round pores appear (as shown in (e)), which cause more severe stress concentration near the notch, further deteriorate the fracture toughness.
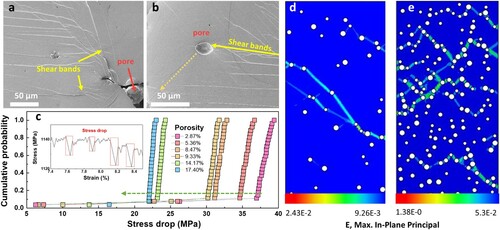
The above results demonstrate that the mechanical properties of the 3D-printed BMGs can be adjusted by controlling porosity and crystallization fraction. The printed BMGs can be strong and tough if these two defects have a good collocation. For example, the sample with crystallization fraction below 4.1% and porosity around 17.4% exhibits the highest plasticity (a plastic strain of 6.5%) and pretty good strength (1.1 GPa) (see (a)). To understand the mechanism of how porosity enhances plasticity, the sample with a porosity of 17.4% was carefully examined after deformation. To clarify how the pores affect shear banding during deformation, this sample was further subjected to compression test, in which a part of the side surfaces of the as-printed rod was first polished to a mirror finish (to help to see the interaction between pores and shear bands), then compressed to fracture. (a,b) show that a large number of shear bands initiated around the pores. This likely results from the stress concentration around pores, which promotes the proliferation and propagation of shear bands. To correlate the porosity and shear band dynamics, we have made a statistical analysis of the serrations (i.e. stress drops, see the inset of (c)) in the stress–strain curves. Generally, the stress drop magnitude reflects shear band stability, i.e. a smaller stress drop indicates a more homogeneous plastic flow, and vice versa [Citation21]. (c) shows the cumulative probability of stress drop as a function of porosity in the different 3D printed BMG samples. It is evident that the higher the porosity, the smaller the stress drop magnitude. Consequently, the high-porosity sample is capable of holding more homogeneous strain and thus better plasticity. This finding is further verified by finite element modeling (FEM) simulations, as displayed in (d,e). As expected, the BMG with a higher porosity (e.g. 17.4% porosity) carried higher and more homogeneous plastic strains during compression than the one with a lower porosity (e.g. 2.87% porosity). It is seen that multiple shear bands along different directions are formed in the sample with higher porosity, while only a major shear band is formed in the sample with lower porosity. The simulations are in good agreement with our experimental observations.
Figure 3. (a, b) Cross-section SEM images showing the interactions between micro-pores and shear bands; (c) The cumulative probability of stress drops for samples with different porosities. Inset shows the enlarged serration region from stress-strain curves; (d, e) Strain field of two BMG samples with a porosity of 2.87% and 17.40% after being compressed to 4% strain in finite element simulation.
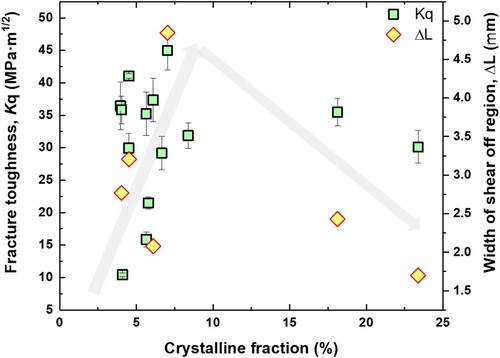
As far as the fracture toughness is concerned, the maximum value of Kq (45 MPa m1/2) is obtained for the sample with a crystallization fraction of 7.03% and porosity of 2.87%. The high-plasticity sample (with a porosity of 17.4%) does not exhibit an optimized fracture toughness, which could be associated with its relatively low strength because fracture toughness is collectively determined by both strength and plasticity [Citation22]. Therefore, differing from the correlation of plasticity and porosity (i.e. monotonous increase), the fracture toughness can only be optimized with an appropriate combination of porosity and crystalline fraction. As quantitatively illustrated in (b) and , with the increase of porosity or crystalline fraction, the toughness always increased first and decreased afterward. When the crystalline fraction is between 4% and 7%, and the porosity is between 0.67% and 2.87%, the toughness is enhanced with the increase of porosity and crystallization fraction due to the strengthening effect by crystalline phases and toughening effect by micro-pores. However, once the crystalline fraction is above 7%, the toughness is inversely deteriorated as compared with the optimized one (see ). Interestingly, this observation is in good consistency with a previous study, which revealed a similar critical crystallization of 7% for the embrittlement in BMGs [Citation23]. The stress concentration between the Al2Zr crystalline phase and the amorphous matrix in the HAZs would become more severe when crystallization fraction is high, leading to ease of crack initiation. Indeed, on the fractured surface, a typical smooth shear-off extension region is observed, which is a result of the discrete notch blunting at the line of intersection of the shear band with the notch root and is associated with the inherent capability of blunting a crack tip to a maximum radius during three-point bending [Citation24]. The width of smooth shear-off extension region (ΔL) reflects the ability against fracture initiation (shown in Figure S2). The trend of ΔL and crystalline fraction () fully agrees with the dependence of Kq with crystalline fraction, verifying that a high crystalline fraction of above a critical value (e.g. 7%) leads to reduced initiation fracture toughness. Note that, previous works [Citation25–28] demonstrate that the relaxation of amorphous phase may also play a role on the fracture toughness of BMG. Therefore, we also measured the relaxation enthalpy of the SLMed BMGs prepared with different energy densities from DSC curves, and the correlation between relaxation enthalpy and fracture toughness is summarized in Figure S3. This result reveals that, for 3D-printed BMGs, there is no correlated relationship between relaxation enthalpy and fracture toughness. For example, the 3D-printed sample with a higher value of relaxation enthalpy (∼7 J/g) exhibits inversely a lower fracture toughness than that with a lower relaxation enthalpy (∼2 J/g). This is different from the case of as-cast BMGs, which do not contain a high level of crystallinity and porosity. Therefore, the major effect on mechanical properties of the 3D-printed BMG is from porosity and crystallinity, rather than relaxation enthalpy (corresponding to free volume), which is possible because pores are mainly the triggers for shear banding, and crystals in HAZs can lead to ease of crack initiation in the 3D-printed BMG.
Figure 4. The relationship between the crystalline fraction and fracture toughness and width of shear-off region.
In the porosity control regime, it is noted that the fracture toughness decreased significantly with the increase of porosity. This is because that tensile stress, which is very sensitive to pores, exists in front of the notch during three-point bending. To confirm the effects of porosity and pore geometry on fracture toughness, we have carried out additional FEM simulations for samples with different pore geometries (e.g. round and rectangle pores) and porosities (2.87–17.4%) during three-point bending, and the results are shown in Figures S4 and S5. The simulation results show that the higher the porosity, the lower the load, and the lower fracture toughness, which is in good consistency with our experimental results. In addition, we found that when the porosity is lower than 9%, the pore geometry (e.g. the sharpness) does not affect the load. However, when the porosity is high (17.4%), the presence of rectangle pores could result in a smaller load, i.e. lower fracture toughness, as compared with round pores. Therefore, the presence of rectangle pores (as shown in ) in the 3D-printed BMG samples has an additional contribution to the reduction of fracture toughness in the high-porosity regime.
Finally, we compare the mechanical properties, in terms of fracture strength and plasticity, of the current 3D-printed BMGs with other reported 3D-printed BMGs and BMG composites [Citation7,Citation9,Citation10,Citation14,Citation29–41], as illustrated in . The conventional strategy via defect elimination is indeed able to effectively strengthen the 3D-printed BMGs, but is invalid to increase plasticity. The strategy via composite design, i.e. adding a secondary phase in BMG matrix, can toughen 3D-printed BMGs, but is always at a cost of strength. By contrast, our defect engineering strategy with a proper combination of porosity and crystallization fraction could achieve a good strength-plasticity combination, therefore, offers a different pathway to improve the mechanical properties of 3D-printed BMGs. Nevertheless, achieving a further combination of strength-plasticity-fracture toughness is still challenging, especially for intrinsically brittle BMG materials, which needs further improvement in future for practice applications.
Figure 5. Plot of fracture strength as a function of plasticity for 3D-printed BMGs and BMG composites. The overall mechanical performance of our optimized materials via defect engineering surpasses that of previously reported 3D-printed BMGs and BMG composites [Citation7, Citation9,Citation10,Citation14,Citation29–41].
![Figure 5. Plot of fracture strength as a function of plasticity for 3D-printed BMGs and BMG composites. The overall mechanical performance of our optimized materials via defect engineering surpasses that of previously reported 3D-printed BMGs and BMG composites [Citation7, Citation9,Citation10,Citation14,Citation29–41].](/cms/asset/56373332-b8eb-47e9-921c-d34dba61e425/tmrl_a_2054291_f0005_oc.jpg)
Conclusions
In summary, we proposed a new strategy, namely synergistic defects engineering, to improve the mechanical properties of 3D-printed Zr60.14Cu22.31Fe4.85Al9.7Ag3 BMGs. Two kinds of defects, porosity and crystallization, are precisely controlled via changing the energy density. The plasticity is improved significantly when the printed BMGs are with low crystallinity (typically less than 5%) and sufficient porosity (>2.8%). The fracture toughness is enhanced when the sample contains a moderate porosity (<2.8%) and crystallinity (<7%). It is revealed that an appropriate amount of micropores can generate multiple shear bands and increase plasticity; while the synergistic effect of both micropores and partial crystallization can enhance the fracture toughness. Therefore, defect engineering is a promising strategy to achieve a good combination of strength-plasticity/toughness for 3D-printed BMGs.
Supplemental Material
Download MS Word (10.5 MB)Acknowledgements
The authors are grateful to the Analytical and Testing Center, Huazhong University of Science and Technology for technical assistance.
Disclosure statement
No potential conflict of interest was reported by the author(s).
Additional information
Funding
References
- Schuh CA, Hufnagel T, Ramamurty U. Mechanical behavior of amorphous alloys. Acta Mater. 2007;55:4067–4109. DOI:https://doi.org/10.1016/j.actamat.2007.01.052.
- Sun BA, Wang WH. The fracture of bulk metallic glasses. Prog Mater Sci. 2015;74:211–307. DOI:https://doi.org/10.1016/j.pmatsci.2015.05.002.
- Wang WH, Dong C, Shek CH. Bulk metallic glasses. Mater Sci Eng R. 2004;44:45–89. DOI:https://doi.org/10.1016/j.mser.2004.03.001.
- Schroers J. Processing of bulk metallic glass. Adv Mater. 2010;22:1566–1597. DOI:https://doi.org/10.1002/adma.200902776.
- Pauly S, Löber L, Petters R, et al. Processing metallic glasses by selective laser melting. Mater Today. 2013;16:37–41. DOI:https://doi.org/10.1016/j.mattod.2013.01.018.
- Gao X, Lin X, Yu J, et al. Selective laser melting (SLM) of in-situ beta phase reinforced Ti/Zr-based bulk metallic glass matrix composite. Scripta Mater. 2019;171:21–25. DOI:https://doi.org/10.1016/j.scriptamat.2019.06.007.
- Lin X, Zhang Y, Yang G, et al. Microstructure and compressive/tensile characteristic of large size Zr-based bulk metallic glass prepared by laser solid forming. J Mater Sci Technol. 2019;35:328–335. DOI:https://doi.org/10.1016/j.jmst.2018.10.033.
- Ouyang D, Zhang P, Zhang C, et al. Understanding of crystallization behaviors in laser 3D printing of bulk metallic glasses. Appl Mater Today. 2021;23:100988. DOI:https://doi.org/10.1016/j.apmt.2021.100988.
- Li XP, Roberts MP, O’Keeffe S, et al. Selective laser melting of Zr-based bulk metallic glasses: processing, microstructure and mechanical properties. Mater Des. 2016;112:217–226. DOI:https://doi.org/10.1016/j.matdes.2016.09.071.
- Ouyang D, Li N, Xing W, et al. 3D printing of crack-free high strength Zr-based bulk metallic glass composite by selective laser melting. Intermetallics. 2017;90:128–134. DOI:https://doi.org/10.1016/j.intermet.2017.07.010.
- Bordeenithikasem P, Stolpe M, Elsen A, et al. Glass forming ability, flexural strength, and wear properties of additively manufactured Zr-based bulk metallic glasses produced through laser powder bed fusion. Addit Manuf. 2018;21:312–317. DOI:https://doi.org/10.1016/j.addma.2018.03.023.
- Best JP, Evenson Z, Yang F, et al. Structural periodicity in laser additive manufactured Zr-based bulk metallic glass. Appl Phys Lett. 2019;115:031902. DOI:https://doi.org/10.1063/1.5100050.
- Best JP, Ast J, Li B, et al. Relating fracture toughness to micro-pillar compression response for a laser powder bed additive manufactured bulk metallic glass. Mater Sci Eng A. 2020;770:138535. DOI:https://doi.org/10.1016/j.msea.2019.138535.
- Best JP, Ostergaard HE, Li B, et al. Fracture and fatigue behaviour of a laser additive manufactured Zr-based bulk metallic glass. Addit Manuf. 2020;36:101416. DOI:https://doi.org/10.1016/j.addma.2020.101416.
- Sarac B, Schroers J. Designing tensile ductility in metallic glasses. Nat Commun. 2013;4:2158. DOI:https://doi.org/10.1038/ncomms3158.
- Lu Y, Huang Y, Wu J. Laser additive manufacturing of structural-graded bulk metallic glass. J Alloys Compd. 2018;766:506–510. DOI:https://doi.org/10.1016/j.jallcom.2018.06.259.
- Simchi A, Pohl H. Effects of laser sintering processing parameters on the microstructure and densification of iron powder. Mater Sci Eng A. 2003;359:119–128. DOI:https://doi.org/10.1016/s0921-5093(03)00341-1.
- Yang G, Lin X, Liu F, et al. Laser solid forming Zr-based bulk metallic glass. Intermetallics. 2012;22:110–115. DOI:https://doi.org/10.1016/j.intermet.2011.10.008.
- ASTM Standard E399. ASTM International, 2009. DOI:https://doi.org/10.1520/e0399-12e03.
- Zhang C, Ouyang D, Pauly S, et al. 3D printing of bulk metallic glasses. Mater Sci Eng R. 2021;145:100625. DOI:https://doi.org/10.1016/j.mser.2021.100625.
- Sun BA, Pauly S, Tan J, et al. Serrated flow and stick–slip deformation dynamics in the presence of shear-band interactions for a Zr-based metallic glass. Acta Mater. 2012;60:4160–4171. DOI:https://doi.org/10.1016/j.actamat.2012.04.013.
- Xu J, Ramamurty U, Ma E. The fracture toughness of bulk metallic glasses. JOM. 2010;62:10–18. DOI:https://doi.org/10.1007/s11837-010-0052-4.
- Ketkaew J, Liu Z, Chen W, et al. Critical crystallization for embrittlement in metallic glasses. Phys Rev Lett. 2015;115:265502. DOI:https://doi.org/10.1103/PhysRevLett.115.265502.
- Chen W, Liu Z, Ketkaew J, et al. Flaw tolerance of metallic glasses. Acta Mater. 2016;107:220–228. DOI:https://doi.org/10.1016/j.actamat.2016.02.002.
- Kumar G, Rector D, Conner RD, et al. Embrittlement of Zr-based bulk metallic glasses. Acta Mater. 2009;57:3572–3583. DOI:https://doi.org/10.1016/j.actamat.2009.04.016.
- Murali P, Ramamurty U. Embrittlement of a bulk metallic glass due to sub-annealing. Acta Mater. 2005;53:1467–1478. DOI:https://doi.org/10.1016/j.actamat.2004.11.040.
- Launey ME, Busch R, Kruzic JJ. Effects of free volume changes and residual stresses on the fatigue and fracture behavior of a Zr–Ti–Ni–Cu–Be bulk metallic glass. Acta Mater. 2008;56:500–510. DOI:https://doi.org/10.1016/j.actamat.2007.10.007.
- Sun Y, Concustell A, Greer AL. Thermomechanical processing of metallic glasses: extending the range of the glassy state. Nat Rev Mater. 2016;1:16039. DOI:https://doi.org/10.1038/natrevmats.2016.39.
- Pauly S, Schricker C, Scudino S, et al. Processing a glass-forming Zr-based alloy by selective laser melting. Mater Des. 2017;135:133–141. DOI:https://doi.org/10.1016/j.matdes.2017.08.070.
- Gibson MA, Mykulowycz NM, Shim J, et al. 3D printing metals like thermoplastics: fused filament fabrication of metallic glasses. Mater Today. 2018;21:697–702. DOI:https://doi.org/10.1016/j.mattod.2018.07.001.
- Zhang C, Wang W, Li Y-C, et al. 3D printing of Fe-based bulk metallic glasses and composites with large dimensions and enhanced toughness by thermal spraying. J Mater Chem A. 2018;6:6800–6805. DOI:https://doi.org/10.1039/c8ta00405f.
- Deng L, Wang S, Wang P, et al. Selective laser melting of a Ti-based bulk metallic glass. Mater Lett. 2018;212:346–349. DOI:https://doi.org/10.1016/j.matlet.2017.10.130.
- Li N, Zhang J, Xing W, et al. 3D printing of Fe-based bulk metallic glass composites with combined high strength and fracture toughness. Mater Des. 2018;143:285–296. DOI:https://doi.org/10.1016/j.matdes.2018.01.061.
- Zhang P, Ouyang D, Liu L. Enhanced mechanical properties of 3D printed Zr-based BMG composite reinforced with Ta precipitates. J Alloys Compd. 2019;803:476–483. DOI:https://doi.org/10.1016/j.jallcom.2019.06.303.
- Zhang C, Li X-M, Liu S-Q. 3D printing of Zr-based bulk metallic glasses and components for potential biomedical applications. J Alloys Compd. 2019;790:963–973. DOI:https://doi.org/10.1016/j.jallcom.2019.03.275.
- Lu X, Nursulton M, Du Y, et al. Structural and mechanical characteristics of Cu50Zr43Al7 bulk metallic glass fabricated by Selective laser melting. Materials. 2019;12:775. DOI:https://doi.org/10.3390/ma12050775.
- Su S, Lu Y. Laser directed energy deposition of Zr-based bulk metallic glass composite with tensile strength. Mater Lett. 2019;247:79–81. DOI:https://doi.org/10.1016/j.matlet.2019.03.111.
- Zhang C, Wang W, Xing W, et al. Understanding on toughening mechanism of bioinspired bulk metallic glassy composites by thermal spray additive manufacturing. Scripta Mater. 2020;177:112–117. DOI:https://doi.org/10.1016/j.scriptamat.2019.10.017.
- Sohrabi N, Jhabvala J, Kurtuldu G, et al. Additive manufacturing of a precious bulk metallic glass. Appl Mater Today. 2021;24:101080. DOI:https://doi.org/10.1016/j.apmt.2021.101080.
- Zhang P, Zhang C, Ouyang D, et al. Enhancement of plasticity and toughness of 3D printed binary Zr50Cu50 bulk metallic glass composite by deformation-induced martensitic transformation. Scripta Mater. 2021;192:7–12. DOI:https://doi.org/10.1016/j.scriptamat.2020.09.044.
- Lu Y, Su S, Zhang S, et al. Controllable additive manufacturing of gradient bulk metallic glass composite with high strength and tensile ductility. Acta Mater. 2021;206:116632. DOI:https://doi.org/10.1016/j.actamat.2021.116632.