
 ?Mathematical formulae have been encoded as MathML and are displayed in this HTML version using MathJax in order to improve their display. Uncheck the box to turn MathJax off. This feature requires Javascript. Click on a formula to zoom.
Abstract
Nanoporous gold as obtained by corrosion of alloys of gold and a less noble metal is a system with manifold applications. The process of dealloying, however, can result in partially porous samples, when dealloying conditions are not optimized with respect to composition and pre-treatment of the master alloy. In the present work, we investigate the dealloying interface between porous material and non-porous alloy in two samples, in which dealloying either stopped automatically or was interrupted manually. Reasons for unintended termination of dealloying in the former case are suggested.
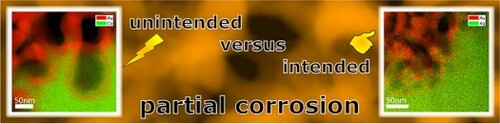
GRAPHICAL ABSTRACT
1. Introduction
Nanoporous gold (npAu) is a material system which has attracted interest especially because of its applications in the fields of catalysis, actuation and sensing [Citation1–6]. It is obtained by dealloying of alloys of gold (Au) and a less noble metal, such as silver (Ag) or copper (Cu) in an acid either by free or by electrochemical corrosion. During this process, less noble atoms are dissolved and Au atoms diffuse along the interface between material and acid forming an open porous structure built up of ligaments and pores which is penetrable for gases and liquids.
The most studied alloy is AuAg. As Au and Ag form a solid solution within the whole compositional range and lattice parameters of Au and Ag are different by only it is possible to obtain homogeneous alloys in terms of structure and composition. The AuCu system is less studied, but a different behaviour, e.g. in catalysis [Citation7–9] as well as the economic advantage that Cu is cheaper than Ag, has increased the interest also for this master alloy. Both alloys are quite different in terms of structure, miscibility and dealloying [Citation10]. The lattice parameter of Cu is smaller by
compared to Au. Au and Cu form a solid solution only above
, otherwise different ordered phases such as
,
or AuCu(I) form depending on the composition [Citation11–13]. A solid solution can also be obtained when samples are annealed above
and quenched afterwards.
The parting limit gives the lower limit for the content of the less noble element (LNE) in the alloy which allows for the formation of porosity. A lower LNE content would lead quickly to a surface passivated by Au atoms such that dealloying stops. Whereas the parting limit for the AuAg system is at [Citation14,Citation15], for AuCu nanoparticles a higher parting limit of
[Citation16] was reported, but this value might be slightly different for bulk AuCu and it depends on dealloying conditions.
In both systems, the LNE cannot be removed completely. NpAu from AuAg alloys (npAuAg) can be obtained with . This value can also be reached for npAuCu, but some works report significantly higher residual Cu-contents between
and
[Citation10,Citation13,Citation17–20] depending on alloy composition, pre-treatment and dealloying conditions.
Bulk npAuCu with a homogeneous structure was reported, e.g. in Refs. [Citation10,Citation20]. However, when we started to prepare npAuCu, we found many samples that were dealloyed accidentally only partially. Partial corrosion is indicated when dealloyed samples tend to break with difficulty after dealloying, whereas completely dealloyed samples break easily. In this work, we investigate the interface between dealloyed porous material and non-porous master alloy in partially corroded npAuCu by energy dispersive X-ray spectroscopy (EDXS) in the scanning mode of a transmission electron microscope (STEM). We compare our results to a sample obtained from a partially dealloyed npAuAg sample. Here dealloying was interrupted manually by removing the sample from the dealloying acid. The optimization of npAu synthesis towards complete corrosion of npAuCu will be addressed in a separate work.
Our measurements (Section 3) show in unintended partially dealloyed npAu an Au rich, wall-like region at the interface which cannot be found in npAu, where dealloying was stopped manually. Furthermore, in npAuCu a significant amount of oxygen (O) is found at the interface indicating the formation of Cu-oxides. Both observations are possible reasons for incomplete corrosion as discussed in Section 4.
2. Materials and methods
Fabrication of npAuCu and npAuAg
Samples were prepared applying a protocol with that we obtained npAu with a homogeneous structure from AuAg master alloys in a previous work [Citation21]. The master alloy ingot with a composition of and
was prepared by arc melting in Ar atmosphere (purity Au
,
) and annealing for homogenization in a quartz tube at
for
, followed by slow cooling for
at room temperature in a reductive atmosphere (
,
). Ribbons of
thickness were produced by cold-rolling, followed by an additional annealing at
for
in the same way as before. Disks with diameters of
were obtained from the ribbons by punching.
Electrochemical corrosion of the disks was done using a three-electrode setup with a Bio-Logic SP200 Potentiostat. A gold wire, which was bent in the form of a ring or basket held the sample and served as working electrode, an reference electrode and a Pt counter electrode were used. With this setup, corrosion can occur from all sides homogeneously through the whole disc. The electrolyte was
in deionized water. Corrosion was performed potentiostatically applying a fixed potential of
for the first 3 minutes followed by
with a fixed potential of
, in a bath at
. Potentials were measured vs
and converted to the standard hydrogen electrode (SHE) potential for better comparability with the literature [Citation20]. The first applied potential aimed at dealloying a surface layer for which an increased content of Au was reported in the literature after the homogenization annealing treatment [Citation22]. The second applied potential was above the critical potential, which we determined with a potentiodynamic polarization curve (see supplemental material Figure S6) aiming at a dealloying current density of
.
An alloy ingot with and
Ag (purity Au
,
) was prepared by melting at
in an oven with the help of a boron nitride crucible. The ingot was annealed in a quartz tube at
for
, followed by slow cooling for
at room temperature in Ar (
) atmosphere. Ribbons of
thickness were produced by cold-rolling, followed by a recovery annealing at
for
and subsequent punching of disks (
diameter).
Free corrosion of disks was done at in concentrated
(
, Alpha Aeser). The sample was submerged in
solution for
. Afterwards, the acid was removed and the sample was rinsed with deionized water three times.
Scanning transmission electron microscopy (STEM)
For STEM thin, electron transparent lamellas were cut from dealloyed disks with a focused ion beam using an FEI Nova 200 FIB. The npAuCu lamella was prepared from the center in cross-section view of the disk after the disk was broken in parts, the npAuAg lamella was obtained cutting into the top view of the disk.
STEM was performed in the scanning mode of a ThermoFisher Spectra 300 (S)TEM microscope equipped with an X-FEG and a Cs-corrector for the probe forming system. An acceleration voltage of and a beam current of
were set, semi-convergence angles of
(npAuAg) and
(npAuCu) were used. The high angle annular dark field (HAADF) signal was collected in an angle range of
using a camera length of
.
Energy dispersive X-ray spectroscopy (EDXS)
EDXS was measured in the same microscope using SuperXG2 EDX detectors. Elemental maps were obtained by plotting the number of detected photons per element after background subtraction as a function of scan position. For these maps and for composition quantification Cu–K, Ag–L and Au–L lines were used. Oxygen maps were obtained evaluating the O–K peak.
3. Results
When we started to prepare npAu from AuCu master alloys, we applied a synthesis protocol which worked well for the corrosion of AuAg master alloys [Citation21] (see Section 2) to obtain samples that are as comparable as possible in catalysis experiments for both master alloys. For STEM measurements, we usually prepare thin electron transparent lamellas from the cross-section view of the disks after the disks were broken. However, we observed that all the disks were hardly breakable, which was a hint that they were dealloyed accidentally only partially. An SEM investigation revealed that the whole fracture surface was porous, but preparing the lamellas, we found non-porous regions below the fracture surface in three out of five lamellas. As the whole surface was porous, hitting a non-porous region below the porous surface was a question of chance. In the literature, it was shown that dealloying is initiated and occurs most rapidly in the vicinity of grain boundaries [Citation18,Citation23]. This is the reason why disks broke at these grain boundaries and the fracture surface was completely porous. The observation of non-porous regions below the porous fracture surface is the starting point of this work.
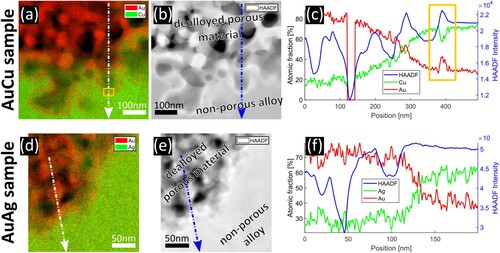
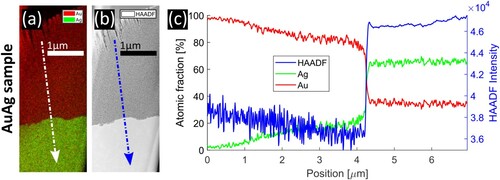
A comparison of the dealloying front in the two samples is shown in Figure . Subfigures (a–c) show the sample in which dealloying stopped automatically, in (d–f) the sample is shown in which dealloying was interrupted manually. The measurement in Figure (c) shows the same behaviour as in Ref. [Citation23]. As each sample contains either Cu or Ag, both, Cu and Ag signal are presented in green to avoid possible misinterpretation by different contrasts. For both samples, an elemental map, an HAADF-STEM image and a composition profile along the lines indicated by arrows are provided. In both samples, the profile indicates a high Au-content ( in npAuCu and
in npAuAg) in the porous region and a composition close to the master alloy in the non-porous (i.e. non-dealloyed) region with a smooth transition in between. A difference can be seen directly where the non-dealloyed material meets porosity. In npAuCu an Au-rich, wall-like line is visible, which cannot be seen in npAuAg. The profile indicates a Cu concentration of
in this region (yellow rectangle), but as this is a concentration in projection over the whole sample thickness the Cu content in the wall might be even lower. Hence, it could be below the parting limit for AuCu. Confirming measurements are provided in Figure S1.
Figure 1. Investigation of the interface between dealloyed material and master alloy. (a–c) npAuCu, dealloying stopped automatically, (d–f) npAuAg, dealloying was interrupted manually. (a) and (d) elemental maps obtained by EDXS, (b) and (e) HAADF-STEM images, (c) and (f) concentration profiles along the lines marked in the maps. In npAuCu an Au-rich, wall-like region (yellow rectangles) is visible at the interface, which cannot be seen in npAuAg.
We made another observation, when we considered the EDX spectrum integrated over the complete areas in Figure . In npAuCu, we observed a significant oxygen peak, which could not be detected in npAuAg. Nitrogen peaks, which could originate from the dealloying acid, were not present in any sample. Quantification of O-content in EDXS is difficult because the O-K peak is at a low energy of , which suffers strong absorption within the sample. However, a qualitative investigation is shown in Figure . In Figure (a), the oxygen distribution at the same position as in Figure (a) is presented, Figure (b) shows the measurement at the same position as in Figure (d), but the signal is only noise, as no oxygen peak was present in npAuAg. In npAuCu, some regions with increased oxygen signal can be identified (white lines). Comparing Figures (a) and (a), we found that the signal is increased especially in the region next to the Au-rich wall in the porous region, where still a high amount of Cu was detected. This is an indication that at the dealloying front a large amount of oxygen species is present in the form of oxidized Cu.
Figure 2. (a) and (c) Oxygen distribution in npAuCu. (c) oxygen distribution in npAuAg (b). (a) and (b) correspond to positions shown in Figure . (c) corresponds to the position shown by HAADF-STEM in (d) and an elemental map in (e). Enriched O signal at the dealloying interface in case of npAuCu, no O signal in npAuAg.
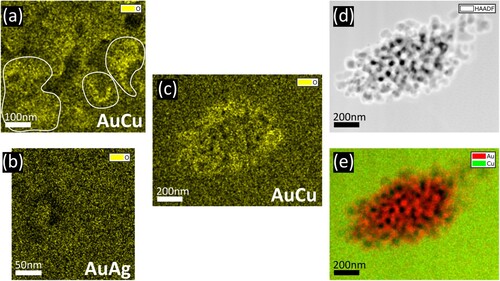
Figures (c–e) confirm this result at another position. The oxygen signal is increased at the interface, where also significant Cu signal is measured, showing the formation of Cu-oxides at the interface. Further measurements are shown in the supplemental material (Figure S2).
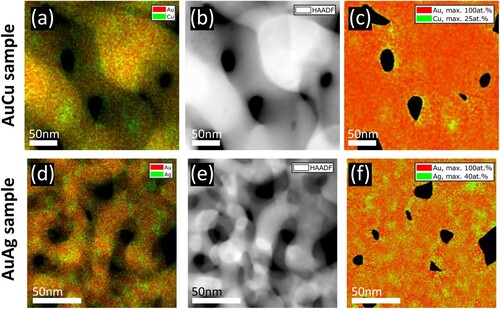
In the literature, an inhomogeneous distribution of residual LNEs was reported [Citation19,Citation24–27]. We made the same observation in our samples as shown in Figure , where (a–c) correspond to npAuCu and (d–f) to npAuAg. Elemental maps, HAADF-STEM images and concentration maps are shown in the left, middle and right columns, respectively. The signal in the elemental map depends on the sample thickness as in thicker regions more X-ray photons are generated. In concentration maps, this thickness dependence is avoided. It reveals in Figure (c) an increased Cu-concentration close to the surface of the ligaments. However, it has to be noted that all maps are projection maps, meaning that plotted signals correspond to an average over the whole sample thickness at each scan point. An increase of Ag content towards the surfaces was not observed in npAuAg (Figure f). A confirming measurement is shown in the supplemental material (Figure S3).
Figure 3. Distribution of the residual LNE in the dealloyed region of npAuCu (a–c) and npAuAg (d–f). (a) and (d) elemental maps, (b) and (e) HAADF-STEM images, (c) and (f) concentration maps. The residual LNE is distributed inhomogeneously.
An investigation of dealloying in npAuAg on a larger length scale is presented in Figure . An elemental map, an HAADF-STEM image and a concentration profile are shown in (a), (b) and (c), respectively. On top of the lamella, severe damage from the FIB preparation process can be seen. Below, a porous region with dominant Au-signal is observed. Below the interface, the non-porous region of the master alloy with dominant Ag-signal was found. The concentration profile (averaging the concentration along the marked line with a width of ) reveals an Au concentration of almost
on top of the sample which is decreasing almost linearly to approximately
close to the interface. The high amount of residual Ag compared to values in the literature is explained by the fact that dealloying was interrupted manually. The interface is visible by a steep drop in Au concentration after which the composition is close to the composition of the master alloy. The profile confirms the molecular dynamics (MD) simulations in Ref. [Citation28] as discussed in Section 4. An overview of the npAuCu sample is provided in the supplemental material (Figure S4).
Figure 4. Investigation of dealloying at a larger length scale in npAuAg. (a) Elemental map, (b) HAADF-STEM image, (c) concentration profile along the lines marked in (a) and (b).
4. Discussion
In the present work, we investigated why corrosion comes to a standstill in some npAuCu samples, noting that this can be avoided by different npAu synthesis protocols [Citation10,Citation20]. Two possible answers can be provided. First, in npAuCu a wall-like region with a Cu concentration significantly was found at the dealloying interface. The parting limit for dealloying of AuCu requires more than
[Citation16] for the formation of porosity. Hence, the Cu content is likely too low at the interface, which leads to a passivated interface by a too thick Au layer such that dealloying stops. An Au-rich layer was also observed by Renner et al. [Citation29–31], when they investigated electrochemical dealloying of AuCu at potentials close to but below the critical potential. Above the critical potential bulk corrosion occurs, below the critical potential an Au-rich surface forms and corrosion stops. As the critical potential depends on composition and crystal structure (AuCu solid solution or
) [Citation20,Citation32–34], regions with different composition or crystal structure in the master alloy would require different applied potentials for corrosion. Otherwise, in some regions of the sample the critical potential might be higher than the applied potential resulting in an Au-rich layer and a termination of corrosion. Regions with different crystal structures could develop during the heating and cooling treatment of the alloy prior to dealloying [Citation34]. In our samples, the remaining non-porous material has the
crystal structure (see supplemental material), which has the higher critical potential compared to the solid solution [Citation20]. Hence it could be an explanation that predominantly material with the solid solution crystal structure is dealloyed, where the applied potential is above the corresponding critical potential. In this way, incomplete corrosion could be avoided, e.g. by a homogeneous distribution of structure and composition of the master alloy. Increasing the applied dealloying potential too far is risky as this would increase the probability to oxidize the Au surface, which would also hinder corrosion. More than that a higher potential leads to npAu that is more brittle [Citation10] impeding its application.
A second reason is the formation of Cu-oxides close to the dealloying interface. According to the Pourbaix diagram of Cu, Cu-oxide formation should be impossible in an acid with a pH value close to 0 [Citation35]. Oxide formation after removal from the acid is not likely as this would not explain, why Cu-oxides were found especially close to the dealloying interface and not everywhere. Hence, it appears more likely that oxides form during dealloying. A possible explanation is an increasing pH value with increasing depth in the pore space. This could be possible if diffusion of acid and dissolved ions through pores is too slow at the applied temperature. For npAuCu pH
could allow for the formation of Cu-oxides for the conditions applied [Citation35]. For npAuAg pH
is required to allow for Ag-oxide formation [Citation36] which is seemingly not fulfilled as no Ag-oxides were found. The removal of Cu-oxides from the pore space is more difficult than the removal of dealloyed
, which is a second explanation why dealloying stopped in npAuCu. The formation of oxidized Cu in npAuCu was also found in other works [Citation10,Citation27,Citation37].
The increase of Cu-content approaching npAuCu surfaces is surprising as a Cu-rich core and an Au-rich shell were proposed for AuCu nanoparticles [Citation12,Citation38]. On the other hand, a rearrangement was found when the samples were exposed to air [Citation22,Citation39]. Our samples were exposed to air, which explains increased Cu-contents at ligament surfaces. Cu should then be present in oxidized form, but the oxygen EDXS signal in these porous regions was too low to confirm this suggestion.
In Ref. [Citation28], MD simulations demonstrated that after primary dealloying the corrosion front has moved fast through the sample leaving a large amount of residual Ag. Secondary dealloying is much slower and results in a coarsening of the structure and a slow removal of residual Ag. In our experiment (Figure ), primary and secondary dealloying cannot be separated. Primary dealloying results in the porous structure, secondary dealloying results in a slow increase of residual Ag from the top of the sample approaching the dealloying front. The earlier secondary dealloying is initiated, the less residual Ag remains in the sample. Although numerical values of composition and dealloying velocity depend on many experimental parameters and cannot be compared quantitatively with the values of MD simulations, experiment and simulation [Citation28] are qualitatively in very good agreement.
5. Conclusion
We identified two reasons, why dealloying stopped automatically in our npAuCu samples. First, an Au-rich, wall-like region was found at the interface between non-dealloyed and dealloyed materials. The Cu-content in this wall is which might be below the parting limit for the formation of porosity. This wall could form at interfaces between master alloy regions with different crystal structure or composition and therefore different critical potentials. Second, oxidized Cu was found at the interface, which might form due to higher pH in the pore space and which is more difficult to remove from the pores than
. In npAuCu increased Cu-contents were found at the surfaces, no increased Ag-content was found at surfaces of npAuAg. An investigation of the dealloying front on a larger length scale revealed very good agreement with MD simulations in the literature.
Supplemental Material
Download PDF (4.8 MB)Disclosure statement
No potential conflict of interest was reported by the author(s).
Additional information
Funding
References
- Kramer D, Viswanath RN, Weissmüller J. Surface-stress induced macroscopic bending of nanoporous gold cantilevers. Nano Lett. 2004;4(5):793–796. doi: 10.1021/nl049927d
- Zielasek V, Jürgens B, Schulz C, et al. Gold catalysts: nanoporous gold foams. Angew Chem Int Ed. 2006;45(48):8241–8244. doi: 10.1002/anie.200602484
- Xu C, Su J, Xu X, et al. Low temperature CO oxidation over unsupported nanoporous gold. J Am Chem Soc. 2007;129(1):42–43. 10.1021/ja0675503
- Biener J, Wittstock A, Zepeda-Ruiz LA, et al. Surface-chemistry-driven actuation in nanoporous gold. Nat Mater. 2009;8(1):47–51. doi: 10.1038/nmat2335
- Wittstock A, Zielasek V, Biener J, et al. Nanoporous gold catalysts for selective gas-phase oxidative coupling of methanol at low temperature. Science. 2010;327(5963):319–322. http://www.sciencemag.org/content/327/5963/319.abstract
- Stenner C, Shao LH, Mameka N, et al. Piezoelectric gold: strong charge-load response in a metal-based hybrid nanomaterial. Adv Funct Mater. 2016;26(28):5174–5181. 10.1002/adfm.201600938
- Kameoka S, Tsai A. CO oxidation over a fine porous gold catalyst fabricated by selective leaching from an ordered AuCu3 intermetallic compound. Catal Letters. 2008;121(3-4):337–341. doi: 10.1007/s10562-007-9344-x
- Kameoka S, Tsai AP. Oxidation behavior and catalytic property of intermetallic compound AuCu. Catal Today. 2008;132(1-4):88–92. 11th Korea-Japan Symposium on Catalysis, 21-23 May 2007, Seoul, Korea; https://www.sciencedirect.com/science/article/pii/S092058610700911X.
- Bracey CL, Ellis PR, Hutchings GJ. Application of copper-gold alloys in catalysis: current status and future perspectives. Chem Soc Rev. 2009;38(8):2231–2243. doi: 10.1039/B817729P
- Zhong Y, Markmann J, Jin HJ, et al. Crack mitigation during dealloying of Au25Cu75. Adv Eng Mater. 2014;16(4):389–398. doi: 10.1002/adem.201300211
- Okamoto H, Chakrabarti D, Laughlin D, et al. The Au–Cu (gold–copper) system. J Phase Equilibria. 1987;8(5):454.
- Guisbiers G, Mejia-Rosales S, Khanal S, et al. Gold–copper nano-alloy, “tumbaga”, in the era of nano: phase diagram and segregation. Nano Lett. 2014;14(11):6718–6726. PMID: 25338111 doi: 10.1021/nl503584q
- El Mel AA, Boukli-Hacene F, Molina-Luna L, et al. Unusual dealloying effect in gold/copper alloy thin films: the role of defects and column boundaries in the formation of nanoporous gold. ACS Appl Mater Interfaces. 2015;7(4):2310–2321. PMID: 25562716 doi: 10.1021/am5065816
- Maier I, Fernández S, Galvele J. The stress corrosion cracking of AgAu alloys. Corros Sci. 1995;37(1):1–16. https://www.sciencedirect.com/science/article/pii/0010938X9400099R
- Newman R, Corcoran S, Erlebacher J, et al. Alloy corrosion. MRS Bullet. 1999;24(7):24–28.
- Li GG, Villarreal E, Zhang Q, et al. Controlled dealloying of alloy nanoparticles toward optimization of electrocatalysis on spongy metallic nanoframes. ACS Appl Mater Interfaces. 2016;8(36):23920–23931. 10.1021/acsami.6b07309
- Lu X, Balk T, Spolenak R, et al. Dealloying of Au–Ag thin films with a composition gradient: influence on morphology of nanoporous Au. Thin Solid Films. 2007;515(18):7122–7126. https://www.sciencedirect.com/science/article/pii/S0040609007003355
- Morrish R, Dorame K, Muscat A. Formation of nanoporous Au by dealloying AuCu thin films in HNO3. Scr Mater. 2011;64(9):856–859. http://www.sciencedirect.com/science/article/pii/S1359646211000224
- Chauvin A, Delacôte C, Molina-Luna L, et al. Planar arrays of nanoporous gold nanowires: when electrochemical dealloying meets nanopatterning. ACS Appl Mater Interfaces. 2016;8(10):6611–6620. PMID: 26926232 doi: 10.1021/acsami.5b11244
- Tse AY, Karasz EK, Sieradzki K. Dealloying and morphology evolution of ordered and disordered Cu3Au. Scr Mater. 2020;176:112–116. http://www.sciencedirect.com/science/article/pii/S1359646219305421
- Lackmann A, Mahr C, Schowalter M, et al. A comparative study of alcohol oxidation over nanoporous gold in gas and liquid phase. J Catal. 2017;353:99–106. http://www.sciencedirect.com/science/article/pii/S0021951717302518
- Völker E, Williams FJ, Calvo EJ, et al. O2 induced Cu surface segregation in Au–Cu alloys studied by angle resolved XPS and DFT modelling. Phys Chem Chem Phys. 2012;14(20):7448–7455. doi:10.1039/C2CP40565B
- Badwe N, Chen X, Schreiber DK, et al. Decoupling the role of stress and corrosion in the intergranular cracking of noble-metal alloys. Nat Mater. 2018;17(10):887–893. doi: 10.1038/s41563-018-0162-x
- Krekeler T, Straßer AV, Graf M, et al. Silver-rich clusters in nanoporous gold. Mater Res Lett. 2017;5(5):314–321. doi: 10.1080/21663831.2016.1276485
- Mahr C, Kundu P, Lackmann A, et al. Quantitative determination of residual silver distribution in nanoporous gold and its influence on structure and catalytic performance. J Catal. 2017;352:52–58. http://www.sciencedirect.com/science/article/pii/S0021951717301689
- El-Zoka A, Langelier B, Botton G, et al. Enhanced analysis of nanoporous gold by atom probe tomography. Mater Charact. 2017;128(Supplement C):269–277. http://www.sciencedirect.com/science/article/pii/S104458031631258X
- Mahr C, Schowalter M, Mitterbauer C, et al. Nanoporous gold dealloyed from AuAg and AuCu: comparison of structure and chemical composition. Materialia. 2018;2:131–137. http://www.sciencedirect.com/science/article/pii/S258915291830053X
- Li Y, Ngo-Dinh BN, Markmann J, et al. Evolution of length scales and of chemical heterogeneity during primary and secondary dealloying. Acta Mater. 2022;222:117424. https://www.sciencedirect.com/science/article/pii/S135964542100803X
- Renner FU, Stierle A, Dosch H, et al. Initial corrosion observed on the atomic scale. Nature. 2006;439(7077):707–710. doi: 10.1038/nature04465
- Renner FU, Stierle A, Dosch H, et al. In situ x-ray diffraction study of the initial dealloying and passivation of Cu3Au (111) during anodic dissolution. Phys Rev B. 2008;77(23):235433. 10.1103/PhysRevB.77.235433
- Pareek A, Borodin S, Bashir A, et al. Initiation and inhibition of dealloying of single crystalline Cu3Au (111) surfaces. J Am Chem Soc. 2011;133(45):18264–18271. doi: 10.1021/ja2054644
- Parks B, Fritz J, Pickering H. The difference in the electrochemical behavior of the ordered and disordered phases of Cu3Au. Scr Metall. 1989;23(6):951–956. https://www.sciencedirect.com/science/article/pii/0036974889902767
- Moffat TP, Fan FRF, Bard AJ. Electrochemical and scanning tunneling microscopic study of dealloying of Cu3Au. J Electrochem Soc. 1991;138(11):3224–3235. doi: 10.1149/1.2085396
- Xia J, Ambrozik S, Crane CC, et al. Impact of structure and composition on the dealloying of CuxAu(1−x) bulk and nanoscale alloys. J Phys Chem C. 2016;120(4):2299–2308. doi: 10.1021/acs.jpcc.5b11637
- Beverskog B, Puigdomenech I. Revised pourbaix diagrams for copper at 25 to 300C. J Electrochem Soc. 1997;144(10):3476–3483. http://jes.ecsdl.org/content/144/10/3476.abstract
- Hans M, Mathews S, Mücklich F, et al. Physicochemical properties of copper important for its antibacterial activity and development of a unified model. Biointerphases. 2016;11(1):018902. doi: 10.1116/1.4935853
- Wang LC, Zhong Y, Widmann D, et al. Oxygen adsorption and low-temperature CO oxidation on a nanoporous Au catalyst: reaction mechanism and foreign metal effects. Top Catal. 2018;61(5-6):446–461. doi: 10.1007/s11244-017-0881-2
- Reyes-Nava JA, Rodríguez-López JL, Pal U. Generalizing segregation and chemical ordering in bimetallic nanoclusters through atomistic view points. Phys Rev B. 2009;80(16):161412. 10.1103/PhysRevB.80.161412
- Meitzner G, Via GH, Lytle FW, et al. Structure of bimetallic clusters. extended X-ray absorption fine structure (EXAFS) studies of Ag–Cu and Au–Cu clusters. J Chem Phys. 1985;83(9):4793–4799. doi:10.1063/1.449005