
ABSTRACT
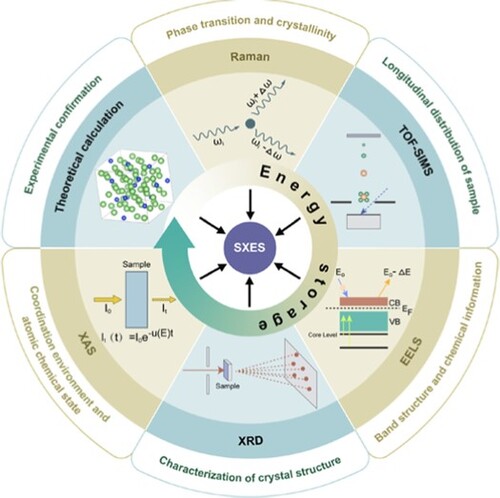
A wide range of advanced characterization tools has been exploited for energy issues. Soft X-ray emission spectroscopy (SXES) equipped with electron microscopy as an emerging analysis tool has made its debut in energy storage recently. The emergence of SXES provides powerful opportunities to explain the energy storage mechanisms, especially in the field of silicon-based anode for lithium-ion batteries. Herein, we summarize the SXES principles, development process and the unique advantages of SXES as well as coupling with other techniques. We further put forward our reasonable outlook for the development and application of SXES that will serve widely in materials science.
GRAPHICAL ABSTRACT
IMPACT STATEMENT
This review pioneers a themed application of the emerging soft X-ray emission spectroscopy, herein mechanistic insight into lithium ion batteries.
1. Introduction
Lithium-ion batteries (LIBs) have switched on rechargeable world and revolutionized the energy systems [Citation1–6]. In 1976, Rockwell Company first used Si as an electrode material for LIBs and discovered the potential of Si as an anode material. Silicon anode (Li15Si4) based on alloying and conversion mechanisms have been vigorously studied for their decisive leading theoretical specific capacity (∼3579 versus ∼372 mAh/g for graphite) [Citation7,Citation8]. Unfortunately, their practical utilization is mainly hindered by large volume expansion in alloying process. In other words, the alloy formation of lithium with silicon will result in the damage of the brittle Si, which impedes the energy density [Citation9–11]. Thus, it will be very informative via the utilization characterization techniques to explore structural, property and dynamic changes in anode materials at nanometer or atomic scale [Citation12–15].
Meanwhile, the development of spectroscopy has provided opportunities to accurately reveal structural evolution during (de-)lithiation of Si anode. Information about crystal structure, ion occupancy, bond length, coordination number and charge transfer in anode can be obtained through electron energy loss spectroscopy (EELS), time-of-flight secondary ion mass spectrometry (TOF-SIMS), X-ray diffraction (XRD), neutron diffraction (ND), X-ray absorption spectroscopy (XAS), X-ray photoelectro spectroscopy (XPS) and Raman spectra.
Herein, soft X-ray emission spectroscopy (SXES), as a valence electron spectroscopy attached to conventional electron microscopy (SEM and TEM), shows effective and incomparable advantages in clarifying the evolution of electronic structures [Citation16]. Compared with XAS, SXES has simple required experimental conditions and excellent spatial resolution; in contrast with EELS, the unique feature of SXES is the density of states (DOS) of valence band (VB) can be obtained; in comparison with EDS, it has the unique advantage on illustrating Li element. Furthermore, any complex sample preparation or higher vacuum conditions are not necessary during testing. By virtue of the advantages, SXES can couple with advanced equipment (such as EELS, high energy TEM, etc.) to obtain detailed information in LiSi alloy during the charging and discharging process. In addition, these characterization techniques are also spreading to aqueous batteries, dual-ion batteries, hydrogen evolution reaction and oxygen reduction reaction as a supplement, recently.
In this short review, we briefly describe the principle and the development process of SXES, and have summarized all typical works of SXES combined with different analytical methods for Si anode in lithium-ion batteries. At the end, we present some unique insights and reasonable prospects for the development direction of SXES. This review will stimulate more interests in SXES characterization for the field of electrochemical energy storage and conversion, and consequently facilitate the development of several other research areas.
2. Fundamental and development of SXES
Electron microscopy plays an indispensable role in the development of materials science. That is because electron microscopy can provide higher spatial resolution (micron or nanometer scale). Meanwhile, many spectral analysis tools (such as energy dispersive spectroscopy (EDS), wavelength dispersive spectrometer (WDS) and EELS) equipped with electron microscopes have emerged. These spectral analysis tools have a very fine energy resolution. By combining them together, we can obtain both high energy resolution and high spatial resolution results during the analysis.
In the last two decades, Terauchi et al. developed SXES, a spectral analysis tool based on electron microscopy. The energy resolution and limit of detection of SXES can reach 0.3 eV and 20 ppm, respectively, which is superior to EDS (120–130 eV and 5000 ppm) and WDS (8 eV and 100 ppm). This means that the birth of SXES provides more possibilities for studying the finer electronic structure of materials. In addition, SXES has the advantage of visualization and selection of the analyzed areas, which allows SXES to obtain local or average information for a material.
The detection principle of SXES is shown in Figure (a,b). When an electron beam irradiates a material, the inner electrons at lower energy levels (such as K-layer electrons) are excited by the incident electron beam and escape from their original orbits. At the same time, energy level transition will occur for the outer layer electrons (such as L-layer or M-layer electrons) at the higher energy levels. In order to keep the whole system in a stable state, electrons in higher energy orbitals need to release extra energy during the process of energy level transition (Figure (a)). In other words, electron transition between different energy levels is mainly responsible for the emission of X-ray. These X-rays are collected by focusing mirror and guided to the diffraction grating. Varied-line-spacing (VLS) grating enables simultaneous detection of multiple X-rays using a CCD. Finally, the soft X-ray emission spectrum is obtained through computer software processing (Figure (b)) [Citation17]. In short, SXES can identify the information of bulk phase of materials in non-destructive means. It is because SXES detects the escaped photon energy, the detection depth of SXES locates between a few nanometers and several hundred nanometers.
Figure 1. (a) Electron transition of EELS (dotted arrow) and XES (solid arrow). (b) Schematic diagram of SXES.
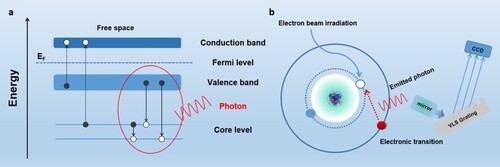
Since X-ray emission is resulted from the electron transitions from the valence band (bonding electrons) to the core level, which is caused by the electron beam irradiation. The emitted X-rays carry the information about the energy state of the bonding electrons (such as 2s electron of Li, 2s and 2p electrons of C). By detecting the emission of X-ray caused by electron transition from the VB to the inner shell (Figure (a)), the partial DOS of the VB (bonding electrons) can be obtained. Since the core energy level states possess a good symmetry, the emission intensity distribution reflects the partial DOS of VB with symmetry [Citation18–21]. For this reason, SXES can be used in conjunction with EELS for total electronic structural analysis, which is critical for materials analysis [Citation22,Citation23]. Although EELS based on electron microscopy has the advantage of obtaining the DOS of the conduction band (CB) [Citation24,Citation25], it is not sufficient for analyzing the total electronic structure [Citation23]. In fact, we also need to have knowledge of the DOS of valence band. At this point, the combination of SXES and EELS has solved this problem very well [Citation19,Citation26].
Soft X-ray emission spectroscopy as a spectroscopy analysis method attached to electron microscopy. The goal is to obtain higher energy resolution. The grating, as a decisive part to improve the resolution, has also undergone several generations of development.
In 2000, Terauchi et al. developed the first generation sub-eV resolution soft X-ray spectrometer connected to the transmission electron microscope (JEM 2000FX). The spectrometer consists of a VLS grating and a pertier cooling CCD detector. For the first time, the partial DOS of the VB has been observed in a specific sample region with 0.6 eV energy resolution in TEM. However, since the spatial resolution is only 1 μm, it is far from enough to analyze even smaller structures [Citation18].
The second generation of soft X-ray emission spectrometer, in 2002, was developed. Compared with the first generation, the energy resolution was improved from 0.6 to 0.4 eV, accompanied with the spatial resolution from 1 μm to 400 nm. Two different gratings can be set, and the energy range at 60–1200 eV. The experiment result was confirmed by a theoretical calculation. The σ bond length of hexagonal boron nitride (h-BN) is shorter than that of cubic boron nitride (c-BN) [Citation27]. However, the collection angle and energy resolution in the higher energy region are still not sufficient.
Therefore, the third-generation soft X-ray emission spectrometer was further developed. The spectrometer has updated mirrors and VLS gratings and has excellent energy resolution (0.7 eV) around 1000 eV [Citation28]. Subsequently, in 2010, two wavelength dispersive soft X-ray emission spectrometers were reported, which increased the energy range to ∼2400 eV with both improved energy and spatial resolution [Citation19]. So far, SXES has been becoming more mature technique to describe the physical properties of materials at nanoscale.
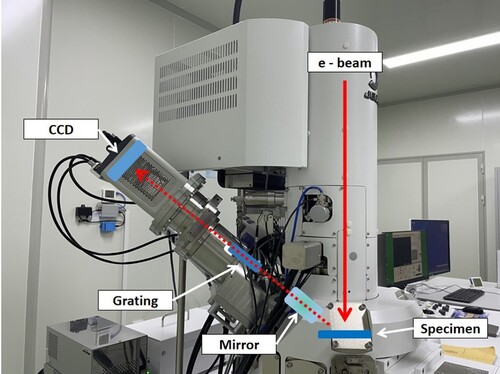
Figure 2. Soft X-ray emission spectrometer (SS-94000SXES) attached to a SEM (JSM-7900F) equipped at Jilin University marked with the key parts.
3. Applications in Si-based anode of lithium-ion batteries
The anode acts as the carrier of lithium ions and electrons during the charging and discharging process in the lithium battery. Structure and behavior of the anode largely affect the (de-)lithiation process [Citation29–31].
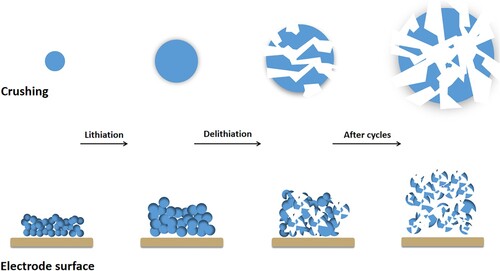
In early rechargeable batteries, lithium metal was one of the most favored anodes. However, due to a serious Li retention problem with lithium metal, researchers have turned their attention to alternative anode including Si. One expects Si to form Li-Si alloy with Li, thus solving the problem of Li retention [Citation29]. In addition, silicon-based anode (Li22Si5) has a larger theoretical capacity (4200 mAh/g), which is more than 10 times that of graphite materials [Citation1,Citation29]. It can embed a large amount of Li+ into Si. However, the silicon-based anode also has certain shortcomings that limit its commercial application. During the lithiation process, the anode materials undergo an irreversible volume expansion (∼380%), resulting in high stress and strain that disintegrates electrode materials (Figure ). As well as low conductivity, low first-cycle coulombic efficiency and poor cycle stability also exist [Citation32,Citation33].
Figure 3. Diagram of silicon anode failure. Si anode undergoes volume expansion and material pulverization, as the number of electrode cycles increases.
In order to solve these problems and gain deep insight into the mechanism of Si-based anode during lithiation, many researchers have been engaged in electrochemical lithiated silicon (EC-LiSi) [Citation34–36]. Two viewpoints have emerged recently. One believes that the transformation from amorphous LixSi (a-LixSi) to crystalline Li15Si4 (c-Li15Si4) occurs during the lithiation (alloying) process of the Si anode, and another argues that only amorphous LixSi (a-LixSi) is formed during this process [Citation37,Citation38]. SXES, as a spectral analysis method equipped in electron microscopy, is more powerful in revolving chemical bonding state of lithium alloy at a small region.
In addition, SXES has several unique advantages [Citation19]. The first one is the detection depth of SXES within a range of several to hundred nanometers. This enables SXES to provide non-destructive analysis and obtain bulk information from the samples. Secondly, since the electron transition occurs inside a material, non-conductive materials can be detected by SXES. Thirdly, since SXES also has very high energy resolution (0.3 eV) and detection limit (20 ppm), the high energy resolution SXE spectrum can be used to analyze the state of chemical bonding. Finally, and most importantly, SXES can analyze Li elements, due to its detection energy range from 50 to 2300 eV. As a result, it is very powerful for applications in lithium-ion batteries.
3.1. Integration with synchrotron radiation (SR) light source
Soft X-ray emission spectroscopy, an emerging spectroscopic analysis method, can be integrated with traditional analysis methods to yield brilliant results in the analysis of Si-based anode materials of Li-ion batteries.
Aoki et al. prepared electrochemical lithium silicon (EC-LiSi) by electrochemical lithiation of Si (111). And they analyzed composition and electronic states of a-LixSi and c-Li15Si4 during lithiation by combining SXES with X-ray diffraction (XRD) with synchrotron radiation (SR) [Citation39]. EC-LiSi was cut by using focused ion beam (FIB) to prepare cross-sections, and the four-layer structure was clearly observed by SEM (Figure (d)). Then, the cross-sections were analyzed by using SXES system (JEOL, SS-94000SXES equipped with JS50XL grating) to obtain Si-L2,3 and Li-K emission spectra (Figure (a)). The incident electron energy is 5 keV, and the probe current and acquisition time are 50 nA and 200 s, respectively. In general, three peaks appear in Si-L2,3 emission spectrum of crystalline silicon (two peaks and a broad shoulder). These peaks correspond to the sp3 hybrid orbital (Si–Si bond) present in c-Si and the S-symmetric component of the sp3 hybrid, respectively [Citation40]. When c-Si forms LiSi alloy (alloying process), the number of electrons in the sp3 hybrid orbital decreases, and the Si-L2,3 emission spectrum shifts to the higher energy side (Figure (b)). It is attributed to the fact that Si in LiSi alloy has more negative charges than Si in c-Si. In the process of LiSi alloy formation, the formation of Li-Si bonds is accompanied by breaking of the Si–Si bonds. The Li-K emission spectrum is observed in the upper two-layer structure, which shifts to the lower energy side relative to Li metal. Thus, it proves that Li in LixSi alloy has a positive charge (Figure (c)). The SXES results show that the Si anode undergoes partial electron transfer, during the lithiation process. The specific structure of each layer is explained by using XRD with SR (Figure (e–g)). And comparing the Si-L2,3 spectra with the reported DOS of various LixSi alloy. The second layer was found to consist of a-Li15Si4, a-Li13Si4 and/or c-Li13Si4 alloy. Finally, it is concluded that the third layer is a mixed phase by fitting the spectra of the other two layers (Figure (a)).
Figure 4. (a) SXES of EC-LiSi four-layer cross-section. (b) Detailed spectral information in the Si-L2,3 region of the four-layer spectrum, compared with the C-Si. (c) Detailed SXE spectra details in the Li-K region of the four-layer spectrum, compared with the Li metal. (d) SEM image of EC-LiSi cross-section. (e–g) Out-of-plane XRD pattern of the different samples. (e) EC-LiS of Si (111), along the [111] direction. (f) Si (111) along the [02-2] direction. (g) Si (111) along the [11-2] direction (The blue and the black line represent the calculated results and the results in the references, respectively). Copyright 2016, Wiley-VCH [Citation39].
![Figure 4. (a) SXES of EC-LiSi four-layer cross-section. (b) Detailed spectral information in the Si-L2,3 region of the four-layer spectrum, compared with the C-Si. (c) Detailed SXE spectra details in the Li-K region of the four-layer spectrum, compared with the Li metal. (d) SEM image of EC-LiSi cross-section. (e–g) Out-of-plane XRD pattern of the different samples. (e) EC-LiS of Si (111), along the [111] direction. (f) Si (111) along the [02-2] direction. (g) Si (111) along the [11-2] direction (The blue and the black line represent the calculated results and the results in the references, respectively). Copyright 2016, Wiley-VCH [Citation39].](/cms/asset/e373befb-f48b-489f-a2f6-10253e21b36f/tmrl_a_2141586_f0004_oc.jpg)
In 2019, Aoki et al. analyzed the (de-)lithiation of Si (111) and Si (100) single-crystal surface by using surface X-ray diffraction (SXRD) and SXES [Citation41]. During the lithiation process, a three-layer structure also appears on the Si (100) and Si (111) substrates. The structure of the first and second layers is identical. However, the structure of the third layer on the two Si substrates is completely different. The third layer on Si (111) is a mixture phase of a-Li15/13Si4 and c-Si, and on Si (100) is c-Si and a little of Li atoms. The lithium atoms in Si (100) and Si (111), holding different diffusion rates, are responsible for the aforementioned difference [Citation42]. By the combination of SXES and XRD with SR, the specific products of Si during the alloying reaction with Li have been well explained.
3.2. Combined with Raman spectroscopy
Compared with traditional energy dispersive X-ray spectroscopy, SXES has the advantage of capability to analyze the element of Li. It can intuitively observe the distribution of Li in a material [Citation43,Citation44]. Raman spectroscopy can distinguish Si with different crystallinity [Citation45]. Therefore, the (de-)lithiation reactions of Si-based anode in lithium-ion batteries can be elucidated by using SXES and Raman together.
In different electrolytes, Si anode will show different states. Si anode will show improved cycle stability and coulombic efficiency in FSA-based ionic-liquid electrolyte, compared with PC-based organic electrolyte. Yamaguchi et al. analyzed this phenomenon by combining SXES and Raman mapping [Citation46]. Spectral analysis of the Si anode after cycling in organic electrolyte and ionic-liquid electrolyte were conducted, respectively. In the SXE spectra, not all the measurement points in the organic electrolyte show Li peaks, which proves that the Si anode will undergo more uniform lithiation in the ionic-liquid electrolyte, in contrast to Si anode in FSA-based electrolyte (Figure (b)). The SXE spectra also show that the detected Li is not from Li2O or LiF, but an alloy formed by Li and Si. This is because the peaks of Li in Li2O and LiF do not appear at 54 eV, but on both sides of 54 eV [Citation26]. SXE spectra can also show that the film formed in the ionic-liquid electrolyte is even thinner and more uniform than that in the organic electrolyte. This is because, compared with the organic electrolyte, Si signals were found on the electrode surface after cycling in ionic-liquid electrolyte, and the peak intensity of C/O was lower (Figure (b)). Through Raman mapping measurement, the distribution of a-Si (blue) and c-Si (red) on the electrode can be visually observed, confirming the SXES analysis (Figure (a)).
Figure 5. (a) Raman mapping of the Si electrode surface, in PC-based and FSA-based electrolyte, respectively. (b) SEM images and SXES after Si anode cycling in different electrolytes. Copyright 2017, Wiley-VCH [Citation46]. (c) The detection points of SXES and the corresponding SXE spectra for each point. (d) Raman mapping images of (a) Si-alone in PC-based organic electrolyte, (b) Si-alone in FSA-based electrolytes, (c) P-doped Si in FSA-based electrolytes. Copyright 2019, American Chemical Society [Citation48].
![Figure 5. (a) Raman mapping of the Si electrode surface, in PC-based and FSA-based electrolyte, respectively. (b) SEM images and SXES after Si anode cycling in different electrolytes. Copyright 2017, Wiley-VCH [Citation46]. (c) The detection points of SXES and the corresponding SXE spectra for each point. (d) Raman mapping images of (a) Si-alone in PC-based organic electrolyte, (b) Si-alone in FSA-based electrolytes, (c) P-doped Si in FSA-based electrolytes. Copyright 2019, American Chemical Society [Citation48].](/cms/asset/e0c6fa59-5d00-4ad1-a14c-f36170c6cbf6/tmrl_a_2141586_f0005_oc.jpg)
Furthermore, Yamaguchi et al. also successfully combined SXES and Raman to demonstrate that the lithiation of Si anode would be more uniform in FSA-based electrolyte. And the uniform lithiation could help suppress the volume expansion of Si anode, thereby improving cycling stability. The P-doped Si anode can significantly inhibit the volume expansion of Si in ionic electrolyte, thereby improving the cycling stability [Citation47]. In 2019, Domi et al. directly observed Li storage in Si or P-doped Si anode through SXES, which solve the problem that energy dispersive X-ray spectroscopy cannot observe Li (Figure (c)). It proves that the transformation of Si to Li-rich phase is uniform by combining with Raman mapping (Figure (d)). Such uniform conversion will form a stable film on the electrode surface to suppress the volume expansion of Si [Citation48].
3.3. Complementary with other analytical methods
Soft X-ray emission spectroscopy is not merely combined with some traditional spectral analysis methods, some mathematical analysis methods can also be complementarily combined with SXES. Domi et al. developed a simple and unique analytical method to study the distribution of Li in Si by comparing the peak ratio (A′/A) of Li–Si bonds (A) and Si–Si bonds (A′) in soft X-ray emission spectra with X in LixSi (Figure (a)). Soft X-ray emission spectra were obtained by SS-94000SXE spectrometer attached to a JSM-7800F electron microscope. The acquisition time and probe current were 200 s and 50 nA, respectively. The X value will increase with the number of cycle leads to an inhomogeneous phase distribution and an increase in volume expansion. However, P-doping or use of an ionic-liquid electrolyte will suppress x heterogeneity [Citation49]. In 2021, Domi et al. conducted SXES tests on Li1.00Si electrodes immersed in different electrolytes to analyze Li concentration in Si. Similarly, the peak ratio (A′/A) and x in LixSi were compared. It proved that Li1.00Si impregnated in organic electrolyte has almost no desorption of Li, because the X value of LixSi in the organic electrolyte is the same as that in Li1.00Si powder basically (Figure (b)). Meanwhile, it was also confirmed by combining Raman spectroscopy and XRD that the electrode immersed in the ionic-liquid electrolyte undergoes a phase transition from Li1.00Si to Si (Li desorption). This conclusion is contrary to the electrode in organic electrolytes. Supplemented by other characterization tools for SXES, the performance difference of Li1.00Si electrode in a various of electrolytes is explained [Citation50].
Figure 6. (a) The relationship between peak intensity ratio/volume expansion rate and x in LixSi. Copyright 2020, American Chemical Society [Citation49]. (b) SEM image of the Li1.00Si electrode and the relationship between the A′/A and x in LixSi in different electrolytes. Copyright 2021, American Chemical Society [Citation50]. (c) FFT-filtered experimental Si-L2,3 emission spectra of the different layers. Copyright 2018, American Chemical Society [Citation51].
![Figure 6. (a) The relationship between peak intensity ratio/volume expansion rate and x in LixSi. Copyright 2020, American Chemical Society [Citation49]. (b) SEM image of the Li1.00Si electrode and the relationship between the A′/A and x in LixSi in different electrolytes. Copyright 2021, American Chemical Society [Citation50]. (c) FFT-filtered experimental Si-L2,3 emission spectra of the different layers. Copyright 2018, American Chemical Society [Citation51].](/cms/asset/cb2b3bc8-714d-4cd6-bed3-6f0aaf546119/tmrl_a_2141586_f0006_oc.jpg)
Since the theoretical calculation of the Si-L2,3 emission spectrum in LixSi alloy is seldom reported, there is a lack of certain references when analyzing the data obtained from the experiments. In 2018, Lyalin et al. confirmed by theoretical calculations, as the proportion of Li in the LixSi alloy increases in the process of Si alloying, the emission spectrum of Si-L2,3 shifts toward the high-energy side and becomes narrows (Figure (c)) [Citation51]. This is also consistent with the previous reports [Citation39]. It also confirms that SXES is a powerful tool in analyzing multiphase transitions in crystalline and amorphous structures.
3.4. Miscellaneous applications in electrochemical systems
In the past two years, our research group has successfully applied SXES in the field of energy and electrocatalysis [Citation52–57].
In the recent work of dual-ion batteries, the presence of compound Li K-edge emission peak and the shift of C K-edge emission peak in graphite electrode were detected by SXES technology, which proved the successfully intercalation of Li+ into graphite electrode (Figure (a)). In addition, ex-situ SXES tests of graphite electrodes in different charge and discharge states were conducted. The K-edge peak shift of the treated electrode was larger than untreated one, demonstrating that more anions reacted with the treated electrode [Citation56]. In aqueous batteries, we detected the general information of Bi electrode at (dis)charging states by coupling SXES with X-ray absorption near edge structure (XANES). We illustrated the evolution of the electronic structure of Bi electrode and alkali–metal ions (Li+, Na+ and K+) during charging and discharging. SXES with low excitation energy can excite the leap of Bi outer electrons, leading to electronic dipole transitions from O-layer to inner N-layer (Figure (b)). And we demonstrate that Bi anode captures electrons from alkali–metal ions during the charging process (alloying process) by comparing the shift of the SXES peak. This conclusion corroborates with the results obtained by XANES [Citation55].
Figure 7. (a) SXE spectrum (Li K-edge and C K-edge) of different states graphite paper (GP and GP-Li). Copyright 2022, Elsevier [Citation56]. (b) SXE spectrum of Bi electrode in different electrolytes (Li+, Na+ and K+). Copyright 2022, Elsevier [Citation55]. (c) SXE spectrum and XPS results of the catalyst after the OER. Copyright 2022, Elsevier [Citation57]. (d) SXE spectrum of the catalysts for different reaction time periods, indicating that the –Cl group is replaced by the oxygen group after electrochemical reaction. Copyright 2022, Wiley-VCH [Citation54].
![Figure 7. (a) SXE spectrum (Li K-edge and C K-edge) of different states graphite paper (GP and GP-Li). Copyright 2022, Elsevier [Citation56]. (b) SXE spectrum of Bi electrode in different electrolytes (Li+, Na+ and K+). Copyright 2022, Elsevier [Citation55]. (c) SXE spectrum and XPS results of the catalyst after the OER. Copyright 2022, Elsevier [Citation57]. (d) SXE spectrum of the catalysts for different reaction time periods, indicating that the –Cl group is replaced by the oxygen group after electrochemical reaction. Copyright 2022, Wiley-VCH [Citation54].](/cms/asset/164ef43c-9967-41d9-8fd9-e4ea5662777d/tmrl_a_2141586_f0007_oc.jpg)
In addition, we also extend SXES to electrocatalysis. We have successfully applied SXES to oxygen evolution reaction (OER). FeCoB2 was prepared by molten salt-assisted borothermal reaction. By characterizing the catalyst after the OER reaction, it was confirmed that the B atom after the OER reaction exists in the same form as the B in FeBO4 (Figure (c)). The common results of SXES and XPS show that the stable material on the surface of FeCoB2 is borate [Citation57]. Our research group also successfully prepared an efficient catalyst (Ti2C MQDs/Cu2O/Cu foam) for hydrogen production in alkaline condition, and characterized the catalyst before and after the reaction by SXES. We demonstrate that the –Cl group is replaced by the oxygen group after electrochemical reaction, thus optimizing the HER performance (Figure (d)). The results are consistent with Fourier-transform infrared (FTIR) and XPS analysis [Citation54].
Based on the aforementioned works, it demonstrates that SXES is a promising technology in direct or indirect means, resolving the electronic transitions and phase transitions for materials. Simultaneously, due to the applications in different systems, a detailed problem-orientated analysis is usually involved. In addition, it is not sufficient for SXES to give all the detailed structural analysis for a tested system alone. Therefore, it is necessary to use other characterization techniques in combination with SXES that complement and corroborate each other. A highly reliable conclusion can be therefore obtained.
4. Summary and perspective
As an advanced spectral analysis method, SXES is developing toward high spatial resolution and high energy resolution [Citation16]. In this review, we first describe the principles and advantages of SXES which can provide the stronger evidences to the lithiation process in Si-based anode due to the sensitivity to Li element. In addition, SXES can obtain information on the local structure and electronic properties of a material. Herein, it thoroughly illustrates the structural evolution of Si anode during lithiation (alloying) with SXES. Subsequently, we summarized all the representative works by combining SXES with other spectroscopy techniques (EELS, XPS, Raman, etc.) for a variety of materials. Obviously, SXES will be a very significant and powerful characterization to dissect the material electronic structure information in the fields of material science and electrochemistry.
Despite all these recent advances, this technique is still neglected in more research fields. For instance, SXES, as a convenient spectral analysis tool, is not limited to the energy and catalysis fields. It can also be expanded to other application areas, such as bonding in quasicrystal states [Citation58–60], oxygen vacancy [Citation61], electronic structure and phase transitions [Citation20,Citation23] and interface and composition analysis of films [Citation62–65], and so on.
In addition, the combination of SXES with other spectroscopic techniques will create a huge upsurge in the analysis of reaction mechanisms on the nanoscale. Herein, we present a reasonable prospect. For structural analysis of bulky structure, it will take full advantages combined with TOF-SIMS for more intuitive characterization [Citation66]. For a reaction, the evolution of electronic structure can be characterized more clearly by combining with in-situ devices. In addition, SXES will simplify the atomic structure recognition by assisting with other techniques, and it can facilitate the development of electrocatalysis and energy and even other fields. In short, SXES can be expected to have a more prosperous future in a wide range of research fields.
Disclosure statement
No potential conflict of interest was reported by the author(s).
Additional information
Funding
References
- Armand M, Tarascon JM. Building better batteries. Nature. 2008;451(7179):652–657.
- Croce F, Appetecchi GB, Persi L, et al. Nanocomposite polymer electrolytes for lithium batteries. Nature. 1998;394(6692):456–458.
- Lin R, He Y, Wang C, et al. Characterization of the structure and chemistry of the solid–electrolyte interface by cryo-EM leads to high-performance solid-state Li-metal batteries. Nat Nanotechnol. 2022;17(7):768–776.
- Scrosati B. Challenge of portable power. Nature. 1995;373(6515):557–558.
- Kang B, Ceder G. Battery materials for ultrafast charging and discharging. Nature. 2009;458(7235):190–193.
- Zhang W, Wang D, Zheng W. A semiconductor-electrochemistry model for design of high-rate Li ion battery. J Energy Chem. 2020;41:100–106.
- Mahmood N, Tang T, Hou Y. Nanostructured anode materials for lithium Ion batteries: progress, challenge and perspective. Adv Energy Mater. 2016;6(17):1600374.
- Chan CK, Peng H, Liu G, et al. High-performance lithium battery anodes using silicon nanowires. Nat Nanotechnol. 2008;3(1):31–35.
- Liu N, Lu Z, Zhao J, et al. A pomegranate-inspired nanoscale design for large-volume-change lithium battery anodes. Nat Nanotechnol. 2014;9(3):187–192.
- Zhang ZY, Li ZW, Luo Q, et al. Spontaneous nanominiaturization of silicon microparticles with structural stability as flexible anodes for lithium ion batteries. Carbon N Y. 2022;188:238–245.
- Obrovac MN, Chevrier VL. Alloy negative electrodes for Li-Ion batteries. Chem Rev. 2014;114(23):11444–11502.
- Weker JN, Liu N, Misra S, et al. In situ nanotomography and operando transmission X-ray microscopy of micron-sized Ge particles. Energy Environ Sci. 2014;7(8):2771–2777. DOI:10.1039/C4EE01384K.
- Bhattacharyya R, Key B, Chen H, et al. In situ NMR observation of the formation of metallic lithium microstructures in lithium batteries. Nat Mater. 2010;9(6):504–510.
- Gachot G, Ribière P, Mathiron D, et al. Gas chromatography/mass spectrometry as a suitable tool for the Li-Ion battery electrolyte degradation mechanisms study. Anal Chem. 2011;83(2):478–485.
- Liu H, Wu Q, Guan X, et al. Ionically conductive self-healing polymer binders with poly(ether-thioureas) segments for high-performance silicon anodes in lithium-Ion batteries. ACS Appl Energy Mater. 2022;5(4):4934–4944.
- Terauchi M, Hatano T, Koike M, et al. Recent developments in soft X-ray emission spectroscopy microscopy. IOP Conf Ser: Mater Sci Eng. 2020;891(1):012022.
- Berhaut CL, Dominguez DZ, Kumar P, et al. Multiscale multiphase lithiation and delithiation mechanisms in a composite electrode unraveled by simultaneous operando small-angle and wide-angle X-ray scattering. ACS Nano. 2019;13(10):11538–11551.
- Terauchi M, Yamamoto H, Tanaka M. Development of a sub-eV resolution soft-X-ray spectrometer for a transmission electron microscope. J Electron Microsc. 2001;50(2):101–104.
- Terauchi M, Koike M, Fukushima K, et al. Development of wavelength-dispersive soft X-ray emission spectrometers for transmission electron microscopes–an introduction of valence electron spectroscopy for transmission electron microscopy. J Electron Microsc (Tokyo). 2010;59(4):251–261.
- Terauchi M, Morito H, Yamane H, et al. Soft X-ray emission spectroscopy study of electronic structure of sodium borosilicide Na8B74.5Si17.5. Microscopy. 2018 Mar 1;67(suppl_1):i72–i77.
- Terauchi M, Koshiya S, Satoh F, et al. Chemical state information of bulk specimens obtained by SEM-based soft-X-ray emission spectrometry. Microsc Microanal. 2014 Jun;20(3):692–697.
- Terauchi M, Kawana M. Soft-X-ray emission spectroscopy based on TEM-toward a total electronic structure analysis. Ultramicroscopy. 2006 Oct-Nov;106(11-12):1069–1075.
- Sato Y, Saito T, Tsuchiya K, et al. Electron energy-loss and soft X-ray emission spectroscopy of electronic structure of MgB4. J Solid State Chem. 2017;253:58–62.
- Egerton RF. Electron energy-loss spectroscopy in the TEM. Rep Prog Phys. 2009;72(1).
- Yu L, Li M, Wen J, et al. (S)TEM-EELS as an advanced characterization technique for lithium-ion batteries. Mater Chem Frontier. 2021;5(14):5186–5193.
- Terauchi M, Takahashi H, Handa N, et al. Ultrasoft-X-ray emission spectroscopy using a newly designed wavelength-dispersive spectrometer attached to a transmission electron microscope. J Electron Microsc. 2011;61(1):1–8.
- Terauchi M, Kawana M. Development of a high energy-resolution soft-X-ray spectrometer for A transmission electron microscope. Microsc Microanal. 2002;8(S02):644–645.
- Terauchi M, Koike M. A New high energy-resolution soft-X-ray spectrometer for A transmission electron microscope. Microsc Microanal. 2003;9(S02):894–895.
- Cui Y. Silicon anodes. Nature Energy. 2021;6(10):995–996.
- Johnson NM, Yang Z, Kim M, et al. Enabling silicon anodes with novel isosorbide-based electrolytes. ACS Energy Letters. 2022;7(2):897–905.
- Stephan AK. Perfect combination: solid-state electrolytes and silicon anodes? Joule. 2021;5(12):3074–3075.
- Chen X, Li H, Yan Z, et al. Structure design and mechanism analysis of silicon anode for lithium-ion batteries. Sci China Mater. 2019;62(11):1515–1536.
- Zhang L, Al-Mamun M, Wang L, et al. The typical structural evolution of silicon anode. Cell Rep Phys Sci. 2022;3(4):100811.
- Ai W, Kirkaldy N, Jiang Y, et al. A composite electrode model for lithium-ion batteries with silicon/graphite negative electrodes. J Power Sources. 2022;527:231142.
- Jiang Y, Offer G, Jiang J, et al. Voltage hysteresis model for silicon electrodes for lithium Ion batteries, including multi-step phase transformations, crystallization and amorphization. J Electrochem Soc. 2020;167(13):130533.
- Jeong YK, Choi JW. Mussel-inspired self-healing metallopolymers for silicon nanoparticle anodes. ACS Nano. 2019;13(7):8364–8373.
- Choi YS, Pharr M, Kang CS, et al. Microstructural evolution induced by micro-cracking during fast lithiation of single-crystalline silicon. J Power Sources. 2014;265:160–165.
- Pereira-Nabais C, Światowska J, Chagnes A, et al. Interphase chemistry of Si electrodes used as anodes in Li-ion batteries. Appl Surf Sci. 2013;266:5–16.
- Aoki N, Omachi A, Uosaki K, et al. Structural study of electrochemically lithiated Si(111) by using soft X-ray emission spectroscopy combined with scanning electron microscopy and through X-ray diffraction measurements. Chem Electro Chem. 2016;3(6):959–965.
- An Z, Kamezawa C, Hirai M, et al. Valence band density of states of Cu3Si studied by soft X-Ray emission spectroscopy and a first-principle molecular orbital calculation. J Phys Soc Jpn. 2002;71(12):2948–2952.
- Aoki M, Omachi A, Smaran KS, et al. Electrochemical lithiation and delithiation of Si(100) single-crystal surface. Chem Lett. 2020;49(1):91–94.
- Jung SC, Han Y-K. Facet-dependent lithium intercalation into Si crystals: Si(100) vs. Si(111). Phys Chem Chem Phys. 2011 Dec 28;13(48):21282–212827.
- Huang C, Feng Z, Pei F, et al. Understanding protection mechanisms of graphene-encapsulated silicon anodes with operando Raman spectroscopy. ACS Appl Mater Interfaces. 2020;12(31):35532–35541.
- Tardif S, Pavlenko E, Quazuguel L, et al. Operando Raman spectroscopy and synchrotron X-ray diffraction of lithiation/delithiation in silicon nanoparticle anodes. ACS Nano. 2017;11(11):11306–11316.
- Li B, Yu D, Zhang S. Raman spectral study of silicon nanowires. Phys Rev B. 1999;59(3):1645–1648.
- Yamaguchi K, Domi Y, Usui H, et al. Elucidation of the reaction behavior of silicon negative electrodes in a bis(fluorosulfonyl)amide-based ionic liquid electrolyte. ChemElectroChem. 2017;4(12):3257–3263.
- Zhang J, Zhou X, Tang J, et al. Phosphoric acid induced homogeneous crosslinked phosphorus doped porous Si nanoparticles with superior lithium storage performance. Appl Surf Sci. 2020;509.
- Domi Y, Usui H, Yamaguchi K, et al. Silicon-based anodes with long cycle life for lithium-ion batteries achieved by significant suppression of their volume expansion in ionic-liquid electrolyte. ACS Appl Mater Interfaces. 2019 Jan 23;11(3):2950–2960.
- Domi Y, Usui H, Ando A, et al. Analysis of the Li distribution in Si-based negative electrodes for lithium-ion batteries by soft X-ray emission spectroscopy. ACS Appl Energy Mater. 2020;3(9):8619–8626.
- Domi Y, Usui H, Leuji N, et al. Lithiation/delithiation properties of lithium silicide electrodes in ionic-liquid electrolytes. ACS Appl Mater Interfaces. 2021 Jan 27;13(3):3816–3824.
- Lyalin A, Kuznetsov VG, Nakayama A, et al. Lithiation products of a silicon anode based on soft X-ray emission spectroscopy: A theoretical study. J Phys Chem C. 2018;122(20):11096–11108.
- Feng Y, Song K, Zhang W, et al. Efficient ORR catalysts for zinc-air battery: biomass-derived ultra-stable Co nanoparticles wrapped with graphitic layers via optimizing electron transfer. J Energy Chem. 2022;70:211–218.
- Song K, Feng Y, Zhou X, et al. Exploiting the trade-offs of electron transfer in MOF-derived single Zn/Co atomic couples for performance-enhanced zinc-air battery. Appl Catal, B. 2022;316:121591.
- Liu Y, Zhang X, Zhang W, et al. MXene-based quantum dots optimize hydrogen production via spontaneous evolution of Cl- to O-terminated surface groups. Energy Environ Mater. 2022. DOI:10.1002/eem2.12438.
- Qin T, Zhang W, Ma Y, et al. Mechanistic insights into the electrochemical Li/Na/K-ion storage for aqueous bismuth anode. Energy Stor Mater. 2022;45:33–39.
- Yang H, Qin T, Zhou X, et al. Boosting the kinetics of PF6− into graphitic layers for the optimal cathode of dual-ion batteries: the rehearsal of pre-intercalating Li+. J Energy Chem. 2022;71:392–399.
- Zou X, Zhang W, Zhou X, et al. The surface of metal boride tinted by oxygen evolution reaction for enhanced water electrolysis. J Energy Chem. 2022;72:509–515.
- Koshiya S, Terauchi M, Takagiwa Y, et al. Chemical shifts of metallic and non-metallic Al–Re–Si approximant crystals studied by EELS and SXES. Philos Mag. 2014;94(15):1711–1718.
- Koshiya S, Terauchi M, Tsai AP. Characteristic chemical shift of quasicrystalline alloy Al53Si27Mn20 studied by EELS and SXES. Philos Mag. 2011;91(18):2309–2316.
- Koshiya S, Terauchi M, Ohhashi S, et al. Characteristic chemical shifts of quasicrystalline Zn–Mg–Zr alloys studied by EELS and SXES. Philos Mag. 2013;93(18):2250–2258.
- Tanaka K, Takatsuka S, Nishiyama H, et al. Analyses for oxygen vacancies in (Na,K)NbO3-series piezoelectric ceramics by soft x-ray emission spectroscopy. AIP Adv. 2019;9(4):045102.
- Ishii S, Terauchi M, Sato Y, et al. Soft X-ray emission spectroscopy study of characteristic bonding states and its distribution of amorphous carbon-nitride (a-CNx) films. Microscopy (Oxf). 2018;67(4):244–249.
- Hirai M, Okazaki H, Yoshida R, et al. Study of electronic states for V thin films deposited on 6H-SiC substrates by soft X-ray emission spectroscopy. Appl Surf Sci. 2009;256(4):948–949.
- Mihara I, An ZL, Kinoshita A, et al. Characterization of the buried interface in a Ni (film)/3C-SiC (substrate) system using SXES. Appl Surf Sci. 2000;159-160:197–200.
- Hirai M, Wakita T, Okazaki H, et al. Study of electronic structures for Fe thin films deposited on Si- and C-faces of 4H–SiC substrates by soft X-ray emission spectroscopy. Appl Surf Sci. 2007;254(1):26–28.
- Schroder K, Alvarado J, Yersak TA, et al. The effect of fluoroethylene carbonate as an additive on the solid electrolyte interphase on silicon lithium-Ion electrodes. Chem Mater. 2015;27(16):5531–5542.