
 ?Mathematical formulae have been encoded as MathML and are displayed in this HTML version using MathJax in order to improve their display. Uncheck the box to turn MathJax off. This feature requires Javascript. Click on a formula to zoom.
ABSTRACT
The temperature dependence of the critical stress of R→B19’ transformation in NiTi shape memory alloys remains unclear due to the difficulties in precisely identifying the phase constitution and acquiring sole R phase. Here we investigate the thermally- and stress-induced martensitic transformation in a near-equiatomic nanocrystalline NiTi alloy. In situ synchrotron X-ray diffraction is used to identify the phase evolution such that the temperature window for sole R phase is firmly determined. We find that the temperature dependence of R→B19’ is negative (−0.2 MPa/K) in our alloy, in sharp contrast to 3–5 MPa/K reported. Possible reasons for the discrepancies are discussed.
GRAPHICAL ABSTRACT

IMPACT STATEMENT
Negative temperature-dependence of stress-induced R→B19’ transformation was discovered for the first time in NiTi alloys, being in sharp contrast to previous reports. This calls for a revisit of such transformation.
1. Introduction
The temperature dependence of critical stress (dσ/dT) is essential for the understanding of martensitic transformation physics, because it contains thermodynamic and crystallographic terms as described by the Clausius-Claperyon equation dσ/dT = –ΔS/ϵVm, where ΔS is entropy difference between the parent and martensite phase, ϵ is transformation strain and Vm is molar volume [Citation1–3]. The parameters on the right are typically constant once the structures of the parent and martensite phase are known [Citation1–3]. For NiTi SMAs that undergo R→B19′ stress-induced martensitic transformation (SIMT), dσ/dT(R→B19’) is typically 3–5 MPa/K [Citation4–8]. It appears that the values of dσ/dT(R→B19′) have been well-recognized (very excellent repeatability) and the underlying physics has been well-understood [Citation4–17]. However, it was argued that the specimens used were probably consisted of both R and B2 phase [Citation12,Citation16]. In this regard, dσ/dT measured was associated with both R→B19′ and B2→B19′ (6–8 MPa/K) SIMT, instead of R→B19′ SIMT by itself [Citation12,Citation16]. If so, the true value of dσ/dT(R→B19′) remains unclear and the current understandings on the SIMT physics of NiTi may be incomplete.
To obtain the true value of dσ/dT(R→B19′), the phase constitution of the specimen must be firmly identified in the first place. This requires a precise determination of the finishing temperature of B2→R transformation (i.e. Rf), below which single R phase is present. So far Rf has been mostly determined by calorimetric, electrical or lab source X-ray diffraction (XRD) measurements [Citation12,Citation16–29]. Nevertheless, the setbacks of these methods have been suggested [Citation12,Citation16]. For instance, it has been shown that an ongoing R transformation occurs gradually below Rf determined by differential calorimetric scanning (DSC) [Citation12,Citation16–21,Citation29]. Such an ongoing transformation is usually (and reasonably to some extent) ignored because the heat flow during this stage (i.e. the long ‘tail’ towards lower temperatures in the DSC curve) does not change significantly with temperature as it does within the DSC peak [Citation12,Citation16–21,Citation29]. For similar reasons, the electrical method is limited by not being able to differentiate the resistance variation of R lattice distortion from that of B2→R transformation [Citation22–24]. Lab source XRD is more reliable by comparison since it measures Rf by examining crystal structures, but the problem remains because the major XRD peaks of B2 and R phase (e.g. B2 (110) and R (300) or R (112)) are too close to distinguish when the latter is dominant in volume fraction [Citation25–28]. For these reasons, the measurement of Rf and dσ/dT(R→B19′) in NiTi remains an issue.
Here we investigate dσ/dT(R→B19′) of a near-equiatomic nanocrystalline (NC) NiTi alloy. NC NiTi possesses R phase over a wide temperature range due to the constraining effect of grain boundaries [Citation30–32]. It is thereby convenient to perform tensile experiments at various temperatures with reasonably large temperature increment so as to minimize errors of dσ/dT(R→B19′) measurement. In situ synchrotron high energy XRD (HE-XRD) is used to examine the phase evolution during cooling while differential scanning calorimeter (DSC) is used for comparison. Tensile tests at various temperatures are employed to obtain stress–strain curves and the phase change during tension is probed by in situ HE-XRD. dσ/dT(R→B19′) is measured and compared with counterparts from the literature. Possible reasons for the discrepancies are discussed and open questions are finally raised.
2. Materials and methods
A commercial Ni50.2Ti49.8 alloy wire of 0.62 mm in diameter was annealed at 1023 K for 0.6 ks before subjected to cold drawing to a diameter of 0.30 mm at room temperature without intermediate annealing. The cross-sectional area reduction is 76%. The as-drawn wire, which was consisted of an amorphous phase [Citation33–36], was later annealed at 623 K to fully crystallize to obtain the specimens used in this study. An FEI Tecnai F20 transmission electron microscope (TEM) was used to characterize the microstructure. TEM specimens were mechanically ground and polished before ion-milled by a Gatan 691 system. Tensile tests were performed at a strain rate of 0.001 s−1 using a WDT II-20 Instron-type tensile machine equipped with a clip-on strain extensometer. The gauge length of tensile specimens was 50 mm. Tensile testing temperature ranges from 373 to 77 K. Isobaric heating tests were carried out using the same tensile machine in load-control mode. The specimens were firstly held at 300, 350, 400 and 500 MPa of applied stresses at 340 K and subsequent cooled from 340 to 110 K.
Thermally induced transformation behavior was examined by in situ HE-XRD and a Q20 differential scanning calorimeter (DSC) at a cooling/heating rate of 5 K/min. SIMT behavior was investigated by in situ HE-XRD during tensile tests. HE-XRD experiments were conducted at Advanced Photon Source in Argonne National Laboratory, USA. X-ray beam had an energy of 105.7 KeV, a wavelength of 0.01173 nm and a size of 0.5 × 0.5 mm. HE-XRD spectrums were obtained by integrating over 360° azimuthal angle of the 2D patterns using the FIT2D package [Citation35,Citation37].
3. Results and discussion
Figure presents the longitudinal microstructure and thermally-induced transformation behavior. The bright-field TEM image in Figure (a) shows equiaxed nanosized grains. The average size is ∼15 nm as shown in Figure (b). An SAD pattern and a dark-field TEM image are shown in Figure S1. The specimen is consisted of B2 and R phase at room temperature, as confirmed by the corresponding SAD pattern and two-dimensional HE-XRD pattern (Figure S1). DSC results in Figure (c) reveal the occurrence of B2→R and R→B2 transformation. The peak temperatures were 316 K (Rp) and 323 K (Ap), where p for peak and A for Austenite. The thermal hysteresis is about 7 K, which is typical for R transformation [Citation35,Citation38,Citation39]. By using the intersecting tangent lines [Citation35,Citation38,Citation39], the starting (Rs) and finishing (Rf) temperatures of B2→R transformation were determined to be 326 and 302 K, and those of R→B2 (As, Af) were 309 and 333 K.
Figure 1. Microstructure and thermally-induced transformation behavior. (a) Bright-field TEM image showing nanosized equiaxed grains. (b) Grain size statistics showing the average grain size of ∼15 nm. (c) DSC curves during cooling and heating showing B2→R and R→B2 transformation. See Figure S1 in supplementary for more microstructural analyses.
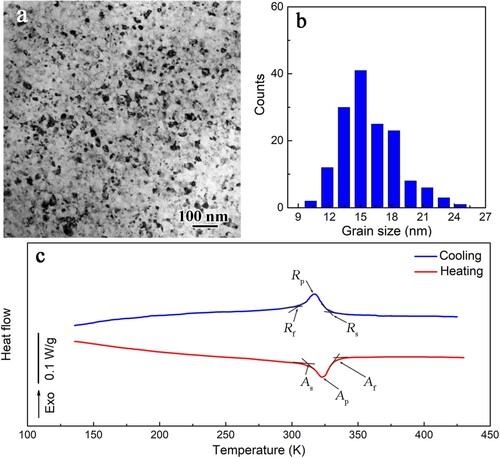
Figure (a) displays in situ HE-XRD spectrums from 420 K to 90 K. Inset figures are magnifications of the dashed boxes. B2 phase was the sole staring phase at 420 K as indicated by the presence of B2 peaks (inset a1-a2) and the absence of R peaks (inset a3-a4). With decreasing temperature, B2→R occurred as indicated by the emergence of R (300), R (112), R (210), R (10) and R (10
) peaks. Rs was determined to be 320 K at which R (210), R (10
) and in particular R (10
) peaks emerged (green thick lines in inset a3-a4). For lab source XRD, these R peaks are usually too weak to resolve adequately. In practice, Rs was often considered as the temperature at which B2 (110) peak split into the R (300) and R (112) peaks [Citation25–27]. Nevertheless, it has been suggested that B2→R transformation already occurs when B2 (110) peak broadens such that the splitting of B2 (110) does not necessarily indicate the right Rs [Citation28,Citation40,Citation41]. This is confirmed by the present study. As shown by the inset a3, the B2 (110) peak split at roughly 190 K, which is way lower than Rs (green thick line).
Figure 2. Microstructural evolution during cooling by in situ HE-XRD. (a) XRD spectrums from 420 to 90 K. Insets show magnified dashed boxes. The green and black thick lines refer to Rs and Rf, respectively. (b) Variation in volume fraction of B2 and R during cooling. Roman numbers (I–III) indicate the temperature regimes of different phase constitution.
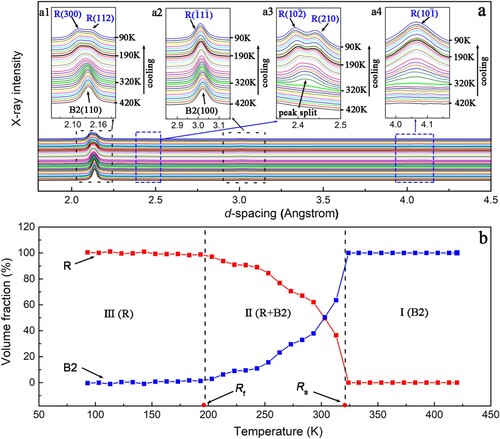
We next show how Rf was measured. By calculating the peak area of R (10) (inset a4), the volume fraction of R as a function of temperature was plotted in Figure (b) (red dots) and the balance was the volume fraction of B2 (blue dots). Above 320 K (Rs), the volume fraction of R remained zero and the specimen was consisted of sole B2. Below 320 K, the volume fraction of R started to increase continuously down to 190 K (black thick lines in insets). Afterwards, the volume fraction of R became nearly unchanged. Therefore, 190 K was determined to be Rf. So, Figure (b) can be divided into three regions. Region I (above 320 K) indicates single B2, Region II (190–320 K) indicates mixture of B2 and R, and Region III (below 190 K) indicates single R. Of special note is that B2→R transformation occurred within a 130 K-wide (190–320 K) temperature window (Figure (b)), which is nearly five times of that (24 K-wide, 302–326 K) measured by DSC in Figure (c). This again indicates the uncertainties of using DSC to exploit the R transformation and to identify the phase constitution [Citation12,Citation16].
Figure (a) shows the stress–strain curves from 373 to 77 K. The three regions labeled are the same with those in Figure (b). The stress plateaus in Region I correspond to B2→B19’ SIMT [Citation34]. In Region II and III, two stress plateaus were observed, i.e. a lower plateau (point A to B) and a higher plateau (point C to E). A magnified view is shown in Figure (b). To exploit the deformation mechanisms of the two plateaus, in situ tensile tests were performed under HE-XRD at 153 K. We found that elastic deformation of R phase occurred from point O to A as evidenced by continuous rightwards shift of R (300) and R (112) peaks (Figure (c)). From point A to B, the two peaks gradually merged into one (blue thick line). The peak intensity evolution is shown in Figure S2. This indicates the reorientation (detwinning) of the self-accommodated (twinned) R phase, being consistent with the literature [Citation12,Citation25,Citation27,Citation35,Citation42]. Lüders-like R→B19’ SIMT occurred between C and E, as indicated by the abrupt presence of B19’ peaks (red thick line) [Citation34,Citation37,Citation43]. Combining these analyses, the deformation mechanisms in Region II can be inferred, that is, detwinning of R occurred at lower plateau and B2 + R→B19’ occurred at higher one. The evidence for the coexistence of B2 and R and their concurrent transformation to B19’ is shown in Figure S3.
Figure 3. SIMT behavior. (a) Stress–strain curves from 373 to 77 K. (b) Stress–strain curve at 153 K. (c) In situ HE-XRD spectrums during tensile test at 153 K. Blue thick line indicates the end of R detwinning and red thick line indicates the start of B2→B19’. (d) Critical SIMT stresses as a function of temperature. Inset is magnification of dashed box.
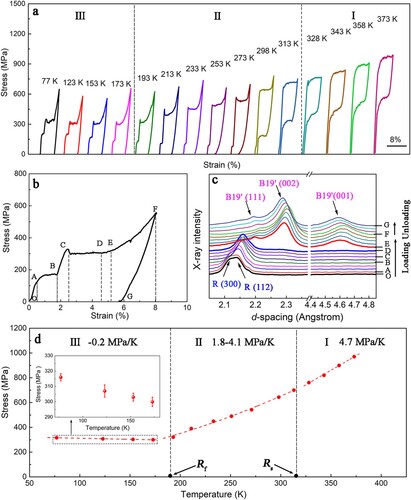
Figure (d) shows the temperature dependence of critical SIMT stresses. The critical stresses were obtained by averaging the stress plateaus (errors of ±10 MPa shown in the inset). dσ/dT(B2→B19′) was 4.7 MPa/K (Region I), which has been previously reported [Citation34]. These measured stress and temperature values were cross-validated by the isobaric heating tests, as shown in Figures S4–5. Combining these results, two interesting trends were discovered. The first is that dσ/dT(B2 + R→B19′) was non-linear, ranging from 4.1–1.8 MPa/K (Region II). Note that the limit values were obtained by performing the first derivation on the non-linear fit (dash line). The second is that dσ/dT(R→B19′) was surprisingly −0.2 MPa/K (Region III). Figure compares our results with those from the literature (Table S1) [Citation4–17]. Note that all data were based on claimed R→B19′ transformation. We found that dσ/dT(R→B19′) from literature are 3–5 MPa/K, showing very impressive consistency. It is however surprising to find that dσ/dT(B2 + R→B19′) of the present study resides within this range. Furthermore, the dσ/dT(R→B19′) value of the present study (−0.2 MPa/K) differs significantly from those of the previously claimed R→B19′ transformation (Table S1) and other transformation paths (Tables S2 and S3). Especially, the negative sign has not been reported before.
Figure 4. Comparison of dσ/dT. Solid dots refer to our results and hollow dots refer to claimed R→B19’ SIMT in the literature [Citation4–17]. Arrows indicate dσ/dT with apparent non-linearity.
![Figure 4. Comparison of dσ/dT. Solid dots refer to our results and hollow dots refer to claimed R→B19’ SIMT in the literature [Citation4–17]. Arrows indicate dσ/dT with apparent non-linearity.](/cms/asset/b8983697-aacc-4090-949b-54cd545bb267/tmrl_a_2141587_f0004_oc.jpg)
In what follows, we attempt to explore the possible mechanisms accounted for the abnormal dσ/dT(R→B19′) of NC NiTi. We first revisit the Clausius-Claperyon relation for R→B19′ SIMT, i.e. dσ/dT(R→B19′) = -ΔSR→B19′ /ϵR→B19′Vm. It has been suggested that the reduction of dσ/dT(R→B19′) with decreasing temperature is related to the decrease of ΔSR→B19′ due to lattice distortion of R phase [Citation16]. We thereby next examine the R lattice distortion in our specimens. As shown in Figure (a) and Figure S6, the rhombohedral distortion angle of R lattice decreases with deceasing temperature. This leads to an increase of R detwinning strain with decreasing temperature (Figure S7), being consistent with previous reports [Citation27,Citation35,Citation44]. By comparing with the literature [Citation25,Citation44–47], we find that the rhombohedral angle of R lattice of our specimen is significantly smaller. This implies that the magnitude of R lattice distortion of our specimen is more intensive towards B19’ lattice, leading to possibly reduced ΔSR→B19′ [Citation25,Citation44–47]. Such a mechanism, although is likely accountable, has two shortcomings. First, it does not necessarily result in lowered dσ/dT(R→B19′). While ΔSR→B19′ is reduced, ϵR→B19′ in the Clausius-Claperyon relation could also be reduced due to lattice distortion. In this regard, the changing trend of dσ/dT(R→B19′) cannot be justified without knowing whether ΔSR→B19′ or ϵR→B19′ changes more dramatically. Atomistic simulations may be needed to clarify this. Second, even if the reduction of ΔSR→B19′ outweighs that of ϵR→B19′, it is unknown if the distortion will eventually lead to negative ΔSR→B19′. It thereby cannot explain the negative sign of dσ/dT(R→B19′).
Figure 5. (a) Comparison of the distortion angle of the R phase during cooling between our NC NiTi and other NiTi-based SMAs [Citation25,Citation44–47]. (b) Critical stress of R detwinning as a function of temperature. Red dots were obtained from the lower plateaus in the stress–strain curves in Figure (a). All other data points were from the literature [Citation4,Citation6,Citation8,Citation10,Citation12,Citation15,Citation53,Citation54].
![Figure 5. (a) Comparison of the distortion angle of the R phase during cooling between our NC NiTi and other NiTi-based SMAs [Citation25,Citation44–47]. (b) Critical stress of R detwinning as a function of temperature. Red dots were obtained from the lower plateaus in the stress–strain curves in Figure 4(a). All other data points were from the literature [Citation4,Citation6,Citation8,Citation10,Citation12,Citation15,Citation53,Citation54].](/cms/asset/626dce96-0acd-42b5-afdd-a6b9852c44c2/tmrl_a_2141587_f0005_oc.jpg)
It could be argued that ideally the stress term in the Clausius-Claperyon relation should be the equilibrium stress (σ0) instead of the upper or lower plateau stress. Indeed, σ0 can be calculated by averaging the upper and lower plateau stress, which is a prevailing convention. However, such a strategy could be tricky. In many cases, there is no spontaneous backward transformation such that a lower plateau does not exist [Citation5,Citation8–12,Citation14,Citation15]. This is the case in the present study as shown in Region III. Even for the cases with both of the stress plateaus being present, upper plateau stresses are widely used for calculating dσ/dT and we did not find an exclusion for dσ/dT(R→B19′) in literature to date [Citation4,Citation7]. Furthermore, recent studies have shown that the equilibrium stress may not reside right in between of the upper or lower plateau [Citation48]. So, the Clausius-Claperyon relation may not be suitable for analysis in the present study.
It has been recently suggested that the SIMT of doped NiTi alloys is a thermally activated process [Citation49–51]. For instance, negative dσ/dT(B2→B19′) and rate-dependent critical stresses have been convincingly shown in superelastic Ni-rich NiTi and are attributed to kinetic arresting of SIMT [Citation49–51]. While the equilibrium dσ/dT was claimed to remain following the Clausius-Claperyon relation, the upper and lower stresses are strongly affected by the reduced thermal activation at low temperatures [Citation49–51]. Such an effect comes into play possibly via affecting the lattice friction of phase interface migration [Citation52]. We are not able to directly characterize the lattice friction of R→B19′ SIMT, but we noticed in Figure (b) that the detwinning stress of our specimens increases more drastically with decreasing temperature in comparison with that of other NiTi-based SMAs [Citation4,Citation6,Citation8,Citation10,Citation12,Citation15,Citation53,Citation54]. Given that the previous reports have successfully used a dislocation-based model to describe the thermally activated SIMT process [Citation49–51,Citation55], the similar dependence on temperature between detwinning (a dislocation facilitated process) and SIMT can be possibly established. Therefore, the temperature-dependence of R detwinning stress implies that the thermal activation for R→B19′ SIMT is likely reduced in the same manner. As a possible result, the lattice friction of phase interface migration is particularly strong at cryogenic temperatures, leading to the negative dσ/dT(R→B19′).
From another perspective, it has been suggested that the critical conditions of SIMT are associated with not only the thermodynamic criterion of phase stability but also the detwinning process [Citation13,Citation56]. Even if R→B19’ SIMT is thermodynamically ready, the actual initiation of transformation calls for the change of internal microstructure to a favorable state with respect to the stress field (i.e. detwinning). As such, SIMT will occur only after this second criterion is met. In this regard, the negative dσ/dT in Region III is probably related to the detwinning of B19’ martensite, the stress of which has been well-known to increase with decreasing temperature [Citation9,Citation57]. We thereby suggest that the continuous increase in the detwinning stress with decreasing temperature may contribute to the negative dσ/dT (R→B19’) in Region III.
One last issue to be noted is the surprising consistency between dσ/dT(B2 + R→B19′) of our specimen and dσ/dT(R→B19′) of other NiTi alloys (Figure ). We suggest that the consistency is not a coincidence. There is a possibility that the 3–5 MPa/K of dσ/dT(R→B19′) in literature is a combined value of dσ/dT(B2→B19′) and dσ/dT(R→B19′) (Figure (d)). Provided that the phase identification (Rf) in literature was mostly carried out by DSC which is not quite reliable, the tested specimens were likely consisted of both B2 and R phase. Another possible argument is that many of the reported σ-T relationships are non-linear [Citation6,Citation8,Citation12], as indicated by the arrows in Figure . These trends are similar to our results (blue line in Figure ), all owing to the increasing volume of R during cooling. But it must be noted that the grain size of our specimens is ∼15 nm, being way smaller than the micron-level grain sizes reported [Citation4–17]. So an ideal comparison should be made by using coarse-grained NiTi-based alloys with single R phase. In particular, the alloys better remain sole R phase over a wide temperature range to allow reasonable temperature increment for tensile tests. This requires a strong suppression of thermally-induced R→B19’ and/or B2→B19’. Otherwise, B19’ forms before thermally-induced B2→R completely finishes, which is probably why most previous studies cannot obtain useful data below 200 K (Figure ). Furthermore, the suppression should not be too strong, otherwise B2→R may be completely suppressed and R-like (average structure remains B2) instead of R forms during cooling [Citation24,Citation50,Citation58–62]. The achievement of such coarse-grained alloys may require new alloy design strategy because the current methods such as alloying [Citation10,Citation63,Citation64], aging [Citation65–67] and pre-deformation [Citation68–70] can hardly meet the requirements.
4. Conclusions
We have exploited the thermally- and stress-induced transformation behavior of a near-equiatomic NC NiTi alloy, particularly focusing on dσ/dT(R→B19′). Thermally-induced B2→R transformation occurred within a 130 K-wide temperature window (190–320 K), as revealed by HE-XRD. Such a window is five times wider than that (302–326 K) measured by DSC. dσ/dT(R→B19′) of our NC NiTi was −0.2 MPa/K, being in sharp contrast to the 3–5 MPa/K reported before. The discrepancy is likely attributed to the reduced thermal activation or enhanced detwinning stresses at cryogenic temperatures.
Supplemental Material
Download MS Word (13 MB)Acknowledgements
The use of the Advanced Photon Source was supported by the US Department of Energy, Office of Science, and Office of Basic Energy Science under Contract no. DE-AC02-06CH11357. We acknowledge Zhonghan Li for helpful discussions.
Disclosure statement
No potential conflict of interest was reported by the author(s).
Additional information
Funding
References
- Wollants P, Roos J, Delaey L. Thermally- and stress-induced thermoelastic martensitic transformations in the reference frame of equilibrium thermodynamics. Prog. Mater. Sci. 1993;37:227–288.
- Liu Y, Galvin S. Criteria for pseudoelasticity in near-equiatomic NiTi shape memory alloys. Acta Metall. 1997;45:4431–4439.
- Wollants P, Bonte M, Roos J. Thermodynamic analysis of the stress-induced martensitic-transformation in a single-crystal. Zeitschrift fur Metall. 1979;70:113–117.
- Timofeeva EE, Surikov NY, Tagiltsev AI, et al. The orientation dependence of thermal and stress hysteresis at R–B19′ martensitic transformation in aged Ni50.6Ti49.4 single crystals. J Alloys Compd. 2020;817:152719.
- Stachowiak GB, McCormick PG. Shape memory behaviour associated with the R and martensitic transformations in a NiTi alloy. Acta Metall. 1988;36:291–297.
- Churchill CB, Shaw JA, Iadicola MA. Tips and tricks for characterizing shape memory alloy wire: part 2-fundamental isothermal responses. Exp Techniques. 2009;33:51–62.
- Wang X, Kustov S, Li K, et al. Effect of nanoprecipitates on the transformation behavior and functional properties of a Ti–50.8 at.% Ni alloy with micron-sized grains. Acta Mater. 2015;82:224–233.
- Miyazaki S, Otsuka K. Deformation and transition behavior associated with the R-phase in Ti-Ni alloys. Metall Trans. A. 1986;17:53–63.
- Miyazaki S, Ohmi Y, Otsuka K, et al. Characteristics of deformation and transformation pseudoelasticity in NiTi alloys. J Phys Colloq. 1982;43:255–260.
- Miyazaki S, Otsuka K. Mechanical behaviour associated with the premartensitic rhombohedral-phase transition in a Ti50Ni47Fe3alloy. Philos Mag A. 1984;50:393–408.
- Ng K, Sun Q. Stress-induced phase transformation and detwinning in NiTi polycrystalline shape memory alloy tubes. Mech Mater. 2006;38:41–56.
- Olbricht J, Yawny A, Pelegrina J, et al. On the stress-induced formation of R-phase in ultra-fine-grained Ni-rich NiTi shape memory alloys. Metall Mater Trans A. 2011;42:2556–2574.
- Sedlák P, Frost M, Benešová B, et al. Thermomechanical model for NiTi-based shape memory alloys including R-phase and material anisotropy under multi-axial loadings. Int J Plast. 2012;39:132–151.
- Helbert G, Saint-Sulpice L, Arbab Chirani S, et al. Experimental characterisation of three-phase NiTi wires under tension. Mech Mater. 2014;79:85–101.
- Xiao Y, Zeng P, Lei L. Experimental observations on mechanical response of three-phase NiTi shape memory alloy under uniaxial tension. Mater Res Express. 2016;3:105701.
- Duerig TW, Pelton AR, Bhattacharya K. The measurement and interpretation of transformation temperatures in nitinol. Shap Mem Superelasticity. 2017;3:485–498.
- Rigamonti D, Nespoli A, Villa E, et al. Implementation of a constitutive model for different annealed superelastic SMA wires with rhombohedral phase. Mech Mater. 2017;112:88–100.
- Shi X, Ma Z, Zhang J, et al. Grain size effect on the martensitic transformation temperatures of nanocrystalline NiTi alloy. Smart Mater Struct. 2015;24:072001.
- Lin HC, Wu SK. Determination of heat of transformation in a cold-rolled martensitic TiNi alloy. Metall Trans A. 1993;24:293–299.
- Chen H, Xiao F, Liang X, et al. Improvement of the stability of superelasticity and elastocaloric effect of a Ni-rich Ti-Ni alloy by precipitation and grain refinement. Scr Mater. 2019;162:230–234.
- Song Y, Jin M, Han X, et al. Microstructural origin of ultrahigh damping capacity in Ni50.8Ti49.2 alloy containing nanodomains induced by insufficient annealing and low-temperature aging. Acta Mater. 2021;205:116541.
- Miyazaki S, Wayman CM. The R-phase transition and associated shape memory mechanism in Ti-Ni single crystals. Acta Metall. 1998;36:181–192.
- Shindo D, Murakami Y, Ohba T. Understanding precursor phenomena for the R phase transformation in Ti-Ni-based alloys. MRS Bull. 2002;27:121–127.
- Wang D, Zhang Z, Zhang J, et al. Strain glass in Fe-doped Ti–Ni. Acta Mater. 2010;58:6206–6215.
- Šittner P, Landa M, Lukáš P, et al. R-phase transformation phenomena in thermomechanically loaded NiTi polycrystals. Mech Mater. 2006;38:475–492.
- Wang X, Verlinden B, Humbeeck J. R-phase transformation in NiTi alloys. Mater Sci Technol. 2014;30:1517–1529.
- Liang X, Xiao F, Jin M, et al. Elastocaloric effect induced by the rubber-like behavior of nanocrystalline wires of a Ti-50.8Ni (at. %) Alloy. Scr Mater. 2017;134:42–46.
- Salje EK, Zhang H, Planes A, et al. Martensitic transformation B2-R in Ni-Ti-Fe: experimental determination of the landau potential and quantum saturation of the order parameter. J Phys Condens Matter. 2008;20:275216.
- Bonsignore C, Shamini A, Duerig T. The role of parent phase compliance on the fatigue lifetime of Ni–Ti. Shap Mem Superelasticity. 2019;5:407–414.
- Waitz T, Antretter T, Fischer FD, et al. Size effects on martensitic phase transformations in nanocrystalline NiTi shape memory alloys. Mater Sci Technol. 2013;24:934–940.
- Waitz T, Antretter T, Fischer FD, et al. Size effects on the martensitic phase transformation of NiTi nanograins. J Mech Phys Solids. 2007;55:419–444.
- Waitz T, Kazykhanov V, Karnthaler HP. Martensitic phase transformations in nanocrystalline NiTi studied by TEM. Acta Mater. 2004;52:137–147.
- Shi X, Guo F, Zhang J, et al. Grain size effect on stress hysteresis of nanocrystalline NiTi alloys. J Alloys Compd. 2016;688:62–68.
- Wang T, Ma Z, Rao X, et al. Temperature-dependence of superelastic stress in nanocrystalline NiTi with complete transformation capability. Intermetallics. 2020;127:106970.
- Feng B, Kong X, Hao S, et al. In-situ synchrotron high energy X-ray diffraction study of micro-mechanical behaviour of R phase reorientation in nanocrystalline NiTi alloy. Acta Mater. 2020;194:565–576.
- Prokoshkin S, Dubinskiy S, Brailovski V. Features of a nanosubgrained structure in deformed and annealed Ti–Ni SMA: a brief review. Shap Mem Superelasticity. 2019;5:336–345.
- Wang S, Cui L, Hao S, et al. Locality and rapidity of the ultra-large elastic deformation of Nb nanowires in a NiTi phase-transforming matrix. Sci Rep. 2014;4:6753.
- Shi X, Cui L, Jiang D, et al. Grain size effect on the R-phase transformation of nanocrystalline NiTi shape memory alloys. J Mater Sci. 2014;49:4643–4647.
- Liang X, Xiao F, Chen H, et al. Internal friction of the R-phase in single crystalline Ti-50.8Ni (at.%) alloy containing controlled precipitate of Ti3Ni4. Scr Mater. 2019;166:44–47.
- Zhang J, Wang Y, Ding X, et al. Spontaneous strain glass to martensite transition in a Ti50Ni44.5Fe5.5strain glass. Phys. Rev. B. 2011;84:214201.
- Hung C, Roy K. Stress-induced shape changes and shape memory in the R and martensite transformations in equiatomic NiTi. Metall Trans A. 1981;12:2101–2111.
- Nicholson DE, Padula SA, Benafan O, et al. Mapping of texture and phase fractions in heterogeneous stress states during multiaxial loading of biomedical superelastic NiTi. Adv Mater. 2021;33:e2005092.
- Sittner P, Liu Y, Novak V. On the origin of Lüders-like deformation of NiTi shape memory alloys. J Mech Phys Solids. 2005;53:1719–1746.
- Salamon MB, Meichle ME, Wayman CM, et al. Premartensitic phases of Ti50Ni47Fe3. Phys Rev B. 1985;31:7306–7315.
- Sittner P, Lugovoy D, Neov D, et al. In situ neutron diffraction studies of the R-phase transformation in the NiTi shape memory alloy. Appl Phys A Mater Sci Process. 2002;74:1121–1123.
- Rao J, Ma R, He Y. Incommensurate and commensurate phase transitions in Ti-Ni-Fe alloy. Acta Metall Sinica. 1990;3:89–92.
- Goryczka T, Morawiec H. Structure studies of the R-phase using X-ray diffraction methods. J Alloys Compd. 2004;367:137–141.
- Kang G, Zhang H, Ma Z, et al. Large thermal hysteresis in a single-phase NiTiNb shape memory alloy. Scr Mater. 2022;212:114574.
- Niitsu K, Kainuma R. Effect of annealing on stress-induced transformation behaviors at low temperatures in a Ti-51.8 at.% Ni shape memory alloy. Phys Status Solidi B. 2014;251:2041–2047.
- Niitsu K, Omori T, Kainuma R. Stress-induced transformation behaviors at low temperatures in Ti-51.8Ni (at. %) shape memory alloy. Appl Phys Lett. 2013;102:231915.
- Niitsu K, Date H, Kainuma R. Thermal activation of stress-induced martensitic transformation in Ni-rich Ti-Ni alloys. Scr Mater. 2020;186:263–267.
- Pang EL, Olson GB, Schuh CA. The mechanism of thermal transformation hysteresis in ZrO2-CeO2 shape-memory ceramics. Acta Mater. 2021;213:116972.
- Miyazaki S, Kimura S, Otsuka K. Shape-memory effect and pseudoelasticity associated with the R-phase transition in Ti-50·5 at.% Ni single crystals. Philos Mag A. 1988;57:467–478.
- Lexcellent C, Zikowski A, Tanaka K. Thermodynamical model of reversible R-phase transformation in TiNi shape memory alloy. Int. J. Pressure Vessels Piping. 1994;58:51–57.
- Niitsu K, Xu X, Umetsu RY, et al. Stress-induced transformations at low temperatures in a Ni45Co5Mn36In14 metamagnetic shape memory alloy. Appl Phys Lett. 2013;103:242406.
- Frost M, Jury A, Heller L, et al. Experimentally validated constitutive model for NiTi-based shape memory alloys featuring intermediate R-phase transformation: a case study of Ni48Ti49Fe3. Mater. Des. 2021;203:109593.
- Laplanche G, Birk T, Schneider S, et al. Effect of temperature and texture on the reorientation of martensite variants in NiTi shape memory alloys. Acta Mater. 2017;127:143–152.
- Wang Y, Ren X, Otsuka K, et al. Temperature–stress phase diagram of strain glass Ti48.5Ni51.5. Acta Mater. 2008;56:2885–2896.
- Zhang J, Xue D, Cai X, et al. Dislocation induced strain glass in Ti50Ni45Fe5 alloy. Acta Mater. 2016;120:130–137.
- Zhou Y, Xue D, Ding X, et al. Strain glass in doped Ti50(Ni50−xDx) (D = Co, Cr, Mn) alloys: implication for the generality of strain glass in defect-containing ferroelastic systems. Acta Mater. 2010;58:5433–5442.
- Chien C, Tsao C, Wu S, et al. Characteristics of the strain glass transition in as-quenched and 250 C early-aged Ti48.7Ni51.3 shape memory alloy. Acta Mater. 2016;120:159–167.
- Xu S, Pons J, Santamarta R, et al. Strain glass state in Ni-rich Ni-Ti-Zr shape memory alloys. Acta Mater. 2021;218:117232.
- Hwang CM, Meichle M, Salamon MB, et al. Transformation behaviour of a Ti50Ni47Fe3 alloy I. premartensitic phenomena and the incommensurate phase. Philos Mag A. 2006;47:9–30.
- Pushin VG, Kourov NI, Kuranova NN, et al. Structure and phase transformations in TiNiFe ternary alloys subjected to plastic deformation by high-pressure torsion and subsequent heat treatment. Phys Met Metallogr. 2014;115:365–379.
- Wang X, Li C, Verlinden B, et al. Effect of grain size on aging microstructure as reflected in the transformation behavior of a low-temperature aged Ti–50.8at.% Ni alloy. Scr Mater. 2013;69:545–548.
- Wang X, Li K, Schryvers D, et al. R-phase transition and related mechanical properties controlled by low-temperature aging treatment in a Ti–50.8 at.% Ni thin wire. Scr Mater. 2014;72:21–24.
- Jin M, Song Y, Wang X, et al. Ultrahigh damping capacity achieved by modulating R phase in Ti49.2Ni50.8 shape memory alloy wires. Scr Mater. 2020;183:102–106.
- Wang X, Van Humbeeck J, Verlinden B, et al. Thermal cycling induced room temperature aging effect in Ni-rich NiTi shape memory alloy. Scr Mater. 2016;113:206–208.
- Mahmud AS, Wu Z, Yang H, et al. Effect of cold work and partial annealing on thermomechanical behaviour of Ti-50.5 at% Ni. Shap Mem Superelasticity. 2017;3:57–66.
- Wang X, Pu Z, Yang Q, et al. Improved functional stability of a coarse-grained Ti-50.8 at.% Ni shape memory alloy achieved by precipitation on dislocation networks. Scr Mater. 2019;163:57–61.