
ABSTRACT
Highly destructive tsunamis occurred near the Pacific coast of Colombia in 1906 and 1979. Recent studies have established asperities within the subduction zone in this area, which can cause megathrust earthquakes triggering highly destructive tsunamis. In this study we assess the tsunami hazard in the main populated areas of Colombia Pacific coast by calculating the inundation depth and the maximum tsunami height from major scenario. A deterministic method is applied using slip deficit models and broadband slip models as tsunami sources. Result suggest that, for the worse-case scenario, the maximum deformation of the seafloor is 6.0 m within the Esmaraldas segment ; the maximum height of the tsunami is 4.66 m, 4.34 m and 0.53 m around. Tumaco Island, Morro Island, and Cascajal Island (Buenaventura Bay), respectively. Two to five meters inundation depth were calculated in over 11% and 10% of the total areas of the islands of Tumaco and Morro, respectively. Based on these result, tsunami hazard maps were alaborated and will serve to create tsunami mitigation plans in these areas.
1. Introduction
The northern block of the Andes, particularly the seismic strip located off the southern Pacific coast of Colombia and northern Ecuador, is characterized by intense seismological activity (Gutsher et al., Citation1999, Collot et al., Citation2004, Sagiya and Mora- Páez Citation2019). During the 20th century in the years 1906, 1942, 1958, and 1979 this area was affected by four large earthquakes with magnitude Mw > 7.7 The largest occurred on January 31 1906 (Mw > 8.4) (Yoshimoto et al., Citation2017). All these earthquakes generated tsunamis that caused severe damage and loss of life throughout the Pacific coastal region of Colombia and Ecuador. In particular, the 1979 event affected several areas in the Tumaco region. In the department of Nariño alone, there were approximately 452 deaths and 1,011 injuries. In terms of structural damage, approximately 3,080 homes were destroyed and another 2,100 were damaged (Ramírez and Goberna, Citation1980).
Given that the Colombian Pacific coast has been affected by strong earthquakes, which have been precursors of tsunamis, it is important to evaluate extreme scenarios of strong ground motion and tsunami impacts (Quiceno and Ortiz Citation2001; Cardona et al. Citation2005; Restrepo and Otero Citation2007; Sánchez and Puentes Citation2012; Otero, Restrepo, and Gonzalez Citation2014).
Megathrust earthquakes are extremely large inverse-fault earthquakes. These events occur at plate interfaces along subduction zones and generally reach magnitudes of approximately Mw 8.5; they are especially destructive when they exceed Mw 9.0 (Mas et al. Citation2015). In 1906, a large earthquake (considered a megaquake with a magnitude of approximately Mw 8.5) broke the entire interface between the Nazca Plate and the South American Plate. Similarly, in 1979, another strong earthquake (Mw 8.3) occurred in the Colombo-Ecuadorian subduction zone and significantly affected the population of San Juan de la Costa, located in the northern part of Tumaco, Nariño (Dimar-CCCP Citation2013).
Two densely populated and highly vulnerable municipalities are located in the central and southern Pacific region of Colombia. The municipality of Buenaventura located in the department of Valle del Cauca in the center of the Colombian Pacific, with approximately 432,385 inhabitants (DANE Citation2005), is the main seaport of Colombia and is also considered a Special, Industrial, Port, Biodiversity, and Ecotourism District; Buenaventura is one of the 10 most important ports in Latin America because it moves more than 53% of the country’s international trade (La actividad portuaria en Buenaventura Citation2007). The municipality of Tumaco, located in the department of Nariño in the south of the Colombian Pacific, was projected to have 217,079 inhabitants in 2019 (DANE Citation2005) and is also known as a Special, Industrial, Biodiversity and Ecotourism District.
The population density and vulnerability of these municipalities press for the assessment of the tsunami hazard they face, taking into account that potential tsunamis may cause a large number of fatalities and injuries, significant damage to regional infrastructure, and irreparable destruction of the environment, all of which affects the national economy.
Poveda and Pulido (Citation2019) proposed two slip models to represent megathrust using deterministic estimates of seismic risk in Colombia. Based on the two slip models covering the coasts of Ecuador and Colombia, six megathrust scenarios were determined and numerical simulations were carried out, to calculate the run-up and inundation depth produced by tsunamis in the municipalities of Tumaco and Buenaventura.
Herein, a tsunami hazard assessment is conducted based on the application of a deterministic approach (Renou et al. Citation2011) to megathrust events using numerical simulation techniques that establish the hazard level posed by tsunamis to the central and southern coasts of the Colombian Pacific, where the subduction of the Nazca Plate under the South American Plate is responsible for earthquakes of magnitude greater than Mw 8.2.
Several mapping products are proposed, in particular tsunami inundation maps, which support the creation of tsunami mitigation plans for the south and central coasts of the Colombian Pacific.
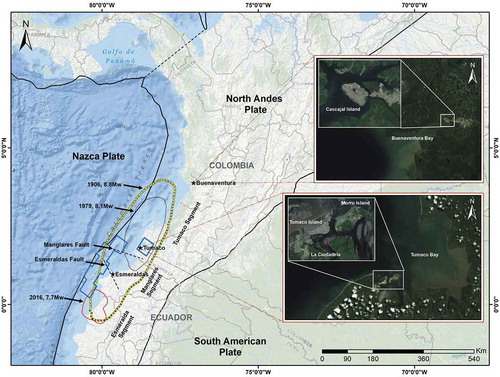
Figure 1. Study area and approximate rupture areas of documented historical tsunami precursor earthquakes
2. Data and materials
2.1. Tsunami source scenarios
Poveda and Pulido (Citation2019) developed a set of finite fault for the Pacific subduction margin in Colombia and Ecuador, applying two types of source models: slip deficit and broadband slip.
The slip deficit model is based on an interplate coupling distribution model developed by Sagiya and Mora- Páez (Citation2019). The importance of interplate coupling analysis is demonstrated by the occurrence of megathrust earthquakes, for example, the 2010 Mw 8.8 earthquake in Maule, Chile, the 2011 Mw 9.0 earthquake in Tohoku-oki, and the 2012 Nicoya earthquake in, Costa Rica; in all these cases the distribution of the cosmic slip was highly correlated with the distribution of the pre-seismic slip deficit (Moreno et al, Citation2010; Nishimura et al. Citation2004; Feng et al. Citation2012; Protti et al. Citation2014; Sagiya and Mora- Páez Citation2019). This coupling model configures a geodetic inversion based on Yabuki and Matsu’ura (Citation1992) and Yoshioka et al. (Citation1993), with minor modifications following Sagiya and Mora- Páez (Citation2019). This inversion depends on the following: the relative plate velocity based on information available in Chlieh et al. (Citation2014); the coupling rate, which is obtained from each GPS station of the Colombian Geological Survey (Geo RED) network of GNSS stations by means of Green’s equations; and the Euler pole for each plate, using the results of the MORVEL (Mid-Ocean Ridge Velocities) model for the Nazca and South American plates as a basis (DeMets, Gordon, and Argus Citation2010) and the model proposed by Mora-Páez et al. (Citation2019) for the northern block of the Andes. As a result, mid to high coupling coefficients (0.5–0.8) are observed in the source regions of the 1942, 1958, and 2016 earthquakes with a lower coupling coefficient (<0.5) in the 1979 source region (Sagiya and Mora- Páez Citation2019; Yoshimoto et al. Citation2019).
The distribution of coupling coefficients supports the interpretation of Yoshimoto et al. (Citation2019), corroborating the hypothesis that the 2016 earthquake broke the 1942 source region whilst the 1979 event did not break the 1906 source region. This allows the generation of models of rupture and periods of megathrust recurrence in individual and separate source segments. Accordingly, Pulido, Yoshimoto, and Sarabia (Citation2020) propose two areas of rupture for the 1906 and 1979 events. Based on the above, Poveda and Pulido (Citation2019) generated two scenarios with the slip deficit model (1906 and 1979). For the 1906 scenario, a magnitude of Mw 8.5 was defined by inverting the tsunami waveforms and intensity data observed during the event. For the 1979 scenario, a magnitude of Mw 8.3 was defined by inverting teleseismic P-wave data to map the slip distribution using Green’s functions (Yoshimoto and Yamanaka Citation2014), with an overlay on the interplate coupling to interpret the rupture modes and recurrence intervals of the event.
Additionally, Poveda and Pulido (Citation2019) propose a “worst-case scenario” as the product of combining the 1906 and 1979 slip deficit scenarios, with a magnitude between Mw 8.8 and 8.9, implying a combined break of the northern segments of Esmeraldas, Manglares, and Tumaco. Although data do not suggest that such an event has occurred in recorded history, this conjecture was made to define the largest possible megathrust along the Colombo-Ecuadorian subduction margin. The scenario proposal is motivated by characteristics of paleo-tsunami deposits sampled in the San Juan River delta near the city of Buenaventura (Colombia) (González and Correa, Citation2001), as well as the paleo-turbidite patterns sampled following a marine drilling exercise in the Esmeraldas Canyon off the coast of Esmeraldas Province (Ecuador) (Migeon et al. Citation2017), which may suggest the occurrence of a very large event along the Ecuador-Colombia subduction margin around 500–600 BP years.
According to Pulido et al. (Citation2015), slip models are appropriate for strong motion simulations and tsunami hazard assessment.
Using a broadband slip model, Poveda and Pulido (Citation2019) propose a set of 24 broadband slip scenarios for each of the three above-mentioned deficit slip scenarios; however, the only broadband model recorded so far in scientific sources is the 1906 scenario, analyzed by Pulido, Yoshimoto, and Sarabia (Citation2020). To fully understand the process of earthquake generation in a broadband frequency range, it is also necessary to study the shorter wavelength slip, which is responsible for the generation of strong motion at high frequency. Pulido, Yoshimoto, and Sarabia (Citation2020) used the slip model of the 1906 earthquake, as well as estimates of the macro-seismic intensity of the earthquake, to develop a broadband wavelength source model appropriate for the generation of strong broadband frequency motions that would serve as a source of tsunami. To build this strong motion model, it was necessary to incorporate short wavelength slip into the long wavelength slip model (Pulido et al. Citation2015).
Therefore, two source models were defined for this study, slip deficit and broadband slip. Three scenarios were determined in each model, thus six scenarios overall.
shows the three slip-deficit model scenarios and shows the three more extreme broadband slip model scenarios based on Poveda and Pulido (Citation2019). The 1906, 1979, and worst-case scenarios consist of 680, 612, 969 sub-faults respectively; each of the sub-faults has an area of 10 × 10 km, a strike of 30º, a dip of 15º, and a rake of 118º, and each event occurs along the Ecuador-Colombia subduction zone.
Figure 2. Slip deficit model scenarios considered in this study (Poveda and Pulido Citation2019): A worst-scenario, B 1906 scenario, and C 1979 scenario
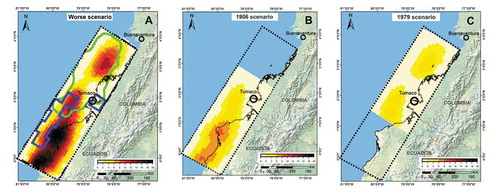
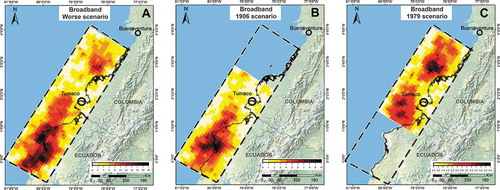
Figure 3. Broadband slip model scenarios considered in this study (Poveda and Pulido Citation2019) A worst-scenario, B 1906 scenario, and C 1979 scenario
shows the parameters of the three slip deficit model scenarios and the three broadband slip model scenarios that were used in the numerical tsunami simulation. Due to the large number of sub-faults per scenario, the parameters shown therein are limited to the sub-faults with the maximum slip value. The complete parameter tables for all scenarios are available as Supplementary Material.
Table 1. Parameters used in the three slip deficit models and three broadband slip models (Poveda and Pulido Citation2019)
2.2. Tsunami hazard assessment and numerical simulation
Maximum tsunami height and inundation depth were selected as variables for assessing the tsunami hazard in Tumaco and Buenaventura. The maximum height defines the extent of inundation, which allows for the calculation of the area of inundation (Sánchez and Puentes Citation2012). The inundation depth allows the differentiation of areas with relatively high or low probability of damage (Renou et al. Citation2011).
A deterministic method was applied (Renou et al. Citation2011; Otero, Restrepo, and Gonzalez Citation2014; Mas et al. Citation2014), taking into account advances in the definition of the source models provided by Poveda and Pulido (Citation2019) as explained in the previous section. The source models used in this study made it possible to define more realistic megathrust scenarios, this allowed to calculate with more precision the tsunami initial conditions. More specifically, high resolution topography and bathymetry information permitted relatively precise calculations of propagation, height of tsunami, areas of inundation, and depth of inundation in the study areas.
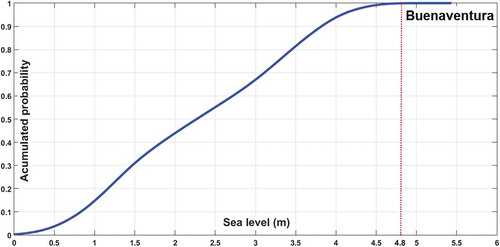
Tsunami propagation was simulated taking into account a tidal scenario through the implementation of a methodology proposed by Vásquez, Iriarte, and Sánchez (Citation2018). The methodology was used to determine average sea level values in Tumaco and Buenaventura based on the separate analysis of astronomical and meteorological tides since no instrumental records exist. From and it can be established that the maximum average sea level value for Tumaco is 3.6 m and for Buenaventura it is approximately 4.8 m. In sites such as the bays of Tumaco and Buenaventura on the Colombian Pacific coast where the tidal range is approximately 4 m, it is important to take into account sea level in tsunami simulations, since sea level is a variable that strongly influences tsunami height and inundation (Sánchez and Puentes Citation2012; Otero, Restrepo, and Gonzalez Citation2014).
Figure 4. Average sea level regime determined for Tumaco
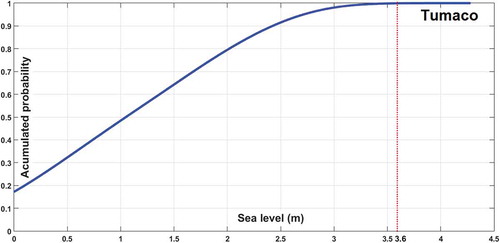
Figure 5. Average sea level regime determined for Buenaventura
The TUNAMI-N2 model (Imamura Citation1996) was used to simulate the generation, propagation, and impact of near-field tsunamis. The study area needs to be represented by integrating topographic and bathymetric information of the land and seafloor, respectively. Therefore, for simulation purposes, five computer grids were used at different nesting levels (). These computer grids serve as input to the model for reproducing a tsunami in the study area and are governed by a system of equations, based on the non-linear theory of shallow water, with the addition of a non-linear term to take into account the roughness in the innermost domain. The outermost computer grid with a cell spacing of 810 m comprises the earthquake generation area. Here, seafloor deformation is calculated using the elastic deformation model proposed by Okada (Citation1992). The result representing the region implies an instantaneous displacement of the sea surface that is identical to the vertical displacement of the seafloor ( and ). Nested grids corresponding to 270 m, 90 m, and 30 m cell spacing are used by the numerical model to represent the propagation of tsunami waves from deep to shallow waters. Finally, the inundation phase is evaluated on the innermost computer grid with a 10 m cell spacing. Grids with 10 m cell spacing are available for Tumaco and Morro Islands (Tumaco Bay) and Cascajal Island (Buenaventura Bay).
Figure 6. Computer grids. A 1: 810 m resolution grid; B 2: 270 m resolution grid; C 3: 90 m resolution grid; D 4: 30 m resolution grid; E 5: 10 m resolution grid]
![Figure 6. Computer grids. A 1: 810 m resolution grid; B 2: 270 m resolution grid; C 3: 90 m resolution grid; D 4: 30 m resolution grid; E 5: 10 m resolution grid]](/cms/asset/7973fe22-172a-4ed8-8201-70f0ec5b167d/tcej_a_1818362_f0006_oc.jpg)
Bathymetric and tidal information was provided by the Dirección General Marítima de Colombia (DIMAR), which follows specific standards established by the National Hydrographic Service; the data reach a resolution of up to 10 m in the areas where the impact of the tsunami is evaluated and the nested grids were constructed using detailed nautical charts (https://www.cioh.org.co/index.php/es/cartas-nauticas.html). For deeper waters, the General Bathymetric Chart of the Oceans (GEBCO) was used at the original resolution of 30 arc seconds and interpolated to the resolutions described above.
Topographic data for the high-resolution computer grids were obtained from LiDAR information at a resolution of ± 30 cm provided by DIMAR. These data were extrapolated to a grid resolution of 10 m and information about height of buildings and vegetation cover was filtered. All the spatial information was associated with the datum from the vertical hydrographic reference for the bays of Tumaco and Buenaventura, in this case, the average value of the mean low water springs (Alvarez et al. Citation2018).
The tsunami scenarios to be simulated were determined based on the above. A total calculation time of 4 hours with a time step of 0.15 s was established for the Bay of Tumaco, and a total calculation time of 6 hours with a time step of 0.1 s was established for the Bay of Buenaventura. The inundation in Tumaco Bay was assessed on Tumaco and Morro Islands, while for Buenaventura Bay, the inundation was assessed on Cascajal Island.
3. Results and discussion
3.1. Vertical deformation of the seabed
and show the vertical deformation of the seafloor for three scenarios of the slip deficit model and broadband slip model, respectively. The vertical deformation of the seafloor in the scenarios is consistent with the slip distribution in both models. The northern block of the Andes rises in deep water, while it subsides in shallow water and inland where the study areas are located. presents the maximum uplift and subsidence by segment for each scenario.
Figure 7. Vertical deformation of the seafloor for each of the three scenarios of slip deficit models in the Colombo-Ecuadorian subduction zone: worst-case scenario (left), 1906 scenario (center), and 1979 scenario (right)
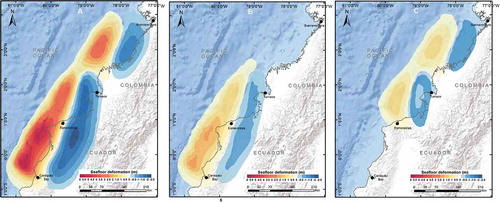
Figure 8. Vertical deformation of the seafloor for each of the three scenarios of broadband slip models in the Colombo-Ecuadorian subduction zone: worst-case scenario (left), 1906 scenario (center), and 1979 scenario (right)
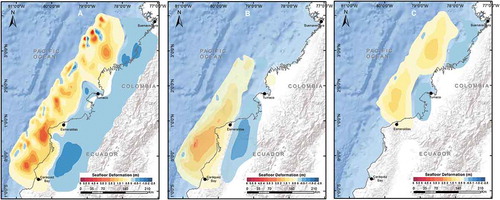
Table 2. Uplift and subsidence by segment for the scenarios
Differences in vertical deformation of the seafloor for the scenarios are supported by differences in the fault parameters () and the slip distribution, taking into account the direct relationship of the seismic magnitude and slip values with the vertical deformation. Thus, it is reasonable that the worst-case scenarios produce higher vertical deformation.
The slip distribution represented in the vertical deformation of the seafloor for each scenario defines the initial conditions of tsunami wave propagation and orientation. In this way, the tsunami heights and the inundation generated on the islands of Tumaco, Morro, and Cascajal, can be explained by the distribution of vertical seafloor deformation values in each scenario.
Maximum values in the uplift distribution of the vertical deformation in the worst-case scenario of the slip deficit and broadband slip models are concentrated in the Esmeraldas and Tumaco segment, respectively. From the above, it would be expected that the worst-case scenario of the slip deficit model would produce more inundation for the islands of Tumaco and Morro than for Cascajal Island and that the worst-case scenario of the broadband slip model would produce more inundation for Cascajal Island than for the other two islands. However, the results confirm substantial inundation on the islands of Tumaco and Morro, but not on Cascajal Island. This can be explained taking into account that regardless of the location of maximum vertical deformation uplifts in both worst-case scenarios, the attenuation suffered by the tsunami wave is high during propagation to and in transit through the bay of Buenaventura before reaching Cascajal Island. This implies that, during the propagation until the wave reaches the bay and during its transit there is an important demand for energy. To support this, shows the behavior of the tsunami in points of the Bay of Buenaventura from the entrance to Cascajal Island for the worst-case scenario of the slip deficit model ().
Three points of interest were established for the Bay of Buenaventura: the first (B1) is located at the entrance to the bay, the second (B2) is located in the middle of the access channel, and the third point (B3) is located near Cascajal Island.
At point B1 the maximum height was 83 cm, recorded at approximately minute 65. When the wave entered the bay, height differences were observed at points B2 and B3, with 65 cm and 20 cm at minutes 72 and 96, respectively. This is probably due to the direction of propagation and the interaction of the wave with the geomorphology of the access channel. At point B3, there was a considerable reduction in the height of the tsunami with respect to points B1 and B2, along the temporal evolution of the wave after passing through the Bay of Buenaventura. This can likely be explained is terms of a geoform in the intertidal zone off Cascajal Island which, when interacting with the tsunami, causes energy dissipation.
Figure 9. Variation of the free surface at selected points to record the evolution of the tsunami wave as it propagates into Buenaventura Bay: Worst-case scenario of the slip deficit model]
![Figure 9. Variation of the free surface at selected points to record the evolution of the tsunami wave as it propagates into Buenaventura Bay: Worst-case scenario of the slip deficit model]](/cms/asset/beaafe57-0a43-4f15-9c98-69ffe502ca2e/tcej_a_1818362_f0009_oc.jpg)
3.2. Tsunami height
and show the maximum tsunami height produced on the islands of Tumaco, Morro, and Cascajal, for three scenarios using the slip deficit model (), and three scenarios using the broadband slip model (). shows the maximum height, maximum distance of inundation, and area of inundation on each island for the six scenarios. The maximum tsunami height is referenced to the sea level considered in the numerical simulations.
Table 3. Maximum tsunami height, maximum inundation distance, and inundation area for the tsunami simulations around Tumaco, Morro, and Cascajal Islands, for six scenarios
3.2.1. Slip-deficit model scenarios
On Tumaco, for the worst-case, 1906, and 1979 scenarios, maximum tsunami height values of 4.66 m, 2.11 m and 2.30 m are respectively registered. The runup generated reaches a distance of inundation of 0.839 km, 0.156 km, and 0.347 km and produces areas of inundation of 3.48 km2, 1.38 km2, and 1.71 km2, which represent 72.8%, 28.8%, and 35.8% of the total area of the island, respectively.
For Morro Island for the same three scenarios, maximum tsunami heights are 4.34 m, 1.91 m, and 2.19 m respectively. The runup generated reaches a inundation distance of 1.10 km, 0.78 km, and 0.85 km and produces areas of inundation of 3.42 km2, 0.84 km2, and 1.06 km2, which represent 82.8%, 20.2%, and 25.5% of the total area of the island, respectively.
Finally, in Cascajal Island for the worst-case, 1906, and 1979 scenarios, tsunami heights are presented with maximum values of 0.53 m, 0.22 m and 0.29 m respectively. The runup generated reaches a distance of 0.47 km, 0.21 km, 0.27 km and produces areas of inundation of 0.33 km2, 0.14 km2 and 0.15 km2, which represent 12.6%, 5.2% and 5.8% of the total area of the island.
3.2.2. Broadband slip model scenarios
On Tumaco for the worst-case, 1906, and 1979 scenarios, maximum tsunami heights are 3.20 m, 1.45 m, and 1.88 m respectively. The tsunami penetrates a distance of 0.34 km, 0.01 km, and 0.30 km, and produces areas of inundation of 2.07 km2, 1.6 km2, and 1.62 km2, representing 43.3%, 33.5%, and 34.0% of the total area of the island.
For Morro Island for the same three scenarios, tsunami heights are presented with maximum values of 2.75 m, 1.13 m, and 1.45 m respectively. In this case the tsunami reaches a distance of 0.65 km, 0.55 km, and 0.78 km and produces areas of inundation of 1.68 km2, 0.50 km2 and 0.72 km2, which represent 40.7%, 12.1%, and 17.4% of the total area of the island.
Finally, in Cascajal Island for the worst-case, 1906, and 1979 scenarios, maximum tsunami heights are 0.52 m, 0.19 m, and 0.31 m respectively. The tsunami in these cases only reaches a distance of 0.45 km and produces an area of inundation of 0.3 km2, which represents 11.4% of the total area of the island.
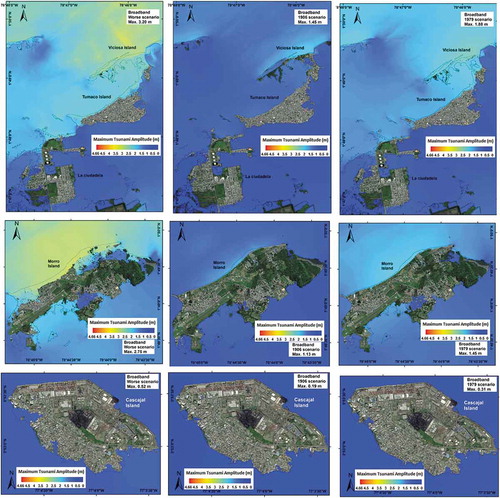
Figure 10. Tsunami height and run-up for slip deficit model scenarios. The worst-case scenario shows the maximum tsunami run-up. The top view is of Tumaco Island, the center view is of Morro Island and the bottom view is of Cascajal Island; left: worst case scenario; center: 1906 scenario; and right: 1979 scenario
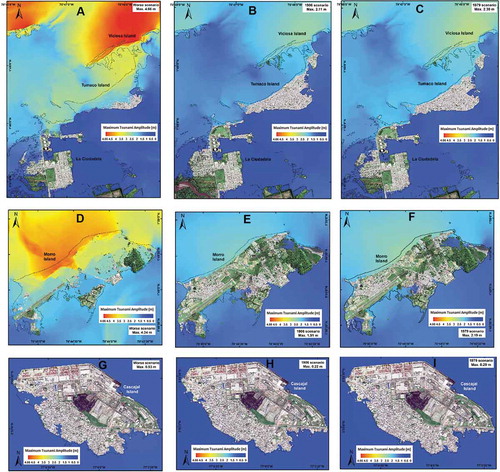
Figure 11. Tsunami height and run-up for broadband slip model scenario. The worst-case scenario shows the maximum tsunami run-up. The top view is of Tumaco Island, the center view is of Morro Island and the bottom view is of Cascajal Island; left: worst case scenario; center: 1906 scenario; and right: 1979 scenario
The worst-case scenario of the slip deficit model generates the largest tsunami heights, the largest tsunami run-up distances, and the largest inundation areas for all three islands ().
In all scenarios, the islands of Tumaco and El Morro suffer the impact of the tsunami with greater heights compared to what occurs with respect to Cascajal Island where height never exceeds 1 m.
3.3. Inundation depth
Based on comparative analysis of the previous results, and the calculation of inundation depth for each of the six scenarios, in each 10 m cell in the computer grids representing the islands of Tumaco, Morro, and Cascajal, it was determined that the worst-case scenario of the slip deficit model is associated with the highest inundation depth values on the islands ().
On the islands of Tumaco and Morro respectively, 10.9% and 10.2% of the land area is flooded to a inundation depth between 2 m – 5 m; 16.2% and 24.4% between 2 m and 1 m; 28.7% and 31.3% between 1 m – 0.3 m; 17.0% and 14.9% between 0.3 m and 0.01 m.
The tourist area on Morro Island is inundated at the highest interval i.e., between 5 m and 2 m. On Tumaco Island, a residential area with large vulnerable buildings built on low tide land on wooden stilts (Palafitos) is also inundated to this maximum extent.
On Cascajal Island, there is much less variability in terms of inundation extent and inundation depth: 12.6% of the island is flooded between 0.3 m and 0.01 m.
Figure 12. Inundation depth in meters, of the worst-case scenario of the slip deficit model for the Tumaco, Morro and Cascajal islands]
![Figure 12. Inundation depth in meters, of the worst-case scenario of the slip deficit model for the Tumaco, Morro and Cascajal islands]](/cms/asset/8e043d8b-989c-4849-b5ed-cb196f0eabd5/tcej_a_1818362_f0012_oc.jpg)
Restrepo and Otero (Citation2007) found that the maximum tsunami wave height for Cascajal Island in Buenaventura ranged from 2.6 to 4 m depending on the generation scenario evaluated, in contrast to the maximum heights obtained for the same area in this study which did not exceed 0.7 m. In the case of Tumaco, these differences are not as marked with respect to what was found by Quiceno and Ortiz (Citation2001), Cardona et al. (Citation2005), Sánchez and Puentes (Citation2012) and Otero, Restrepo, and Gonzalez (Citation2014). Beyond the seismic scenario used in each study, this heterogeneity in results concerning Buenaventura Bay could plausibly be explained by considering the role of the marine and coastal morphology, both in the exterior and interior zone of the bay. In this study, high resolution topography and bathymetry was reported and the detailed configuration of the terrain in the intertidal areas was taken into account. By contrast, in Restrepo and Otero (Citation2007), most of the coastal zone of Buenaventura Bay, except for Cascajal Island, was assumed to be non-floodable, so the processes of energy dissipation due to friction with the bottom and the “low tide” intertidal zones have been stressed in the present work. Nevertheless, it would be fruitful for future work to further explore the interaction of tsunami waves with the marine and coastal morphology of this area to confirm the extent to which tsunamis pose a threat to Buenaventura.
The present study calculated maximum height and inundation depth to evaluate the tsunami hazard through a deterministic approach in the areas of Tumaco and Buenaventura, specifically the islands of Tumaco, Morro, and Cascajal. Previous studies have evaluated the tsunami hazard in the same areas (Quiceno and Ortiz Citation2001; Cardona et al. Citation2005; Restrepo and Otero Citation2007; Sánchez and Puentes Citation2012; Otero, Restrepo, and Gonzalez Citation2014); however all defined the tsunami generation source via a homogeneous slip which does not best represent the initial condition of tsunami waves in nearby fields (Ulutas Citation2013). We argue that our approach which considered non-homogeneous slip distribution better represents initial condition of tsunami. In addition, in this study, a significant number of scenarios were used, in total six scenarios built with two types of models: slip deficit and broadband slip. Although the definition of the generation scenarios presents a limitation due to the lack of data for estimating the slip models, a significant advance is observed in the precision for simulating the vertical deformation of the seafloor, taking into account the distribution of uplifts and subsidies.
The application of the TUNAMI-N2 model herein, which has also been widely used in different case-study contexts (Pulido et al. Citation2015; Pulido, Yoshimoto, and Sarabia Citation2020, Mas et al. Citation2014), in addition to the high resolution of topography and bathymetry information, allows for advances in the calculation of tsunami hazard assessment variables. Despite the lack of free surface and field records to corroborate tsunami heights, the extension of inundation areas, and the inundation depth, there is agreement in inundation areas with results from previous studies (Quiceno and Ortiz Citation2001; Cardona et al. Citation2005, Sanchez and Puentes, 2012; Otero, Restrepo, and Gonzalez Citation2014).
Finally, it should be noted that, although the variables used in this study are suitable for hazard assessment, another variable that could render such an assessment even more precise is the calculation of tsunami flow velocity; we will consider this in future research.
4. Conclusions
The tsunami hazard assessment revealed that the worst-case scenario of the slip deficit model represents the most unfavorable tsunami case for the study area, supported by the results of tsunami height, area of inundation, and inundation depth, compared to the results of the 1906 and 1979 scenarios. Based on the worst-case scenario of the slip deficit model, a hazard map was created for the islands of Tumaco, Morro, and Cascajal, thus establishing areas of inundation and estimates of inundation depth. In this way, evacuation zones can be defined and potential damage due to a tsunami can be estimated. This map will serve to create tsunami mitigation plans in the municipalities of Tumaco and Buenaventura on the Colombian Pacific coast.
The values of tsunami height and inundation depth on the islands of Tumaco and Morro are highly representative compared to the values of tsunami height and inundation depth on Cascajal Island. This allowed us to confirm that the municipality of Tumaco, south of the Pacific coast, has the highest risk of tsunami inundation.
The results of the hazard assessment for Cascajal Island in Buenaventura yielded significantly lower values compared to those reported by other authors. This may reflect effects of the interaction of the tsunami with the marine and coastal morphology in the proximity and inland of the bay of Buenaventura, which may serve to dissipate energy in the tsunami waves. However, it is necessary to further explore the interactions between tsunami waves and morphology characteristics before a substantive hazard can be ruled out to this area of the Colombian Pacific.
Acknowledgments
This study was carried out as part of the SATREPS project entitled “Application of more advanced technologies to strengthen research and response to seismic, volcanic and tsunami events and improve risk management in Colombia”, sponsored by the Japan International Cooperation Agency (JICA) and the Japan Science and Technology Agency (JST). We are grateful to the following institutions for their support: Dirección General Maritima - Centro de Investigaciones Oceanográficas e Hidrográficas del Pacífico (DIMAR - CCCP); the International Research Institute for Disaster Science (IRIDeS) and the Core Research Cluster of Disaster Science at Tohoku University, Japan (a Designated National University); Universidad del Norte - Grupo de Investigación en Geociencias GEO4; the Geoinformatics Unit of the Advanced Intelligence Center Project (RIKEN); the National Research Institute for Earth Sciences and Disaster Prevention (NIED); and the Servician Geológico de Colombia (SGC).
Disclosure statement
No potential conflict of interest was reported by the authors.
References
- Alvarez, M., D. Pulido, L. Solano, and F. Oviedo. 2018. “Construction of the Reference (Vertical) Hydrographic Surface for the Bays of Buenaventura and Málaga, Colombian Pacific.” Boletín Científico CIOH 36 (36): 53–69. doi:10.26640/22159045.438. ( In Spanish).
- Cardona, Y., F. Toro, J. Vélez, and L. Otero. 2005. “Pacific Coast Tsunami Modeling Colombian: Bahia De Tumaco Case.” Avances en Recursos Hidráulicos 12: 43–54, 0121–5701. ( In Spanish).
- Chlieh, M., P. A. Mothes, J. M. Nocquet, P. Jarrin, P. Charvis, D. Cisneros, Y. Font, et al. 2014. “Distribution of Discrete Seismic Asperities and Aseismic Slip along the Ecuadorian Megathrust.” Earth and Planetary Science Letters 400: 292–301. doi:10.1016/j.epsl.2014.05.027.
- Collot, J. -Y., B. Marcaillou, F. Sage, F. Michaud, W. Agudelo, P. Charvis, D. Graindorge, M. -A. Gutscher, and G. Spence. 2004. “;Are rupture zone limits of great subduction earthquakes controlled by upper plate structures? Evidence from multichannel seismic reflection data acquired across the northern Ecuador–southwest Colombia margin.” Journal Geophysical Research 109: B11103. doi:10.1029/2004JB003060
- DANE. 2005. “Censo general 2005.” Colombia: Departamento Administrativo Nacional de Estadística. https://www.dane.gov.co/index.php/estadisticas-por-tema/demografia-y-poblacion/censo-general-2005-1
- DeMets, C., R. G. Gordon, and D. F. Argus. 2010. “Geologically Current Plate Motions.” Geophysical Journal International 181 (1): 1–80. doi:10.1111/j.1365-246X.2009.04491.x.
- Dimar-CCCP. 2013. “Tsunami: Risk Management in the Colombian Territory.” In Estudio de la Amenaza por Tsunami y Gestión del Riesgo en el Litoral Pacífico Colombiano, edited by Manjarrés and Moreno, 95–97. San Andrés de Tumaco, Colombia: Dimar. Special Publications Series. ( In Spanish).
- Feng, L., A. V. Newman, M. Protti, V. González, Y. Jiang, and T. H. Dix- On. 2012. “Active Deformation near the Nicoya Peninsula, Northwestern Costa Rica, between 1996 and 2010: Interseismic Megathrust Coupling.” Journal of Geophysical Research: Solid Earth 117 (B6): 1–23. doi:10.1029/2012JB009230.
- Gonzalez, J. L., and I. D. Correa. 2001. “Late Holocene Evidence of Coseismic Subsidence on the San Juan Delta, Pacific Coast of Colombia.” Journal of Coastal Research 17 (2): 459–467. 0749–0208.
- Gutscher, M. -A., J. Malavieille, S. Lallemand, and J.-Y. Collot. 1999. “Tectonic segmentation of the North Andean margin: impact of the Carnegie Ridge collision.” Earth and Planetary Science Letters 168 (3–4), 255–270. doi:10.1016/s0012-821x(99)00060-6
- Imamura, F. 1996. “Review of Tsunami Simulation with a Finite Difference Method.” In Long-Wave Run-Up Models, edited by Yeh et al., 25–42. New Jersey, USA: World Scientific
- Mas, E., B. Adriano, J. Kuroiwa Horiuchi, and S. Koshimura. 2015. “Reconstruction Process and Social Issues after the 1746 Earthquake and Tsunami in Peru: Past and Present Challenges after Tsunami Events.” In Post-Tsunami Hazard Reconstruction and Restoration, edited by V. Santiago-Fandino, Y. A. Kontar, and Y. Kaneda, Vol. 44, 97–109. New York: Springer Netherlands. doi:10.1007/978-3-319-10202-3_7.
- Mas, E., B. Adriano, N. Pulido, C. Jimenez, and S. Koshimura. 2014. “Simulation of Tsunami Inundation in Central Peru from Future Megathrust Earthquake Scenarios.” Journal of Disaster Research 9 (6): 961–967. doi:10.20965/jdr.2014.p0961.
- Migeon, S., C. Garibaldi, G. Ratzov, S. Schmidt, J.-Y. Collot, S. Zaragosi, and L. Texier. 2017. “Earthquake-triggered Deposits in the Subduction Trench of the North Ecuador/South Colombia Margin and Their Implication for Paleo Seismology.” Marine Geology 384: 47–62. doi:10.1016/j.margeo.2016.09.008.
- Mora-Páez, H., J. N. Kellogg, J. T. Freymueller, D. Mencin, R. M. S. Fernandes, H. Diederix, P. LaFemina, et al. 2019. “Crustal Deformation in the Northern Andes - A New GPS Velocity Field.” Journal of South American Earth Sciences 89: 76–91. doi:10.1016/j.jsames.2018.11.002.
- Moreno, M., M. Rosenau, and O. Oncken. 2010. “2010 Maule earthquake slip correlates with pre-seismic locking of Andean subduction zone.” Nature 467 (7312): 198–202. doi:10.1038/nature09349
- Nishimura, T., T. Hirasawa, S. Miyazaki, T. Sagiya, T. Tada, S. Mi- Ura, and K. Tanaka. 2004. “Temporal Change of Interplate Coupling in Northeastern Japan during 1995–2002 Estimated from Continuous GPS Observations.” Geophysical Journal International 157 (2): 901–916. doi:10.1111/j.1365-246X.2004.02159.x.
- Okada, Y. 1992. “Internal Deformation Due to Shear and Tensile Faults in a Half-space.” Bulletin of the Seismological Society of America 82 (2): 1018–1040.
- Otero, L., J. C. Restrepo, and M. Gonzalez. 2014. “Tsunami Hazard Assessment in the Southern Colombian Pacific Basin and a Proposal to Regenerate a Previous Barrier Island as Protection.” Natural Hazards and Earth System Sciences 14 (5): 1155–1168. doi:10.5194/nhess-14-1155-2014.
- Pérez, G., La actividad portuaria en Buenaventura Ed., 2007. Historia, geografía y puerto como determinantes de la situación social de Buenaventura. Cartagena. Colombia: BANREP. ( In Spanish).
- Poveda, E., and N. Pulido. 2019. “Earthquake Rupture and Slip Scenarios for Ecuador-Colombia Subduction Zone.” Colombian Geological Survey (SGC). seismo.sgc.gov.co:90. http://sismo.sgc.gov.co:90/
- Protti, M., V. González, A. V. Newman, T. H. Dixon, S. Y. Schwartz, J. S. Marshall, L. Feng, J. I. Walter, R. Malservisi, and S. E. Owen. 2014. “Nicoya Earthquake Rupture Anticipated by Geodetic Measurement of the Locked Plate Interface.” Nature Geoscience 7 (2): 117–121. doi:10.1038/ngeo2038.
- Pulido, N., M. Yoshimoto, and A. M. Sarabia. 2020. “Broadband Wavelength Slip Model of the 1906 Ecuador-Colombia Megathrust-earthquake Based on Seismic Intensity and Tsunami Data.” Tectonophysics 774: 228226. doi:10.1016/j.tecto.2019.228226.
- Pulido, N., Z. Aguilar, H. Tavera, M. Chlieh, D. Calderon, T. Sekiguchi, S. Nakai, and F. Yamazaki. 2015. “Scenario Source Models and Strong Ground Motion for Future Mega-earthquakes: Application to Lima, Central Peru.” Bulletin of the Seismological Society of America 105 (1): 368–386. doi:10.1785/0120140098.
- Quiceno, A., and M. Ortiz. 2001. “Evaluation of the Impact of a Tsunami on the Colombian Pacific Coast (Tumaco Region).” Boletin Science CIOH 8: 5–14. doi:10.26640/01213423.8.5_14. ( In Spanish).
- Ramírez, J.E., and J.R. Goberna, J.R. 1980. Colombian earthquakes. November 23 and December 12, 1979. Bogotá, Colombia: Instituto Geofísico. (In Spanish)
- Renou, C., O. Lesne, A. Mangin, F. Rouffi, A. Atillah, D. El Hadani, and H. Moudni. 2011. “Tsunami Hazard Assessment in the Coastal Area of Rabat and Sale, Morocco.” Natural Hazards and Earth System Sciences 11 (8): 2181–2191. doi:10.5194/nhess-11-2181-2011.
- Restrepo, J. C., and L. Otero. 2007. “Numerical Modeling of Tsunamigenic Events in the Colombian Pacific Basin - Buenaventura Bay.” Journal of the Colombian Academy of Exact, Physical and Natural Sciences 31: 363–377, 0370–3908. ( In Spanish).
- Sagiya, T., and H. Mora- Páez. 2019.“Interplate Coupling along the Nazca Subduction Zone on the 471 Pacific Coast of Colombia Deduced from GeoRED GPS Observation Data, Geology of Colombia.” Servicio Geologico Colombiano, submitted.
- Sánchez, R., and M. Puentes. 2012. “Estimation of the Tsunami Threat in the Municipality of San Andrés De Tumaco, Colombian Pacific, Using LiDAR Information.” Boletín Científico CIOH 30 (30): 29–42. doi:10.26640/22159045.241. ( In Spanish).
- Ulutas, E. 2013. “Comparison of the Seafloor Displacement from Uniform and Non-uniform Slip Models on Tsunami Simulation of the 2011 Tohoku–Oki Earthquake.” Journal of Asian Earth Sciences 62: 568–585. doi:10.1016/j.jseaes.2012.11.007.
- Vásquez, L., J. Iriarte, and R. Sánchez. 2018. “Determination of Maximum Flood Level in the Colombo-Ecuadorian Border by Applying Numerical Modeling.” Boletín Científico CIOH 37 (37): 3–16. doi:10.26640/22159045.446. ( In Spanish).
- Yabuki, T., and M. Matsu’ura. 1992. “Geodetic Data Inversion Using a Bayesian Information Criterion for Spatial Distribution of Fault Slip.” Geophysical Journal International 109 (2): 363–375. doi:10.1111/j.1365-246X.1992.tb00102.x.
- Yoshimoto, M., H. Kumagai, W. Acero, G. Ponce, F. Vasconez, S. Arrais, M. Ruiz, A. Alvarado, P. Pedraza, V. Dionicio, O. Chamorro, Y. Maeda, and M. Nakano. 2017. “Depth-dependent rupture mode along the Ecuador-Colombia subduction zone.” Geophysical Research Letters 44: 2203–2210. doi:10.1002/2016GL071929
- Yoshimoto, M., H. Kumagai, T. Sagiya, H. Mora-Páez, and N. Pulido. 2019. “Large Earthquake Ruptures and Plate Coupling in the Colombia-Ecuador Subduction Zone, Submitted.”
- Yoshimoto, M., and Y. Yamanaka. 2014. “Teleseismic Inversion of the 2004 Sumatra-Andaman Earthquake Rupture Process Using Complete Green’s Functions.” Earth, Planets and Space 66 (1): 152. doi:10.1186/s40623-014-0152-4.
- Yoshioka, S., T. Yabuki, T. Sagiya, T. Tada, and M. Matsu’ura. 1993. “Interplate Coupling and Relative Plate Motion in the Tokai District, Central Japan, Deduced from Geodetic Data Inversion Using ABIC.” Geophysical Journal International 113 (3): 607–621. doi:10.1111/j.1365-246X.1993.tb04655.x.