
 ?Mathematical formulae have been encoded as MathML and are displayed in this HTML version using MathJax in order to improve their display. Uncheck the box to turn MathJax off. This feature requires Javascript. Click on a formula to zoom.
ABSTRACT
In this article, I analyze why inequality can discourage investment. I derive my hypothesis from the theory of aspirations as a reference point. A more significant aspiration gap – the distance between the current state and the aspired state – leads to frustration and fewer incentives to invest. In study I, I use data from a longitudinal panel, exploiting environmental shocks to identify a plausibly exogenous source of variation for inequality. I combine it with an indirect measurement of aspirations using data on wealth, computed for the plausible reference group, defined as cells within the population, sharing similar observable characteristics. Finally, I use the variation in the total debt as the outcome variable. In study II, I use data from a specialized survey where shocks and aspirations are directly measured. I look at total debt as the outcome. Although the two tests are only partially conclusive, the evidence aligns with the central hypothesis.
1. Introduction
Why is inequality bad? On average, societies think inequality is unfair and prefer allocations with more equally shared resources (Stiglitz Citation2013). However, it is generally argued that inequality should be tolerated for its incentive effect (Lucas Citation2004).
This mainstream approach has been harshly criticized, however. It has been pointed out that inequality can undermine efficiency because more unequal societies have lower social capital (Wilkinson and Pickett Citation2019). It has been claimed that more unequal societies tend to have less performing political systems (Alesina and Rodrick Citation1994; Alesina and Tabellini Citation1988; Weede Citation1997) or more unstable financial systems (Atkinson and Morelli Citation2015). A more recent strand of the literature suggests yet another channel: in unequal societies, citizens are more likely to feel left behind and experience frustration (Genicot and Ray Citation2017; Bogliacino and Ortoleva Citation2015; Dalton, Ghosal, and Mani Citation2015). This mechanism is due to reference dependence, a phenomenon by which a decision-maker evaluates outcomes from the point of view of a reference point (Kahneman and Tversky Citation1991; O’Donoghue and Sprenger Citation2018) in this case is the level of aspirations.
This theoretical proposition is difficult to test because reference points are uneasy to observe, inequality is codetermined with many other variables, and omitted variables may explain why inequality, reference points, and behavior are correlated.
To circumvent these problems, I use shocks to identify inequality. I compare the effect of shocks among those closer to aspirations with respect to those farther, in a difference in difference approach, where I condition on a set of covariates. I combine data from two different sources.
In study I, I use a longitudinal database collected in Colombia that follows households across different waves (Encuesta Longitudinal de Colombia, Universidad de Los Andes, Bernal Salazar et al. Citation2014). I partition the sample into cells that approximate the reference groups, defined by the area and region where the individuals live. I look at how exposure to natural shocks affects families’ behavior at a different distance from the reference point. Since shocks are plausibly exogenous, the effect can be interpreted causally within each subgroup. To the extent that these groups are classified over the intensive margin – different distances from the reference point – within cells defined in terms of observables, I can tentatively interpret the variation in the response as the causal effect of reference dependence. To approximate investing decisions, I choose the debt variation as the outcome variable due to data limitations on the evolution of assets.
In study II, I use the data from a survey of 474 small farmers in Colombia. Compared to study I, I lose the longitudinal dimension, but I improve on the measurement of aspirations and shocks. In this case, the outcome variable is the level of debt. I use the same difference in difference strategy but with the following variables. The level of aspirations has been elicited through the following question ‘For the standard of living you consider satisfactory, what level of monthly household income would you aspire to in the next twelve months, including all sources?’.Footnote1 I compute the aspiration gap as the log distance between income and aspirations, again splitting according to the median. I then calculate the number of negative events reported as having affected the household in the previous year through a specific survey module on shocks. To soften the potential endogeneity, I define those households who self-reported more than the median level of shocks.
I found the following main result. In both studies, exposure to shocks reduces the outcome in those farther from the reference point, concerning those closer to it. The effect is statistically significant in Study I but not in Study II, most likely for issues of statistical power.
This article provides two contributions to the literature. First, it contributes to the development literature that studies the presence of internal psychological constraints. Traditionally, the economic literature has linked inequality and poverty to certain ‘external constraints’ such as imperfections in the labor market or access to credit, which condition the possibilities of individuals to accumulate capital and attain social mobility. More recently, a strand of literature has shown interest in exploring the role of ‘internal constraints’ imposed by motivation and other psychological factors (Banerjee, Mullainathan, and Banerjee Citation2010; Manstead Citation2018; Brown-Iannuzzi et al. Citation2015).
Second, this article contributes to the literature on aspirations as a development driver.
A significant number of studies have shown how the capacity to aspire drives the incentive to acquire education or capital (Besley Citation2017; Desdoigts and Moizeau1 Citation2005; Ferrara Citation2019; Kearney and Levine Citation2014; Lim Citation2018; Ross Citation2019). In anthropology, aspiration can be understood as a form of identification and search of the psychological means for the satisfaction of a purpose. As a result, aspirations relate to wishes, preferences, and individual elections (Appadurai Citation2004). In psychological research, aspirations are associated with the ‘locus of control,’ which refers to a space in which the individuals believe to control their own lives, in contrast with lack of aspirations where individuals look for external determinants of the contingencies they face (Ferrara Citation2019).
This article proceeds as follows. Section 2 presents the theoretical hypothesis. Section 3 presents the data, identification strategy, and results of Study I. Finally, Section 4 presents Study II. Section 5 concludes.
2. Main theoretical hypothesis
A large body of evidence from experimental and quasi-experimental studies suggests that a decision-maker does not choose by simply comparing outcomes but rather by evaluating them in terms of gains or losses concerning a reference point (Tversky and Kahneman Citation1991; Camerer et al. Citation1997; Markle et al. Citation2018; Kramer Citation2016; Allen et al. Citation2014; Baillon, Bleichrodt, and Spinu Citation2020; Lim Citation2018). This is the basic tenet of Prospect Theory by Kahneman and Tversky (Citation1991) (KT hereafter). Prospect theory claims that agents display loss aversion: below the reference point, they are risk-seeking, whereas they are risk-averse in the domain of gains. The economic interpretation is straightforward: agents become more tolerant of risk when through it, they can avoid losses.
In the development literature, this has been incorporated into models where individual preferences have a KT component, where the reference point alters the choices made by households. In this literature, reference points are represented by personal aspirations and are socially determined (Genicot and Ray Citation2017; Bogliacino and Ortoleva Citation2015). In particular, aspirations are defined as a sufficient statistic of the wealth distribution within the reference group (e.g. friends, neighbors, or peers), usually the mean.
Hoffmann, Henry, and Kalogeras (Citation2013) provide some empirical support to the tenet that aspirations act like a reference point. They study how individual aspirations influence decision-making in the risk domain. Through experimental work, they find that aspiration is their primary reference point during the early decision-making. At the same time, their level of wealth at the beginning of the experiment is the central reference point during the later stages. In a similar framework, but using happenstance data, Kramer (Citation2016) shows how reference dependence can affect individual saving, depending on people's liquidity constraints. Forming a reference point can improve people's savings conditions to avoid losses in the future.
Bogliacino and Gonzales-Gallo (Citation2015) claim that aspirations drive propensity to take risk in entrepreneurs. Since they manipulate aspirations though a priming technique, their evidence can be plausibly interpreted as causal.
Development models using reference-dependent (Bogliacino and Ortoleva Citation2015; Genicot and Ray Citation2017) claim that a more pronounced inequality, increasing the polarization between the haves and the have-nots, can move individuals into a zone of frustration where their investment decisions are revised downwards. In this case, an exogenous shock that pushes people away from their reference point discourages capital accumulation. In other words, albeit having reference-dependence makes people more ‘pro-active,’ with respect to standard preferences, it makes them frustrated or discouraged when the reference point is perceived as unattainable.
This theoretical claim usher the following implication: societies more uneven are those with a greater risk of people trapped into poverty.
Based on this argument, I formulate the following hypothesis: the larger the inequality, the higher the likelihood that investment becomes discouraged. This occurs because inequality pushes back people from the reference point, which mediates the effect of inequality: if the shock leaves the household in the area where aspirations are no longer binding, the household will give up. This is empirically equivalent to assuming that the negative effect of inequality is larger, the larger the aspiration gap.
3. Study I
3.1. The data
The data for study I comes from the Colombian Longitudinal Survey of the Universidad de Los Andes (ELCA), which includes 10.800 households. Information is gathered every three years, 2010 (wave I), 2013 (wave II), and 2016 (wave III). The total sample included in the ELCA is composed of 10.800 households. The sample is representative of Colombia across three main dimensions: Socioeconomic Strata (SES) 1–4,Footnote2 rural and urban areas, and five geographic regions of Colombia. The sample is stratified and tracks the head of household, spouse, and children.
The principal outcome variable is calculated as the change in debt between waves I and III. Total debt in every wave is the sum of all liabilities. The change is computed as the difference between the levels in two time periods. To measure the effect of inequality, I use the plausibly exogenous variation induced by shocks. To this aim, I introduce a dummy equal to one if the household experienced a natural disaster (earthquake, flood, or avalanche) in wave I and zero otherwise.
Following Maestri, Bogliacino, and Salverda (Citation2014), I compute the gross wealth as the sum of financial and non-financial assets. Financial assets include the amount reported in savings, pension funds, severance pay, informal savings, loans to other households, and life insurance. Non-financial assets include the values of the house of property, additional housing, plots of land, and buildings. Finally, I calculate the value per capita by scaling over the household size, Ethnicity, education, and household size are included as a control.
To calculate the value of the total income by household, I follow the standard procedure and start from the primary source of income; in the case of the rural households, I consider the income from agricultural and non-agricultural activities, then I add the income from dividends, pensions, rents, subsidies, and other income.
Despite the wide availability of data, the survey does not report the value of the primary house. Instead, I recur to an imputation procedure, using properly defined cells (Feres, Mancero, and Pizarro Citation2001). I define a cell using three variables that are good predictors of the house market value: urban versus rural, the region, and the social-economical strata. I then calculate the average rent in each cell. To impute the house's worth, I use a law in Colombia that states that the canon of rent cannot exceed 1% of the market value.Footnote3 In practice, after calculating the mean rent in each cell, I estimate the house value by dividing it by 0.01.
A central tenet of the literature that inspires this work is that individual aspirations are socially determined; thus, the reference point is derived from the distribution of peers. As in Bogliacino and Ortoleva (Citation2015), I use the average wealth by cell, computed from wave I (2010).
I need to define the reference group (the cell) to close the model. This work determines a cell by zone and region for a total of nine cells. Once the aspiration is defined per each cell j, I compute the distance from the level of aspiration, or aspiration gap, per each household i in cell j: this is defined as
, where
is the individual wealth. Splitting in correspondence with the aspiration gap’s median, I define a dummy variable (HD) that takes the value of one if the distance is greater than the median and zero otherwise.
3.2. Identification strategy
I need a research design because I am interested in providing a causal claim. By research design, it is meant a set of plausible assumptions that allows interpreting empirical data as if they were the results of an experiment performed by the researcher. Before providing an extensive analytical explanation, let me briefly explain the logic of the design.
I used the shocks as a credible source of variation of inequality. To make sure that I can assign an effect to a variation of inequality, I need to vary inequality independently from other confounding factors. Since shocks are generated by phenomena, such as natural events independent from the outcome under analysis, they can reasonably be assumed as exogenous.
Additionally, to understand the effect of reference dependence, I match households based on a set of observable characteristics. As if, for each ‘treated’ household, I would identify ex-post a ‘mirror’ control. In practice, I will define cells within the sample drawn from the population of interest.
Therefore, we can define the estimator as follows: Consider the outcome of interest using the traditional switching regression (Angrist and Pischke Citation2009). Call the dummy for having suffered shock,
the dummy for reference dependence, and
the potential alternative outcome for unit i under status k (1 equal having suffered shock and 0 otherwise) and l (1 equal being under reference dependence and 0 otherwise). The outcome variable is the variation in personal debt.
Running OLS on the following estimation on a sample from the population would converge to ( being the expected value on the population of interest):
Using standard manipulation, this is equal to.
In the above expression, and
are causal parameters (Average Treatment on the Treated) that correspond to the impact of the shock respectively on those under reference dependence and those away from reference dependence. The other terms are selection bias. Clearly, for identification, I need the following assumption:
(1)
(1)
Under Assumption 1, I can write
To identify the effect of reference dependence, I rely on a selection over observable strategy. Conditioning on a subset of variables observed at the individual level; conditional independence implies that the distance from the reference dependence is as good as randomly assigned for people matched on the observable characteristics. Formally, the second assumption states
(2)
(2)
Through similar manipulation, one gets
Which is the differential impact of shocks under reference dependence with respect to the shock without reference dependence.
Assumptions [1] and [2] are necessary for identification. Notice that shocks are natural events and can be reasonably assumed to be independent of individual decisions. The only serious threat to identification is the general equilibrium effect, discussed in the final section. However, the second assumption is more stringent; it is a reasonable approximation to the reference group.
After properly defining RD = 1 as the group within the effect of reference dependence (RD = 0 otherwise), from the switching regression, we can derive the following equation:
where
is the variation of the total debt between 2010 and 2016 of each individual;
is the dummy for shock (measured in 2010),
is a dummy equal to one of the aspiration gap is larger than the median, denominated High distance, and
, is the interaction between suffering a shock and having a larger aspirations gap.
is the vector of individual level control, including the change in income between 2016 and 2010, ethnicity (this is a dummy equal to 1 if the individual is considered to be from a minority, indigenous, gypsy, raizal, Palenquero, and afro-descendant), the level of education, and the household size.
Under assumptions [1] and [2], the coefficients can be estimated via OLS. Standard errors are estimated via bootstrapping because some data are measured with errors. In this case, the coefficient correspond to the parameter of interest
.
3.3. Descriptive evidence
summarizes descriptive statistics for the entire sample in the survey. The table includes saving and debt behavior and additional economic variables. I consider how much the respondent held in the previous month to measure savings. I can notice that saving is zero for most of the sample: 4 percent of respondents were in this group in 2010. On average, the amount saved was $128,450 in 2010 and $152,963 in 2016. Debt is more common for 2010, 56 percent of the sample had debts for $645,303 on average, and in 2016 the 83 percent reported changes in their debt for $392,710 on average, with large variance.
Table 1. Summary statistic.
The average per capita monthly income was around $211,045, and the per capita wealth is approximately $931,748, but there is substantial variance. In the sample, 10 percent of households have experienced the shock ().
Table 2. Summary statistics study 2.
3.4. Main results
Recall that I use the distance between the mean wealth in the reference cell and the individual gross wealth level to measure the aspiration gap in the principal estimation. The sample can be divided into two, using the median as the threshold. Additionally, I split according to the exposure to shock.
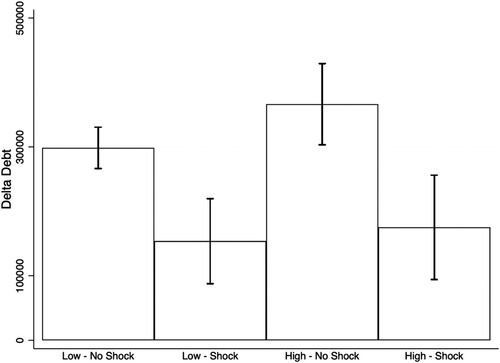
plots the outcome (the variation in the level of debt), with the confidence interval at 95%, among the four groups. On average, those who did not experience the shock increased their level of debt by a larger amount ($300.000 in the low group and $366.000 in the high group), the difference is more significant among those who have a greater distance from the reference point compared to those who are closer.
Figure 1. Variation of debt in front of a group of differences and experience of shock with aspirations like median in the cell.
I move to the regression analysis. The supporting regressions are reported in . In column 1, I estimate Equation (1) by OLS for this first study.
Table 3. Regression analysis with debt (in thousand).
The results are consistent with the central hypothesis. Individuals with a more significant aspirations gap are ‘frustrated’ when suffering shock. To quantify the effect: a shock decreases by 76,000 the variation in debt (our measure of investment) when a participant is farther from the reference point than when it is closer. Since the standard deviation of the Delta Debt is 4,617,996, the causal effect corresponds to 1.6% of a standard deviation. This is consistent with the argument made by Genicot and Ray (Citation2017) and Bogliacino and Ortoleva (Citation2015). I have included other explanatory variables, which capture pre-existing individual characteristics, but which are not directly affected by the treatment; these were described in the previous section. The coefficients show the expected signs, and all of them are statistically significant. It can be observed that a higher level of education is associated with a more substantial level of debt ($96.700). This is expected because of the complementarity between human and other forms of capital. Recognizing oneself as part of an ethnic group is associated to a lower level (−$352.000), because of constraints in the access to credit market, most likely.
4. Study II
4.1. The data
The data source for the second study is a survey of 474 farmers in four municipalities in the departments of Santander and Cundinamarca (Cabrera, La Palma, Puerto Wilches, Venecia).
In each municipality, confederates were approaching small farmers by visiting their houses. An initial approach with local leaders was necessary to gain trust, but data collection ensured anonymity and minimal scrutiny from outside persons.
The instrument was designed to obtain information on socioeconomic conditions, quality of life, trust, and social cohesion. It included five modules. The first refers to the socio-demographics, geographical location, urban or rural area, and household size. The second module applies a standard instrument to measure food security. The third sought to identify the characteristics of the plot, the ownership of formal titles, size, and crop productivity.
The fourth module looks at exposure to shocks and seeks to identify the levels of vulnerability of the surveyed households. It includes the following items: natural shocks (earthquake, storm, avalanche, drought, flood, frost, pests), economic shocks (loss of employment, loss of harvest, variation in prices of cultivated products, loss of state aid), family shocks (death of a household member, separation), and armed conflict shocks. Finally, the fifth module measures income, savings, and individual aspirations.
Data were collected in the context of project to evaluate the welfare within specific territories (Vargas Citation2018; Gutiérrez Baquero Citation2018; León Matta Citation2019). The sampling strategy had some variation across the areas but, in general, tried to cover each municipality's entire set of administrative sub-units (veredas).
Aspirations are elicited through a specific question: ‘For the standard of living you consider satisfactory, what level of monthly household income would you aspire to in the next twelve months, including all sources?’. I then estimated the distance from the aspiration level per farmer i; this is simply defined as . Notice that both aspirations and income are defined using the flow and not the stock. I represent a dummy variable (HD) that takes the value of one if the aspiration gap is greater than the median and zero if it is less. I use this variable to define the reference dependence. Finally, I use the total debt as the primary outcome variable. It is self-reported by the farmers in a specific question.
4.2. Identification strategy
As in the first study, I estimate the model by OLS using a dif in dif strategy.
where
is the total debt, and in the same way that in the first study,
is a dummy equal to 1 if the person experiences the shock and 0; otherwise,
is a dummy equal to one if the individual has a distance from the aspiration which is larger than the median; called High distance, and finally,
corresponds to the interaction term, high distance
shock.
is the vector of individual level control, including the size of land owned and the level of education, and the household size.
4.3. Descriptive evidence
summarizes descriptive statistics for the entire sample in the survey. As in , the table includes saving, debt, and the other main economic variables. Like in the previous one, the survey did not directly capture investment. Instead, I use debt as an indicator of future-oriented behavior. I use the data in per capita terms. For example, on average, the amount saved was $205.862, and 90 percent of the sample has reported positive savings, meanwhile reported debt is $5.491.121 on average. The survey captures the individual aspirations; it is $655.556 on average. Finally, about 81 percent have experienced shocks.
4.4. Main results
As discussed in the data section, I calculate the difference between the aspiration reported by farmers and their income level in the principal estimation. Like in the first study, the sample was then divided into two groups, those with the distance below the median difference (low) and those with the distance above the median difference (high). In , I report the total debt by each group, with the confidence interval at 95%. There are four groups, defined by the level of the aspirations gap (low – high) and according to whether they experienced the shock or not.
Figure 2. Debt in front of a group of differences and experience of shock.
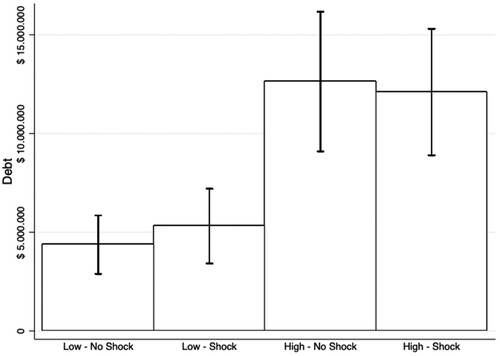
While, on average, those who did not experience the shock have a lower amount of debt in the reference dependence area, they have a higher level of debt when they are outside the reference dependence area. This is precisely what one would expect based on the theoretical model discussed in the previous section.
The primary regression confirms this evidence (). As in the previous study, the estimated coefficient for is negative; the difference in magnitude is about $335.000. Given that the standard deviation of debt is $22,200,300, the effect size is 1.5% of a standard deviation. Despite the lack of statistical significance, this estimation aligns with that of the first study. Again, it can be interpreted as the fact that being pushed away from peers is a harbinger of incentives when the aspirations are attainable but is discouraging and frustrating when the reference point is farther away. As in the first study, I included some explanatory variables to control for individual characteristics. Unlike the first study, the survey included land size, but not ethnicity and change in income. Only education and land size are significant and have the expecting signs. An higher educational level is associated with more debt ($573.000). A larger size of inhabited land is also related to a higher debt ($274.000), which is consistent with a collateral effect. It is essential to mention that the estimates are unaffected by the choice of the control variables in both analyses.
5. Discussion and concluding remarks
This paper assesses to what extent inequality, mediated by reference dependence, leads to more polarized societies where a class of citizens is left behind. It assesses this question empirically, combining evidence from two studies and a similar identification strategy based on exogenous shocks, a selection over observables, and an estimation of differential trends. While the evidence is, to some extent, mixed, these results provide strong evidence of a negative link between the aspirations gap and capital accumulation. They are consistent with the theoretical literature on aspirations as reference points that could explain why aspirations drive the willingness to invest and attain higher educational level. Inequality may lead to discouragement and frustration, leaving people behind.
This paper has some obvious strengths. The use of different data sources, longitudinal and cross-sectional, covering standardized and specifically designed instruments points towards a greater internal and external validity of the results. It has some limitations, however. The outcome is measured with error in both studies: the level of investment or the variation in assets would be a much better candidate. Additionally, shocks are not really a lottery, as a general equilibrium effect or other violation of SUTVA (Cunningham Citation2021) may be present. SUTVA, the acronym for Stable across all Units Treatment Value Assumption, is the hypothesis that the cause only affects those units exposed to it and not those used as a comparison group. In the presence of general equilibrium effects, this assumption could be violated. Long differences are comforting for the first study’s results, but this is potentially an issue.
A final point concerns the interpretation of the results. In many instances, the literature on the psychology of the poor tends to feed vitriolic discussion over the political implications. As it happened during the Moynihan Report (Office for Policy Planning and Research Citation1965), structural features may be internalized and become ‘sticky,’ and pointing towards this inertia is interpreted by those on one side of the political spectrum like blaming the victim. In reality, this evidence suggests that collective institutions should be developed to cushion citizens from shocks and can be coupled with considerable evidence that aspirations can be appropriately shaped (Ghosal et al. Citation2020).
These findings have implications for policy and development. In terms of policy, these findings can help reconcile why policies aimed at alleviating physical and human capital constraints are often unsuccessful at keeping people out of poverty. Aspirations are a strong predictor of future behavior; they are likely to complement policies targeting savings, credit use, and investment alternatives. In particular, programs that boost aspirations.
Although precise recommendations on how to design those programs require testing and evaluation and more accurate knowledge of every specific context, a general lesson from the present work is that helping people set goals and have a future-oriented mindset can complement provisions in-kind or monetary.
Based on the results presented in this article, there is a significant need for additional work on testing the extent to which psychological constraints are binding for households and how serious it is in developing countries. Replication of a similar approach in other Latin American countries should be welcomed.
As usual, further research is needed to measure better all the variables used in this study. Although there has been a significant improvement in terms of aspirations, the literature still lacks a comprehensive toolbox for measurement, similar to those developed for inequality.
Acknowledgements
I appreciate comments from participants to an internal seminar at the Econ PhD at the Universidad Nacional de Colombia, to 16th annual conference of the Italian Association for the History of Economic Thought (STOREP), and Catedra Homero Cuevas at Universidad Nacional de Colombia. Comments from the Editor, Prof Lucio Esposito, were very valuable. I thank Prof F Bogliacino for allowing me to access the data for Study II, that were collected thanks to the generous funding by Universidad Nacional, ‘Convocatoria Nacional de Proyectos para el fortalecimiento de la Investigación, creación e innovación de la Universidad Nacional de Colombia 2016–2018’ (Project 35685). The usual disclaimer applies.
Disclosure statement
No potential conflict of interest was reported by the author(s).
Notes
1 The literature on the measurement of aspirations is still in is nascence. There is no work that suggests using a single item to measure aspirations, but they rather rely on multiple constructs (Bernard and Taffesse Citation2014), but that elicitation was impossible in the context of the data collection performed for Study II.
2 In Colombia, each dwelling is assigned one of six tax tiers, depending on the market value and other home characteristics and the residence’s area. There exist six tax tier levels, with 1 (6) indicating the lowest (highest) tax tier, and thus lowest (highest) Socio-Economic Strata. Utility bills are differentiated per tier, being ceteris paribus higher for dwellings estimated as having higher market value (Bogliacino, Jiménez, and Reyes Citation2018).
3 Article 18, Law 820 of 2003.
References
- Alesina, A., and D. Rodrick. 1994. “Distributive Politics and Economic Growth.” Quarterly Journal of Economics 109 (2): 465–490.
- Alesina, A., and G. Tabellini. 1988. “Voting on the Budget Deficit.” National Bureau of Economic Research. Working Paper 2759. 80 (1): 37–49
- Allen, E. J., P. M. Dechow, D. G. Pope, G. Wu, J. Allen, H. Bleichrodt, and R. Zhu. 2014. “Dependent Preferences: Evidence from Marathon Runners.” Nber Working Paper Series (Vol. 20343). https://www.nber.org/papers/w20343.
- Angrist, J. D., and J. Pischke. 2009. Mostly Harmless Econometrics: An Empiricistís Companion. Princeton, New Jersey: Princeton University Press.
- Appadurai, A. 2004. “The Capacity to Aspire: Culture and the Terms of Recognition.” In Culture and Public Action, edited by V. Rao and M. Walton, 59–84. Stanford, California: The World Bank.
- Atkinson, T., and S. Morelli. 2015. “Inequality and Crises Revisited.” Economia Politica 32 (1): 31–51.
- Baillon, A., H. Bleichrodt, and V. Spinu. 2020. “Searching for the Reference Point.” Management Science 66 (1): 93–112. doi:10.1287/mnsc.2018.3224.
- Banerjee, A., S. Mullainathan, and A. V. Banerjee. 2010. The Shape of Temptation: Implications for the Economic Lives of the Poor. https://www.nber.org/papers/w15973.
- Bernal Salazar, R., M. Cadena Ordónez, A. Camacho González, J. Cárdenas Campo, L. Fergusson Talero, A. Ibáñez Londoño, C. Rodríguez Orgales y X. Peña Parga. 2014. Encuesta Longitudinal Colombiana de la Universidad de los Andes – ELCA 2013. Bogotá, Colombia: Universidad de los Andes, Facultad de Economía, CEDE.
- Bernard, T., and A. Taffesse. 2014. “Aspirations: An Approach to Measurement with Validation Using Ethiopian Data.” Journal fo African Economies 23 (2): 189–224. doi:10.1093/jae/ejt030.
- Besley, T. 2017. “Aspirations and the Political Economy of Inequality.” Oxford Economic Papers, 69 (1): 1–35. doi:10.1093/oep/gpw055.
- Bogliacino, F., and I. Gonzales-Gallo. 2015. “Aspirations, Prospect Theory and Entrepreneurship: Evidence from Colombia.” International Review of Economics 62: 271–290.
- Bogliacino, F., L. Jiménez Lozano, and D. Reyes. 2018. “Socioeconomic Stratification and Stereotyping: Lab-in-the-Field Evidence from Colombia.” Int Rev Econ 65: 77–118. doi:10.1007/s12232-017-0285-4.
- Bogliacino, F., and P. Ortoleva. 2015. The Behavior of Others as a Reference Point. Documentos de Trabajo – Escuela de EconomÃa 013611, Bogotá, Colombia: Universidad Nacional de Colombia -FCE – CID.
- Brown-Iannuzzi, J. L., K. B. Lundberg, A. C. Kay, and B. K. Payne. 2015. “Subjective Status Shapes Political Preferences.” Psychological Science 26 (1): 15–26. doi:10.1177/0956797614553947.
- Camerer, C., L. Babcock, G. Loewenstein, and R. Thaler. 1997. Labor supply of New York city cabdrivers: one day at a time*. https://www.cmu.edu/dietrich/sds/docs/loewenstein/NYCCabdrivers.pdf.
- Cunningham, S. 2021. Causal Indentification. The Mixtape. New Haven, Connenicut: Yale University Press.
- Dalton, P., S. Ghosal, and A. Mani. 2015. “Poverty and Aspirations Failure.” The Economic Journal 126 (590): 165–188. doi:10.1111/ecoj.12210.
- Desdoigts, A., and F. Moizeau1. 2005. “Community Membership Aspirations: The Link Between Inequality and Redistribution Revisited*.” Source: International Economic Review International Economic Review 46 (3): 973–1007. https://www.jstor.org/stable/3663501.
- Feres, J. C., X. Mancero, and R. Pizarro. 2001. “Enfoques para la medición de la pobreza. Breve revisión de la literatura.” Estudios estadísticos y prospectivos (Vol. 4). https://www.cepal.org/publicaciones/xml/8/14038/lc2024e.pdf.
- Ferrara, E. La. 2019. Aspirations, Social Norms, and Development. doi:10.1093/jeea/jvz057.
- Genicot, G., and D. Ray. 2017. “Aspirations and Inequality.” Econometrica 85 (2): 489–519. doi:10.3982/ecta13865.
- Ghosal, S., S. Jana, A. Mani, S. Mitra, and S. Roy. 2020. “Sex Workers, Stigma and Self-Image: Evidence from Kolkata Brothels.” Review of Economics and Statistics, 1–45. doi:10.1162/rest_a_01013.
- Gutiérrez Baquero, L. G. 2018. “Confianza y empoderamiento en comunidades del municipio de La Palma – Cundinamarca: Un estudio comparativo entre población restituida y no restituida.” Tesis de maestría, Universidad nacional de Colombia. https://repositorio.unal.edu.co/handle/unal/63679.
- Hoffmann, A., S. Henry, and N. Kalogeras. 2013. “Aspirations as Reference Points: An Experimental Investigation of Risk Behavior Over Time.” Theory and Decision 75 (2): 193–210. doi:10.1007/s11238-012-9323-6.
- Kearney, M. S., and P. B. Levine. 2014. “Income Inequality, Social Mobility, and the Decision to Drop Out of High School.” https://www.nber.org/papers/w20195.pdf.
- Kramer, B. 2016. “When Expectations Become Aspirations: Reference-Dependent Preferences and Liquidity Constraints.” Economic Theory 61: 685–721. doi:10.1007/s00199-015-0949-9.
- León Matta, D. F. 2019. “Efecto de las alianzas productivas sobre cantidad y diversificación del ingreso, y sobre la sostenibilidad de la deuda privada: un análisis para el caso de la palma de aceite.” Tesis de maestría, Universidad Nacional de Colombia. Archivo digital. https://repositorio.unal.edu.co/handle/unal/76490.
- Lim, S. S. 2018. “Aspirations of Migrants and Returns to Human Capital Investment.” Social Indicators Research 138 (1): 317–334. doi:10.1007/s11205-017-1649-6.
- Lucas Jr, R. E. 2004, May. “The Industrial Revolution: Past and Future.” Federal reserve bank. https://www.minneapolisfed.org/article/2004/the-industrial-revolution-past-and-future
- Lucas, R. J. 2004. “The Industrial Revolution: Past and Future. The Region.” Annual Report of the Federal Reserve of Minneapolis. https://www.minneapolisfed.org/article/2004/the-industrial-revolution-past-and-future.
- Maestri, V., F. Bogliacino, and W. Salverda. 2014. “Wealth Inequality and the Accumulation of Debt.” In Changing Inequalities in Rich Countries: Analytical and Comparative Perspectives, edited by Wiemer Salverda, Brian Nolan, Daniele Checchi, Ive Marx, Abigail McKnight, István György Tóth, and Herman van de Werfhorst. Oxford: Oxford Economic Press. 82–120
- Manstead, A. S. R. 2018. “The Psychology of Social Class: How Socioeconomic Status Impacts Thought, Feelings, and Behavior.” British Journal of Social Psychology 57 (2): 267–291. doi:10.1111/bjso.12251.
- Markle, A., G. Wu, R. White, and A. Sackett. 2018. “Goals as Reference Points in Marathon Running: A Novel Test of Reference Dependence.” Journal of Risk and Uncertainty 56 (1): 19–50. doi:10.1007/s11166-018-9271-9.
- O’Donoghue, T., and C. Sprenger. 2018. “Reference-Dependent Preferences.” In Handbook of Behavioral Economics: Applications and Foundations 1, edited by D. Bernheim, S. DellaVigna, and D. Laibson, 1–77. North-Holland. doi:10.1016/bs.hesbe.2018.07.003.
- Office for Policy Planning and Research. United States Department of Labor. 1965. The Moynihan Report. https://web.stanford.edu/~mrosenfe/Moynihan%27s%20The%20Negro%20Family.pdf.
- Ross, P. H. 2019. “Occupation Aspirations, Education Investment, and Cognitive Outcomes: Evidence from Indian Adolescents.” World Development 123: 104613. doi:10.1016/j.worlddev.2019.104613.
- Stiglitz, J. 2013. The Price of Inequality. New York: W. W. Norton & Company.
- Tversky, A., and D. Kahneman. 1991. “Loss Aversion in Riskless Choice: A Reference-Dependent Model.” Source: The Quarterly Journal of Economics, 106: 1039–1061. https://www.sscnet.ucla.edu/polisci/faculty/chwe/austen/tversky1991.pdf.
- Vargas, D. 2018. “‘Arando la paz, cultivando esperanzas’, Una evaluación de la política de zonas de reserva campesina (ZRC) como fórmula para el desarrollo rural y estrategia alternativa a la cuestión agraria no resuelta.” Tesis de maestria, Universidad Nacional de Colombia. Archivo digital. https://repositorio.unal.edu.co/handle/unal/68710.
- Weede, E. 1997. “Income Inequality, Democracy and Growth Reconsidered.” European Journal of Political Economy 13 (4): 751–764. doi:10.1016/S0176-2680(97)00028-1.
- Wilkinson, R., and K. Pickett. 2019. The Spirit Level: Why More Equal Societies Almost Always Do Better. London, England: Penguin.