?Mathematical formulae have been encoded as MathML and are displayed in this HTML version using MathJax in order to improve their display. Uncheck the box to turn MathJax off. This feature requires Javascript. Click on a formula to zoom.
ABSTRACT
Economic sustainability is particularly important in agriculture. It is related to the basic economic goal of farmers and the reason for their economic activities. Household-level adaptation and mitigation measures reflect the relative importance of economic goals for sustainability. Researchers collected data via a questionnaire designed to include household demographics, farm-specific variables, inputs, and outputs. The empirical model uses stochastic frontier and technical inefficiency models to analyze economic sustainability. Bered and Teleta were the two most economically sustainable and unsustainable regions. Differences in levels of economic sustainability have been attributed to characteristics that are expected to vary from household to household and from region to region. Output-oriented and input-oriented measures of inefficiency loss show that agriculture can be more economically sustainable as long as it is less efficient. Farmers could expand production with existing inputs, or they could reduce their inputs without lowering production levels. In addition, the return to scale was compared with the growth potential in each region. The political decision makers, therefore, seem to emphasize efforts to improve efficiency instead of investing in new technologies and inputs for the greater economic sustainability of the Koga Irrigation and Watershed Project.
1. Introduction
In the agricultural policy debates, the concept of sustainability has increasingly come to the fore in recent decades. Sustainability in agriculture is widely discussed and seen as essential for the transition to global sustainable development (Dung and Hiep Citation2018). Increased agricultural efficiency increases prosperity and sustainability not only for the rural population but also for the entire population. As a result, stakeholders are paying attention to the issues of monitoring and evaluating agricultural practices and questioning appropriate indicators to assess the sustainability aspects of certain practices (Latruffe etal. Citation2016).
Sustainable development, while highly desired, has become an oxymoron. The greatest dilemma facing humanity today is how to reduce poverty and inequality in the world without further transgressing planetary boundaries. The hegemonic system of production and consumption, whether capitalist or socialist, cannot be socially just and ecologically sustainable at the same time. Consequently, for different development models, it is difficult to simultaneously maintain and promote the three pillars of sustainability. In the face of these growing reconciliation difficulties, the vaunted three pillars of sustainability highlighted at the Rio+20 conference have become a trilemma. The constraints on progress in each of these pillars have become, in practice, the major trilemma of sustainability in the twenty-first century (Martine and Alves Citation2015).
Integrated economic, environmental, and social sustainability across all areas of policy is considered as right public policy. However, each of them is a complex, dynamic, self-organizing, and evolving entity in its own right, making the coupled system one of tremendous complexity. Since the days of Malthus, economists have tended to ignore the dilemma of resource depletion. The strategic importance of environmental and social sustainability activities is rarely adequately explained to decision makers. There is quite a lot of enthusiasm for more guidelines on economic sustainability. In agricultural sector, although equal importance is attached to the economic, social, and environmental objectives, support policy tends to be regarded as a necessary complement for economic viability. The importance of economic sustainability in terms of achieving total sustainability has been emphasized (Bayramoglu etal. Citation2018). Economic factors were identified as the most important criteria for sustainability, followed by environmental factors (Ceyhan Citation2010). Experts and farmers give more weight to economic goals, which are also more common in different studies (Ahtiainen etal. Citation2015). For farms, economic sustainability is particularly important as it is linked to the basic economic goal of farmers and the reason for their economic activities. It is also linked to farms' contribution to food security and overall economic growth. This is also evident in water sector. Most water policy measures are framed and discussed in economic terms (Stringer Citation2015). There is the realization of the importance of treating water as an economic good while providing a safety net for the poor (Donkor Citation2003). Therefore, due to the complexity of achieving the three pillars and the relative importance, our paper examines economic sustainability in its own right. In order for the overall system to be sustainable, economic sustainability has to maintain its ability to survive and develop.
At country level, in some planning documents, there is pro-development bias in the Accelerated and Sustained Development Plan to End Poverty (PASDEP) and the first Growth and Transformation Plan (GTP I) in Ethiopia, neither of which mention environmental protection as one of its pillars (Janka Citation2012). At the project level, the Ethiopian government is increasingly investing in the irrigation sector to take advantage of the country's agricultural production potential and achieve national food self-sufficiency (Ministry of Water Resource (MoWR) Citation2002). Cropping patterns and varieties in agricultural production in Gerai Irrigation Project in the regional state of Amhara were selected based on high yield, suitability to agroecology, farmers' experience, disease resistance, early maturity, etc. primarily to serve the purpose of meeting food requirements and source of income. The environmental and social pillars of sustainability were overlooked (Legesse Citation1997). In the Koga Irrigation and Watershed Project, there have been tremendous landscape and livelihood changes associated with the project (Eguavoen and Tesfai Citation2012). The Government justifies these changes with the alleged need for higher agricultural productivity in the country. The irrigation and watershed management components in the Project are to be treated as equally important in the planning documents (Marx Citation2011). In reality, however, mostly the management bodies are interested in the downstream area (Gebre, Getachew, and McCartney Citation2008). When it comes to analyzing which crops to grow each season, farmers make the final decision on the appropriate crop selection based on farming experience, seed availability, labor availability, environmental factors such as soil and climate conditions, government guidelines and availability for consumption. The most important factor influencing decision in the project is the relative profitability (Reynolds Citation2012). Relative profitability, in turn depends up on efficiency.
The economic sustainability indicators used in previous studies not only reflects different interpretations but also on the different purposes and the scope of these studies. The definition used for economic sustainability is essential to guide the selection of these indicators. The economic dimension considers the overall business viability and efficiency of an agricultural system. Contextually, economic sustainability is generally viewed as economic viability, whether a farming system can survive in the long term as during the professional life of a farmer, or across generations related to durability, i.e. the capacity of a farm to be transferred to a successor in a changing economic context. The approach of our paper on the selection of indicators is based on a review of indicators in two groups of literature review works as a benchmark. The first benchmark paper by Latruffe etal. (Citation2016) is suggested in Van Cauwenbergh etal. (Citation2007). The indicators of economic sustainability in the paper cover a relatively small number of themes mainly measured through economic viability in terms of profitability, liquidity, stability, and productivity (Latruffe etal. Citation2016). The measurement of economic sustainability usually does not go beyond such economic indicators (Van Cauwenbergh etal. Citation2007). The judgment on these indicators showed that the first three categories have often been used in the analysis of the financial statements, which is a pure accounting view that does not consider productivity and opportunity costs. While the second benchmark paper is a literature review by Spicka etal. (Citation2019). The literature review was based on 51 relevant studies that identified 6 indicators grouped into 4 components to provide an alternative way of measuring economic sustainability in agriculture. These components are economic viability, transferability, independence, and efficiency. The judgment on the relative relevance of each component shows that the first two problematic indicators are, while the efficiency that it includes or at least associated with autonomy.
Productivity and efficiencyFootnote1 analyzed at farm level have important implications for evaluating their economic viability and sustainability. Although both are cooperative concepts, efficiency measures are more precise than productivity measures in the sense that they imply a comparison with the most efficient frontier. Furthermore, efficiency is a relative concept, measured by comparing the actual ratio of outputs to inputs to the optimal ratio of outputs to inputs. The role of efficiency in increasing agricultural production has been widely recognized by researchers and decision makers worldwide (Bravo-Ureta etal. Citation2007). It is at the heart of agricultural production, as farmers can expand and maintain the scale of production through efficient use of resources (Udoh Citation2005; Ali Citation2007). The analysis of efficiency occupies a special place in economic theory and actually consists of resource management methods, since efficiency is essentially the most appropriate way of expressing the extent to which factors of production are available to a nation.
There is no a-priori reason for both technical and allocative types of efficiency to increase or decrease simultaneously nor their relative contribution should be of equal importance for output growth. It seems difficult to achieve substantial output growth gains at very high levels of technical or allocative efficiency (Karagiannis and Tzouvelekas Citation2001). The latter also takes into account how the intervention is distributed to benefit the community as a whole, which is generally accepted in welfare economics (Palmer and Torgerson Citation1999). When measuring efficiency, the focus is mainly the technical efficiency, achieving technical efficiency is perhaps the greatest concern (Tsionas and Kumbhakar Citation2006). Measuring the economic performance of a farm requires an understanding of production decisions and technical efficiency. Consequently, better economic performance is indicated by higher technical efficiency. A prerequisite for economic sustainability is a degree of high technical efficiency that ensures the economic viability and sustainability of the operations (Bouali Citation2013). The course of efficiency over time is used as an indicator of sustainability (Gomes etal. Citation2009).
It is generally based on a comprehensive literature search for efficiency and sustainability in general and economic sustainability, in particular, two forms of researches in the field of sustainability are identified. The first form of research uses technical efficiency as a general sustainability indicator. Papers under this category includes Hepelwa (Citation2013); Pourzand and Bakhshoodeh (Citation2014); De Koeijer etal. (Citation2002); Gomes etal. (Citation2009). The second form of research uses mostly income-related indicators to measure economic sustainability. Papers under this category includes ? (Deka and Goswami Citation2021); Bayramoglu etal. (Citation2018).
Although previous research in Ethiopia identified a stochastic frontier model that could be used to calculate technical efficiencies, applications developed from these findings were limited to generating technical efficiency indices. The use of efficiency in terms of economic sustainability is largely absent in the literature. So far, economic sustainability is not explicitly examined in the context of technical efficiency. Technical efficiency is a key toolkit to decoupling economic growth from environmental costs in terms of degradation while enhancing production and productivity. Improvement in technical efficiency enables not only economic growth and prosperity but also could save unnecessary wastage of resources that otherwise be used for the future generation. Improving technical efficiency can be understood from a broader perspective beyond economic gain like environmental sustainability. However, this unnecessary wastage of resources is emphasized in our paper in terms of resource availability for future production during the professional life of a farmer, or across generations related to the capacity of a farm to be transferred to a successor. In addition, the assessment of papers as a benchmark shows that technical efficiency got relative importance as a measure of economic sustainability relative to other indicators. For example, it was believed that if producers resorted to optimal resource use, income could be further increased (Deka and Goswami Citation2021).
Our approach offers a new indicator of economic sustainability. It is based on the idea embodied in the production of crops, which are the main livelihood of the population of the study area. As to our stock of knowledge, our paper is the first attempt to consider technical efficiency as a tool to develop an indicator of economic sustainability in agriculture. Therefore, the study examines the following inter-related issues (1) analyzing the economic sustainability of agriculture using measures of technical efficiency, (2) examining capacity utilization and inefficiency loss using various measures including input-oriented and output-oriented measures, (3) analyzes farmers' perceptions of production, conservation and technical efficiency and (4) also examines the adaptation and mitigation measures orientation at the household, community/cooperative and government levels to see whether the practices of the various groups converge or diverge.
2. Literature review
Recently, the field of agricultural sustainability has seen an explosion of indicators, which in turn has been a source of confusion for potential users (Riley Citation2001; Lebacq, Baret, and Stilmant Citation2013). Composite indicators and single indicators are the two general approaches that can be seen in the literature for developing economic sustainability indicators and measuring sustainability in general. The need for a composite index has been emphasized in the literature, but due to data aggregation, ideological and other issues, none of the currently available composite indices have found general acceptance (Dewan Citation2006). Composite indicators can also disguise serious deficiencies in some dimensions and make it difficult to identify appropriate corrective actions (Fisher et al. Citation2001). The use of separate individual indicators, on the other hand, offers the possibility of a detailed interpretation and analysis, which gives the reader a deeper understanding of sustainability.
From a long-term perspective, organic farming in India has proven to be an economically viable option for small tea farmers, based on the annual income of 1 hectare of tea cultivation over 10 years. After the organic conversion, the growers achieve a good and stable yield. The income from organic tea can rise even more if the producers rely on the optimal use of resources. To understand the economic sustainability of organic cultivation of Assam tea produced by small-scale growers, a cost–benefit analysis was further performed using the indicators of Net Present Value (NPV) and Benefit to Cost ratio (B/C ratio) (Deka and Goswami Citation2021).
Another study by Hepelwa (Citation2013) focuses on technical efficiency, defined as the ratio between the farmer's actual production and the optimal production used to measure sustainability. The Technical Efficiency Indicator (TEI) was constructed from socioeconomic and catchment-related variables to provide an indicator of the sustainability of both the natural resources that support people's livelihoods and people's well-being bridging, the knowledge gap on how to can achieve the mutual balance between human development and conservation goals in the field of natural resource management. Greater technical efficiency in crop production would allow households to harvest a large amount of agricultural produce per unit area. This could limit the proportion of agricultural land in the catchment area. Most farmers in the Sigi catchment in north-eastern Tanzania had a technical efficiency below 0.3, none of them had 0.9 or more. There was considerable scope to increase technical efficiency and thus the sustainability of the watershed's resources. This explains why farmers in the study area were constantly looking for more arable land, causing forest loss through clear-cutting, to establish new farms. The gist of this result is that conscious effort is required to improve technical efficiency. If the causes of inefficiency in crop production are addressed, a significant amount of forest could be saved.
In the study by Bayramoglu etal. (Citation2018), the level of sustainable income was used as a measure of economic sustainability in agricultural enterprises. Economic sustainability was defined in the study as the generation of an income by an agribusiness that covers people's livelihood, depreciation, and interest on the fixed capital used in production. Therefore, economic sustainability has been divided into three components, which take into account the income required to cover living expenses and the depreciation and interest costs for the enterprise. The income that provides economic sustainability has been termed ‘sustainable income’. If the sustainable income is greater than or equal to [Subsistence Expenses + Depreciation + Interest], the agribusiness is economically sustainable. If the sustainable revenue is less than [Subsistence Expenses + Depreciation + Interest], agribusiness is not economically sustainable. Enterprises that achieved this level of income level were classified as economically sustainable. One of the components of economic sustainability is that the revenue from the business supports the livelihoods of the people who depend on it. If the managers of the enterprise and their families earn a satisfactory income from the agricultural business they own, then this will ensure the continuity of the enterprise. The sustainability of enterprises that do not generate income that is satisfactory in terms of socioeconomic well-being is at risk. Therefore, the requirement to provide a livelihood for people dependent on agribusiness has been identified as a component of sustainability. Based on the results of the analysis, more than 150 enterprises in Turkey's Konya province were found to be unsustainable.
The study by Pourzand and Bakhshoodeh (Citation2014) in Iran classified regions into three groups: sustainable, relatively sustainable and unsustainable. There is a positive correlation between efficiency and sustainability. The technical efficiency estimate illustrates the possibilities for improving the environment by reducing these polluting inputs (Piot-Lepetit, Vermersch, and Weaver Citation1997). Farmers can simultaneously achieve economic and environmental goals by improving the technical efficiency of their use of polluting inputs (De Koeijer etal. Citation1999). The environmental performance is based solely on the environmental impact of polluting inputs while reducing the use of polluting inputs (technical efficiency) is a method to improve environmental performance (De Koeijer etal. Citation2002). Consequently, the emphasis on the effective use of inputs and the principles of sustainability must be a fundamental part of agricultural policy to incentivize and create a situation where sustainable resources can be conserved. The article by De Koeijer etal. (Citation2002) presents a conceptual framework for quantifying sustainability that is based on the efficiency theory commonly used in economics. Differences in efficiency between farmers were persistent within and between years. Reducing technical inefficiencies has always attracted interest for its economic benefits, but is now more important given the environmental case for reducing emissions and waste. The average technical efficiency of only 50 percent implies that there are significant opportunities to improve sustainability even without technological improvements and without trade-offs between the economy and the environment.
3. Methods
The Koga Irrigation and Watershed Project is an attempt by the Ethiopian government to develop a large-scale irrigation system for rural farmers. The Ethiopian government and the African Development Fund supported the project to irrigate 7004 hectares of land with the total size of the project covering an area of approximately 10,000 hectares (Endrie and Quraishi Citation2016). This study used a household survey for 12 regions of the Koga Irrigation and Watershed Project to determine the economic sustainability indicated by technical efficiency measures. A list of blocks or regions along with the irrigation potential (hectares) and the estimated 12,000 householdsFootnote2 in 12 command areas was considered to determine the appropriate sample size. The list of irrigation block summary data received from the project office in Merawi town is included in Appendix B. Reaching all 12 regions would have been challenging due to the greater distance (it ranges from 3 to 19.7 km) from the main dam. However, maximum effort was made to collect survey data from 384 households in 2017/18 using stratified random sampling technique by proportional allocation method based on irrigation potentials. As indicated in pie chart ,Footnote3 of the total potential 7004 hectares of irrigation land in the Koga irrigation and watershed project, the highest portion of the land approximately 864 hectares (12.3) is in the Tekledib block, while the lowest, some 290 hectares of land (4.2
) in Amarit. Therefore, based on the stratified random sampling technique by the proportional allocation method, the largest sample (24
) was drawn from two regions of Tekledib and Adbera, the two regions with the largest abundance of irrigation land in the study area. In fact, Amarit's lowest sample accounts for only 5.2
of the total sample size (Pie chart Footnote4). The 384 surveyed households used approximately 533.13 hectares or 7.6
of the total potential during the survey. The highest proportion of arable land in the sample is in the Tagelwedefit region, around 13.8
, and the lowest in the Enguti and Amarit regions (Pie chart Footnote5). Data were collected through a survey questionnaire designed to include household demographics, farm operational and farm-specific variables to fit into the model of technical inefficiency. On the other hand, output, income, and factors of production are based on the microeconomic theory of production for use in Translog's stochastic frontier model (). The analysis mainly followed the estimation of the technical efficiency and thus compares the economic sustainability of the Koga irrigation and watershed project. In addition, to understand the level of economic sustainability, inefficiency loss measures based on the input and output orientation were calculated. These measures include (1) cost (input) saving method adopted from Kibret, Singh, and Brar (Citation2016), (2) output loss measured as a proportion of potential output, (3) output growth potential, and (4) loss in METB.Footnote6
As the estimation technique, the basic stochastic frontier model, developed simultaneously by two research groups (Aigner, Lovell, and Schmidt Citation1977) in the first group and Meeusen and van Den Broeck (Citation1977), which assumes that the deviation from the frontier is due to the effect of technical inefficiency and random noise, was used. The true nature of production is stochastic, especially in agriculture. The choice of this technique is based on the variability of agricultural production resulting from climatic hazard, plant pathology, and insect pests on the one hand and management inefficiencies on the other.
(1)
(1) Based on Equation (Equation1
(1)
(1) ),
is the product produced in the ith plot/farmer,
is a vector of inputs used in the ith plot, and β is a vector of parameters to be estimated. Aigner, Lovell, and Schmidt (Citation1977) proposed stochastic models by assuming that the disturbance term has two components, that is
and
. The error component
represents the symmetric disturbance that captures random errors caused outside the firms' control such as measurement errors, random shock, and statistical noise. The
component of the error term is the asymmetric term that captures the technical inefficiency of the observations and is assumed to be independent of
, and also to satisfy that
≥ 0. The non-negative component (
) reflects that each firm's output must be located at or below its frontier. Therefore, the stochastic production frontier in a technically efficient plot would represent the maximum attainable output (
*) as Equation (Equation2
(2)
(2) ):
(2)
(2) This can be used to measure the technical efficiency of all other plots relative to this efficient plot. The technical efficiency of the plot (
) is given by Equation (Equation3
(3)
(3) ). Technical efficiency (
) can be defined as the production capacity of a producer i in relation to the maximum production of a plot using a given amount of inputs and available technology.
(3)
(3) Before estimating model parameters using the Maximum Likelihood Estimates (MLE) method, the stochastic frontier production function using the flexible Translog (TL) specification in Equation (Equation4
(4)
(4) ) was found to be more appropriate than Cobb–Douglas based on the log-likelihood ratio test.
(4)
(4) where ln are the natural logarithms, β's are the coefficients of the parameters to be estimated, and
is the total value of the output.
s are factors of production,
is the idiosyncratic error resulting from measurement errors in the use of input and/or output and
are the non-negative random variables used to measure an individual household's technical inefficiency. ln
ln
contain the squares and the interaction terms of the input variables. The estimate of the determinants of technical efficiencies, the inefficiency model, was estimated based on Equation (Equation5
(5)
(5) ) and the variables given in .
(5)
(5) where
s are various described operational and farm specific variables. Since the dependent variable in Equation (Equation5
(5)
(5) ) is defined as technical inefficiency, a farm-specific variable associated with the negative (positive) coefficient has a positive (negative) impact on technical efficiency. In view of several facts explained in the literature supporting a one-step estimation, the maximum likelihood estimates (MLE) of the parameters of the stochastic frontier production function and the inefficiency model were obtained simultaneously. The stochastic production frontier approach is also used to estimate capacity utilization. Capacity utilization (potential yield) was estimated by scaling up actual output by the efficiency score generated from this estimation process (i.e. by dividing the current production or the actual production by the efficiency score) by the following formula in Equation (Equation6
(6)
(6) ).
(6)
(6) In addition to the quantitative analysis, qualitative data were collected through questionnaires and informal interview methods to support the analysis. In the qualitative analysis, the data was used to reveal farmers' perceptions of current production, conservation, technical efficiency, and mitigation
adaptation measures at household, community/cooperative level
at government level.
4. Results and discussion
4.1. Translog stochastic frontier and inefficiency model results
Various production, farm, and household specific variables were used to estimate the production frontier and the inefficiency effects model.Footnote7 The maximum likelihood estimates of the Translog stochastic production frontier and the results of the inefficiency model are shown in and . Due to the presence of second-order coefficients (cross products of variables) in the function, the coefficients are not directly interpretable. Thus elasticities at the variable means (where and
are variable means ) are calculated using Equation (Equation7
(7)
(7) ) and are shown in .Footnote8
(7)
(7) Because soil conservation and manure are qualitative dummies, they need to be adjusted before being interpreted as the resulting percentage change in the value of output. If the independent variable is a qualitative dummy variable and the output is in logarithmic form, the elasticity of the output is calculated by taking the antilogarithm of the coefficient of the dummy variable and subtracting 1 from the result.Footnote9 The multiplication of the result by 100 gives us the percentage change of the output due to the change in the value of the dummy variable from 0 to 1. The adjusted elasticity of the output for these dummies (denoted by
) is given by Equation (Equation8
(8)
(8) )
(8)
(8) According to , farm output or revenue has the highest responsiveness to
, followed by Landsize at 5
level of significance. A 1
increase in the dominant factors of production which is
will lead to about 3.38
increase in revenue, ceteris paribus. Unlike farmers' high concern on shortage of water in the area, it statistically proved that value of output is less sensitive to changes in
. A 1
increase in
will only leads to 0.15
change in farm output value. Even though a significant proportion of households (about 56.5
) are applying manure, households with access to manure are producing 96.11
percent below the output value compared to their counterpart without access. This may be due to changes in the physical properties and the chemical properties of the soil, resulting in the acidity of the soil influencing the efficiency of nutrient usage. Whereas, by persuading households to conserve soil and water, output could increase by 44.30
. In the analysis of the technical inefficiency effects model, the positive coefficients of access to credit and the two types of land ownership (i.e. own and rented land) in the model reveal variables that increase the level of technical inefficiency of the farmer. Other statistically significant variables (household size, frequency of consultation visits, male household head, and non-farm income) have a negative impact on technical inefficiency. Households with larger families are more efficient, indicating the benefit of greater labor supply during the peak farming season. The influence of household size could be an indication of labour-intensive crop production. Due to the traditional production system in the region, the most labour-intensive and time-consuming harvesting and threshing operations are carried out using only human and animal power. The study also confirms the positive impact of advisory services on farmers' technical efficiency. Access to advisory services offers farmers enormous productivity and efficiency gains through the mechanisms of providing access to technical knowledge and new skills and as facilitating the introduction of new technologies. In rural Ethiopia in general and in the study area in particular, the advisory service is provided by Development Agents (DAs). These agents are typically trained agricultural professionals who act as a coordinators, communicators, educators, and translators; linking farm households to government, NGOs, credit institutions, and other related services (Belay and Abebaw Citation2004). Off-farm income (also known as non-farm income) by easing financial restrictions on the timely purchase of inputs such as labor, capital, and fertilizers helped improve technical efficiency. In contrast to the availability of off-farm income as an alternative to credit, access to credit has a positive impact on technical inefficiency. The money received in the form of loans was not used for productive activities. Farmers were reluctant to return it. Political instability and unrest in Ethiopia during this time may contribute to this effect. Regarding the gender of the household head, women head of households are technically less efficient than men. The share cropping agreement is very efficient compared to other types of land ownership agreements in the Koga watershed and irrigation project.
4.2. Technical efficiency as an indicator of economic sustainability
Stochastic frontier analysis can be applied to any problem where the observed outcome differs from the potential outcome. There is something called a potential minimum, maximum or optimal level that defines the frontier. In the context of production efficiency, the potential outcome is the maximum possible output that defines the frontier and the extent to which actual production falls below the frontier due to technical inefficiency measures the level of economic sustainability in this study. Thus the level of economic sustainability, as measured by the ability of an agricultural system to sustain itself in the future, is given by actual output as a proportion of the potential output that inputs and technology could produce (i.e. technical efficiency indices). The study brings an idea that (1) the distance between actual production and its frontier measures each region's performance in terms of economic sustainability. (2) The closer the technical efficiency index for a farmer or a region is to one, the more economically sustainable it is. (3) In other words, a region minimizes production losses and avoids wasting resources on production considered more economically sustainable.
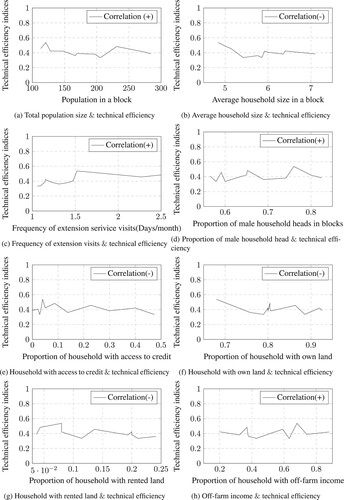
The technical efficiency indices of the 12 regions of the Koga Irrigation and Watershed Project in show the unbalanced regional level of economic sustainability. The average technical efficiency of farmers is 0.4061844 at project level (range 0.21077660–0.8448437 at household level). This implies that the overall level of economic sustainability in the Koga Irrigation and Watershed Project is low. They produced 40.6 of the potential output that could be produced at full efficiency. The equivalent of 59.4
of potential production was lost due to technical inefficiency, which could be due to farmer mismanagement rather than random fluctuations. The mean is taken as the separation between the most efficient and least efficient regions after sorting the data in descending order of efficiency. The first six regions in , i.e. Bered, Adebera, Enguti, Amarit, Kudmi, and Tekeldib regions are more efficient in the sense that they perform better than general average in terms of economic sustainability, while Lasi, Ambomesk, Andenet, Chihona, Tagelwedefit, and Teleta regions are the worst are efficient. Bered (i.e. closer to its production frontier) and the Teleta (farthest from its frontier) regions were the most economically sustainable and unsustainable blocks , respectively. The most economically sustainable farmer is found in Adebera (0.8448437) and the least in the Enguti region (0.2107766). Although the 12 regions are close together and face similar natural and market conditions, there are differences in economic sustainability. The differences can be attributed to farm and farmers characteristics, which are expected to vary from household to household and from region to region in the inefficiency effects model (). The plot analysis ((a,h)) in shows that the variation in economic sustainability is confirmed by the results of the inefficiency model. The trendlineFootnote10 for the plot analysis shows that all farm and household specific variables except household size ((b)) created this variation in the degree of economic sustainability.
4.3. Capacity utilization and inefficiency loss
Since technical inefficiency can also be considered with regard to the use of output and input, an attempt was made in this section to analyze inefficiency loss primarily using input-oriented and output-oriented measures.Footnote11 The central theme of this section is how much output could be increased given the input level or inputs saved given the current output. The perusal of analyzed capacity utilization and inefficiency loss as measured by four different but related concepts: (1) cost (inputs) savings, (2) production loss measured as a percentage of potential production, (3) production growth potential, and (4) loss in millions Ethiopian Birr (METB). These four measures of inefficiency loss were used to conduct a deeper analysis of the extent to which households or agricultural regions are falling behind capacity. Consequently, agribusiness can increase agricultural production by 59.38 (i.e. 1-TE) of its potential or 146.19
of current production or avoid the loss of METB 22.46 by applying the technology and techniques of the best practice with full efficiency farms. Alternatively, achieve current production levels by reducing inputs that could otherwise be reasonably saved for the farmer's working life or for transfer between generations to a successor. The importance of sustainable development for human society results from current and future resource management with the goals of economic growth and ensuring a better quality of life and the environment. Therefore, measures for effective use of resources are included in the theme of sustainable development, taking into account that each generation's resources are affected by the consumption of previous generations. Increasing resource efficiency with the aim of significantly reducing costs that are unsustainable or are supported by unsustainable measures. Reducing costs in areas of activity that have proven unsustainable would provide significant savings in a country's public resources. In essence, efficiency is the most appropriate way of expressing the degree to which a nation's available factors of production are capitalized. Given the complexity of estimating the input-oriented model, one could first estimate the output-oriented model and get estimates of an input-oriented inefficiency (if desired) from the relationship between them. Using an input-oriented approach according to Kibret, Singh, and Brar (Citation2016)Footnote12, farmers in the Koga irrigation and watershed project could reduce their inputs by an average of 59.38
if they could achieve optimal levels of economic sustainability or fully efficient counterparts [i.e. 1–(0.4061844/1.00)100] but still perform the same with the given technology.
Similarly, at the regional level, the most economically sustainable region can increase production by about 46.29 of potential or 86.21
of actual production or avoid a loss of METB 1.87 and alternatively reduce its inputs by 46.29
if it could achieve an optimal economic level of sustainability or fully efficient counterparts [i.e. 1–(0.5370046/1.00)100], but still producing the same level of output with the given technology.
For the economically second sustainable region, production can increase by about 51.67 of potential or 106.94
of actual production or avoid a loss of METB 2.48 and alternatively reduce its inputs by 51.67
if it could achieve an optimal economic level of sustainability or fully efficient counterparts [i.e. 1–(0.4832234/1.00)100], but still producing the same level of output with the given technology. On other hand, it takes 10.01
cost /input saving [i.e. 1–(0.4832234/0.5370046)100] to achieve the level of the most economically sustainable region. For the economically third sustainable region (Enguti), production can increase by about 54.35
of potential or 119.06
of actual production or avoid a loss of METB 1.24 and alternatively reduce its inputs by 54.35
if it could achieve an optimal economic level of sustainability or fully efficient counterparts [i.e. 1–(0.4564803/1.00) 100], but still producing the same level of output with the given technology. On other hand, it takes 14.99
cost /input saving [i.e. 1–(0.4564803/0.5370046)100] to achieve the level of the most economically sustainable region.
For the rest, production can increase in a range of 57.72 to 66.45
of its potential or 136.52
to 198.12
of actual production or avoid losses from METB 0.97 to 3.020 and alternatively they could reduce their inputs from 57.72
to 66.45
if they could achieve an optimal level of economic sustainability, but still produce the same level of output with the given technology. On other hand, it takes 21.26
to 37.53
cost /input saving to achieve the level of economic sustainability of Bered.
Similarly, in the least economically sustainable region, production can increase to about 66.53 of potential, or 198.78
of actual production, or avoid a loss of METB 1.46, and alternatively reduce its inputs by 66.53
, if it could achieve an optimal level of economic sustainability or efficient counterparts [i.e. 1–(0.3346901/1.00)100], but still producing the same level of output with the given technology. On other hand, it takes 37.67
cost /input saving [i.e. 1–(0 .3346901/0.5370046)100] to achieve the level of the most economically sustainable region.
Schultz's popular ‘poor but efficient hypothesis’ states that resource allocation in traditional agriculture is by and largely efficient. Contrary to this hypothesis, there is much to be gained by reallocating factors in the area. Farming could become more economically sustainable as long as farmers are less efficient and much far below from their respective frontiers. Furthermore, the value of returns to scale (RTS) is 1.74, which means that if farmers double all inputs, the output value will increase by 174. When we compare the returns to scale with growth potentials in 5th column, the growth potential results of about 198.78
in the Teleta region is higher than output to be gained when inputs double. This is another argument that corroborates as there appears to be increasing emphasis by policy makers on efforts aimed at improving the efficiency of less efficient farmers rather than investments in new technologies and inputs in the project. Under these circumstances, it doesn't pay more to invest in new technology and use more inputs in agriculture.
4.4. Qualitative analysis
In the total survey of 384 farmers, conducted using a questionnaire presented in , most (66.9) of the heads of household are men, whose average school year is 1.33 years. The average family size and household size is 6 members and 1.39 hectares respectively. The majority (56.5
) use manure, half of the respondents carry out off-farm activities as a source of income and only 15
have access to credit during the survey. Most farmers (81.8
) were doing farming business using only their own irrigated lands. Farmers from the adjacent Kebeles in the Koga Irrigation and Watershed Project support the project due to their expectation to engage in irrigation-based sharecropping arrangements and to benefit from the specialization and diversification that the project aims to achieve (3
were sharecroppers).
4.4.1. Farmers' perception of current production and conservation
Growing concerns about environmental degradation and the impact of climate change on agricultural activities are becoming more pronounced in sub-saharan Africa, particularly due to the urgent need to meet food, healthy diet, and economic needs (Festus, Alola, and Bekun Citation2020). The importance of current production (current standard of living) and conservation to future high production and conservation affects how farmers manage resources and engage in various conservation activities. The majority (71) (i.e. 54
agree
17
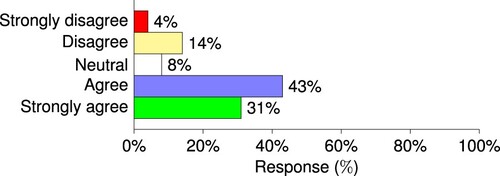
strongly agree) of farmers believe current production (current high standard of living) is more important, while this belief can force farmers to ignore the environment or the availability of resources for a future generation if resources are not used efficiently (). On the other hand, the perception of water and soil conservation as a threat to agricultural production and sustainable agriculture is the most important determinant of conservation efforts. Farmers' perceptions of the relevance of current soil and water conservation and future conservation practices were analyzed to understand the relative importance of pressure-oriented and state-oriented approaches to water management. The results show that current water management approaches are mainly reactive state/impact-based responses to address water issues (Song Citation2012). Whenever possible, preventive rather than corrective action is emphasized (African Development Fund (ADF) Citation2016) which is also confirmed by majority (74
, i.e. 43
agree and 31
strongly agree) who see the role of a proactive water-oriented approach and the derivation of pressure-oriented information systems (). Using a precautionary principle, the approach could lead to societal responses to protect the environment at a higher level through preventive decision-making. However, despite its promotion and importance, the adoption of soil and water conservation practices by farmers in the project area has been limited. Because of the canal system, farmers in the study area consider conservation is irrelevant. Therefore, the finding will be used to aid discussions on the necessity of facilitating soil and water conservation and the transition from a state or impacts-oriented to a pressure-oriented approach to water management.
Figure 1. Current production is more important than future high production.
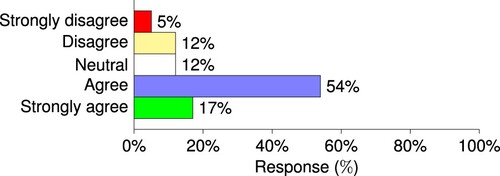
Figure 2. Current water and soil conservation is more important than future conservation.
4.4.2. Farmers' perception on technical efficiency in production
Technical efficiency may be related to farmers' environmental and risk attitudes, preferences for investment decisions, and socioeconomic characteristics, among others. The level of technical efficiency can be related to the farmer's perception of current production levels, the source of production loss, perception of efficiency improvement, and satisfaction with current farm performance. In contrast to the quantitative results of the maximum likelihood estimates, the majorities (45), 25
,
of respondents agree, disagree, strongly agree, and strongly disagree that their land is giving its potential respectively (). Farmers with smaller plots have a higher chance of maximizing production to the frontier in the study area, as shown in . The majority (67
) of farmers () in the survey believed that production loss was due to both natural causes and hazards such as climate change and inefficiency in management. This result is consistent with the stochastic model's assumptions about the two-component disturbance term, which captures random errors caused beyond the farmers' control, such as measurement error, random shock and statistical noise, and technical inefficiencies such as management inefficiency. However, the efficient use of resources can also minimize production losses. The majority of farmers (61
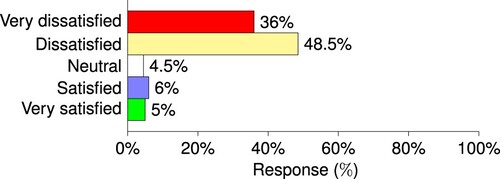
) in believe it is possible to improve efficiency without changing the amount of inputs and technology. Contrary to the farmers' perception of the current level of production in terms of technical efficiency, most farmers are not satisfied with their current agricultural production. This may be due to problems related to shortage of seeds, fertilizers, and irrigation water. Almost 48.5
and 36
farmers in are dissatisfied and are very dissatisfied with their production or performance.
Figure 3. A farmer is getting the maximum output from inputs and technology.
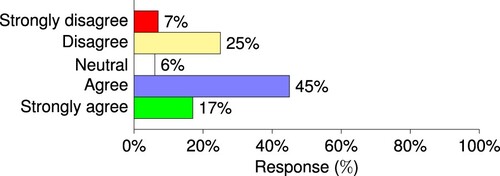
Figure 4. Farmers with smaller land have a higher possibility to produce at its maximum.
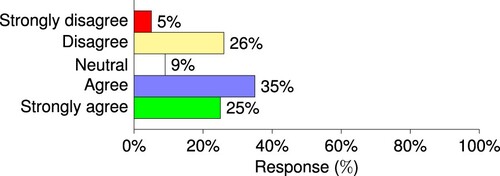
Figure 5. Farmers' perception related to sources of output loss in farming.
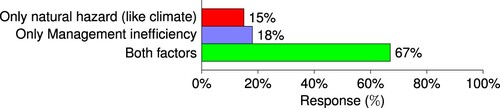
Figure 6. There can be technical efficiency improvement.
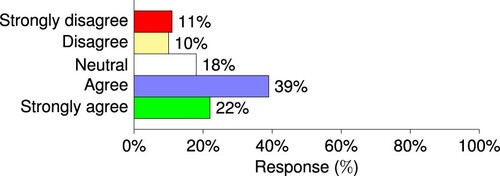
Figure 7. Satisfaction with current yield in farming.
4.4.3. Adaptation and mitigation measures
Agriculture is vital to the development of countries, especially developing countries where the economy and family livelihoods depend on food production and agricultural activities. Therefore, identifying preferred adaptation and mitigation actions is of great value. These preferences depend not only on farming activities, regions, and farmer characteristics (Orduno, Kallas, and Ornelas Citation2019), but could also be related to technical efficiency at farm level (Khanal etal. Citation2018). Efficiency can be positively or negatively influenced by farmers' decisions and preferences in adopting adaptation and mitigation measures (Mase, Gramig, and Prokopy Citation2017). However, the direction of mitigation and adaptation responses at the household, community/cooperative, and governmental level needs to be carefully examined to determine whether the practices of different groups are converging or diverging.
4.4.3.1 Adaptation and mitigation measures at household and community or cooperative level
One of the adaptation and mitigation measures at the household level is the influence and choice of farmers on cultivation patterns and crop selection. The Koga Irrigation Project Office in Merawi analyzes which crops to grow each season based on market prices and water consumption and provides farmers with a list of possible crops that can be grown. Farmers make the final decision on selecting appropriate crops based on growing experience, seed availability, labour availability, environmental factors such as soil and weather conditions, government policies and availability for consumption, but the most important factor influencing their decision is relative profitability (Reynolds Citation2012). According to the survey result, shows that out of the four main motives for crop selection identified for the analysis, the market/profit motive is considered as the main motive for crop selection for the majority (37.5) of farmers. However, to maintain a sustainable level of production, the farmer must have certain knowledge, including agroecological knowledge, to reconcile the technical aspect of production with soil conservation practices or environmental aspects of the production system, which can influence decision-making to balance economy and environment operational risk (Rola Citation1998). It should also include land resource management alongside the target market/profit motive to maintain the productive base of the farm over time. This is also supported by the result of the survey in the study area. The second largest (30
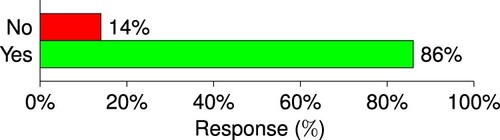
) factor in crop selection is environmental (soil and water) conditions (), and nearly 86
of farmers consider environmental impact when choosing their products (). A combination of guidelines from Project Office and farmer water efficiency training is expected to place more emphasis on efficient water use when making decisions about what crops to grow in the future (Reynolds Citation2012).
Figure 8. Farmers' perception related to primary motive for selecting crop type.
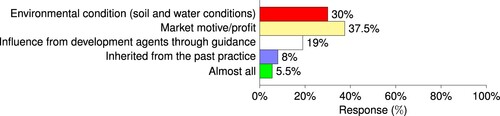
Figure 9. Environmental impact consideration while choosing what to produce.
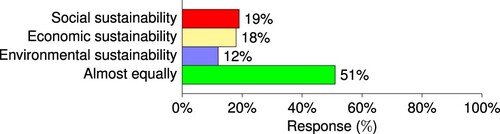
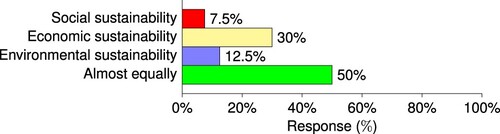
This section further conceptualizes the trade-offs in the pillars of sustainability as positive and negative consequences of choices. Reconciling economic growth, social welfare, and environmental sustainability is becoming increasingly problematic (Martine and Alves Citation2015). Attempts to achieve these goals simultaneously have several limitations in practice, sustainable economic growth is an oxymoron because it has an inverse relationship with environmental sustainability (Redclift Citation2005), and yet little is known about the nature and extent of the repeatedly asserted incompatibility between these known targets and particularly in low-income countries (Stern, Common, and Barbier Citation1996). The main focus of household-level adaptation and mitigation measures is primarily economic sustainability. In contrast less, attention is paid to environmental sustainability (). In addition, the majority (36) believe that economic sustainability is very important to overall sustainability. Because of their relative importance, they prefer to achieve economic sustainability over other pillars to achieve overall sustainability (). However, for a growing number of researchers and policy makers, sustainable development depends on direct attention being paid to environmental issues. In practice, the relative attention of farmers in the study area to environmental sustainability versus overall sustainability compared to economic sustainability is minimal. Only 12
of respondents choose environmental sustainability over other pillars to achieve overall sustainability (). However, at the community/cooperative level, the majority of farmers (51
) consider adaptation and mitigation measures to be more sustainable (). Farmers believe community-level adaptation and mitigation measures treated all three pillars equally. The relative emphasis on economic sustainability is less at the community and cooperative level than at the household level.
Figure 10. Adaptation and mitigation measures orientation at the household level.
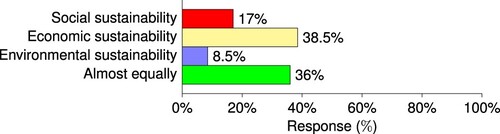
Figure 11. Relative importance of pillar for overall sustainability.
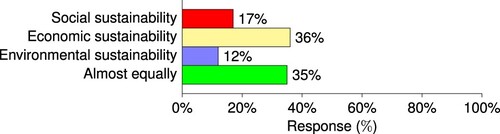
Figure 12. Adaptation and mitigation measures orientation at community/cooperatives level.
4.4.3.2 Adaptation and mitigation measures at government level
It is important that the diverse and often conflicting goals of all stakeholders are properly considered. At the heart of sustainable development is a great trade-off between those who prioritize the environment, those who prioritize social development, and those who prioritize economic development. In it we find competing interest groups that have negotiated a viable compromise (Machingura and Lally Citation2017). In fact, the state is responsible for socially just and environmentally friendly development activities, which is also confirmed by the majority (50) of farmers in the survey. While the physical and technical aspects of the project received adequate attention, minimal attention was paid to the social and environmental aspects. Even if the social complexity of such a project requires that social components are considered as much or even more than technical aspects during project planning, the survey results show that sustainability is given the least attention (). The same government actors also believe that the watershed management component of the project is not being fully and adequately implemented. There was no institutional responsibility for environmental management activities. An indicator of the insufficient attention given to it is the allocation of resources far below what is required to implement effective conservation work. Soil and water conservation come at no cost through community participation (Gebre, Getachew, and McCartney Citation2008). Although an overlap of views among stakeholders based on the belief that the project ultimately benefits local communities is evident, serious misjudgments were made in setting priorities related to environmental sustainability.
Figure 13. Adaptation and mitigation measures orientation at the government level.
The values, needs, and interests of people and different stakeholder groups diverge. This divergence exists even between government agencies in relation to watershed management. There are government agencies such as the Amhara Region Environmental Protection, Land Use, and Administration Authority, Bureau of Agriculture and Rural Development and the Cooperative Development Agency that argue that siltation poses a serious threat to the project's success. Therefore, they insist on drawing attention to the immediate dangers of not taking adequate and effective watershed management measures. In contrast, the Amhara Region Water Resources Office and the Koga Watershed and Irrigation Management Office in Bahir Dar are not overly concerned. They believe that the irrigation project is safe due to the location of the dam and reservoir structures in swampy grassland plains and the flow of the Koga River on gentle slopes. These factors, together with the dam's ability to remove sediment, reduce the likelihood of significant sedimentation in the reservoir (Gebre, Getachew, and McCartney Citation2008). Sometimes there is also a conflict of interest between upstream and downstream farmers. The project aims to mobilize and motivate farmers in upstream localities to engage in large-scale watershed management activities so that downstream farming communities in the project's command area can practice irrigated agriculture. Upstream watershed residents view the project with suspicion, arguing that the watershed management activities they propose would only benefit the downstream communities in the irrigated area, not themselves. Consequently, they are reluctant to participate in the environmental protection program.
4.4.3.3 Farmers' perception towards overall sustainability
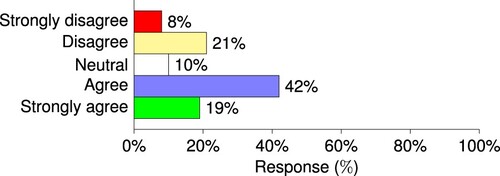
After addressing the alignment of mitigation and adaptation actions at different levels, farmers were asked whether current management activities at project level balance the social, environmental and economic pillars of sustainability. According to , the overall assessment of project-level mitigation and adaptation measures shows that community/cooperative and state-level measures outperform household-level sustainability measures. Overall, 42 and 19
of respondents agreed and strongly agreed that current project-level management activities seek to balance the social, environmental, and economic pillars of sustainability. Despite the great divergence of interests between measures at household and community/cooperative level/government, the same stakeholders have broadly overlapping views. Therefore, it is now widely recognized that training and awareness raising should be strengthened as one of the project components to provide these groups with the appropriate tools to ensure that the interests of the various stakeholders in relation to sustainability largely overlap in the project area.
Figure 14. Current management activities balance social, environment, and economic pillars of sustainability.
5. Conclusion and policy implication
Production elasticities in the translog production function of the maximum likelihood estimates of the Translog stochastic frontier model showed that production is strongly responsive to agrochemicals per hectare while being less sensitive to changes in water use per hectare. The level of economic sustainability of the regions of the Koga Irrigation and Watershed Project , measured by the extent of observed output deviates from the potential output called frontier varies in the regions. The most sustainable region is Bered while teleta is at the most insisting on another end. The overall mean technical efficiency score in the region is low, further dividing the 12 regions into more efficient/more sustainable and less efficient/sustainable regions. Although the 12 regions are close together and face similar natural and market conditions, there are differences in economic sustainability that stem from differences in farm and household characteristics that are expected to vary from household to household and region to region. On average, at the project level, a typical farm can increase agricultural production by 59.38 of its potential, or 146.19
of current production, or avoid the loss of METB 22.46 by applying the technology and techniques required for best practices be used with “full efficiency” farms. Alternatively, they could save inputs by 59.38
if they could achieve an optimal level of economic sustainability but still produce the same level of output with the given technology. In general, contrary to the ‘poor but efficient hypothesis’, farmers in Koga Irrigation and Watershed are inefficient. Potential growth rates of how much production could be expanded compared to returns to scale and cost savings outcomes under input orientation confirm that there is much to be gained from economic sustainability as long as farmers are less efficient and far below their respective frontiers. From a government perspective, therefore, policymakers appear to be increasingly emphasizing efforts to improve the efficiency of less efficient farmers, rather than investing in new technologies and inputs to ensure higher levels of economic sustainability. In these circumstances, activities to increase efficiency are worth more than investing in new technologies and using more inputs in agriculture. The qualitative analysis shows that economic sustainability is very important for overall sustainability. In fact, they also take environmental conditions into account when choosing crops. However, the interests of different groups largely do not converge or overlap, particularly in watershed management. Therefore, it is now widely recognized that the capacity building component needs to be strengthened as one of the three components of the project: irrigation, conservation, and capacity building. Capacity building activities could ensure that the interests of different stakeholders related to sustainability largely overlap, emphasizing the importance of proactive conservation measures and an efficient use of resources in the project area.
Data deposition
Data sharing is not applicable for this article, for no data set were generated.
Acknowledgments
The authors would like to thank founding sources (Addis Ababa University and Aksum University), local village administrators and students, data collectors, development agents and the farmers that facilitate and provide the data.
Disclosure statement
No potential conflict of interest was reported by the authors.
Additional information
Funding
Notes
1 According to Page (Citation1980), Murillo-Zamorano (Citation1980), and Shih etal. (Citation2004), technical efficiency is defined as producing the maximum possible amount of output using a given set of inputs or producing a given level of output using minimum possible combinations of inputs. Equivalently technical efficiency index measures the ratio of maximum potential output to actual production.
2 The unit of analysis is at Household level.
3 Color should be used in print.
4 Color should be used in print.
5 Color should be used in print.
6 Millions of Ethiopian Birr.
7 Some variables that proved to be statistically insignificant were ignored and eliminated during the regression process for both stochastic production frontier and technical inefficiency effect models.
8 Following the specifications under different equation in Chiona, Kalinda, and Tembo (Citation2014) ‘Stochastic Frontier Analysis of the Technical Efficiency of Smallholder Maize Farmers in Central Province, Zambia, Journal of Agricultural Science; Vol. 6, No. 10; 2014’, partial elasticity and return to scale in this study at 5 significance level are given and computed.
9 Following Halvorsen and Palmquist (Citation1980), ‘The Interpretation of Dummy Variables in Semi logarithmic Equations. American Economic Review, 70, Issue 3, Pages 474–475’.
10 Trend line based on a microsoft excel scatter plot with a smooth line including the trend line. The correlation between variables depends on whether the scatter plot slants down/up from left to right.
11 A production plan is technically inefficient if a higher level of output is technically attainable for the given inputs (output-oriented measure), or that the observed output level can be produced using fewer inputs (input-oriented measure).
12 The computation is based on Kibret, Singh, and Brar (Citation2016) ‘Measurement of Technical Efficiency of Resettled Farm Households in Western Ethiopia’ IOSR Journal of Economics and Finance (IOSR-JEF) e-ISSN: 2321–5933, p-ISSN: 2321–5925.
13 Dear farmers!
This questionnaire is designed to collect relevant data on the “Technical efficiency indicator for economic sustainability in Koga irrigation & watershed project, Ethiopia.” The researcher guarantees that your personal data and your answer will not be disclosed to third parties. The data will be used for academic research purposes and remain confidential. I look forward to your reply.
References
- African Development Fund (ADF). 2016. “Koga Irrigation and Watershed Management Project Appraisal Report.” Country Department Ocde East Region, ETH/PAAI/2001/01.
- Ahtiainen Heini, Eija Pouta, Eero Liski, Sami Myyrä, and Aino Assmuth. 2015. “Importance of Economic, Social, and Environmental Objectives of Agriculture for Stakeholders – A Meta-analysis.” Agroecology and Sustainable Food Systems 39 (9): 1047–1068.
- Aigner D., C. K. Lovell, and P. Schmidt. 1977. “Formulation and Estimation of Stochastic Frontier Production Function Models.” Journal of Econometrics 6 (1): 21–37.
- Ali Mubarik. 2007. “Quantifying the Socio-economic Determinants of Sustainable Crop Production: An Application to Wheat Cultivation in the Tarai of Nepal.” Agricultural Economics 14 (1): 45–60.
- Bayramoglu Z., C. Oguz, Z. Karakayaci, and H. Arısoy. 2018. “Identification of the Income Level Needed for Agricultural Enterprises to Achieve Economic Sustainability.” Economic Research 31 (1): 510–520.
- Belay K., and D. Abebaw. 2004. “Challenges Facing Agricultural Extension Agents: A Case Study From South-western Ethiopia.” African Development Review 16 (1): 139–168.
- Bouali Gusmi. 2013. “The productive efficiency in agriculture: recent methodological advances.” The Polytechnic University of Catalonia.
- Bravo-Ureta B. E., D. Solis, V. H. M. Lopez, J. F. Maripani, A. Thiam, and T. Rivas. 2007. “Technical Efficiency in Farming: a Meta-regression Analysis.” Journal of Productivity Analysis 27 (1): 57–72.
- Ceyhan V. 2010. “Assessing the Agricultural Sustainability of Conventional Farming Systems in Samsun Province of Turkey.” African Journal of Agricultural Research 5 (13): 1572–1583.
- Chiona S., T. Kalinda, and G. Tembo. 2014. “Stochastic Frontier Analysis of the Technical Efficiency of Smallholder Maize Farmers in the Central Province, Zambia.” Journal of Agricultural Science 6 (10): 108.
- De Koeijer T., G. Wossink, M. Van Ittersum, P. Struik, and J. Renkema. 1999. “A Conceptual Model for Analysing Input–output Coefficients in Arable Farming Systems: From Diagnosis Towards Design.” Agricultural Systems 61 (1): 33–44.
- De Koeijer T., G. Wossink, P. Struik, and J. Renkema. 2002. “Measuring Agricultural Sustainability in Terms of Efficiency: the Case of Dutch Sugar Beet Growers.” Journal of Environmental Management66 (1): 9–17.
- Deka N., and K. Goswami. 2021. “Economic Sustainability of Organic Cultivation of Assam Tea Produced by Small-scale Growers.” Sustainable Production and Consumption 26 (1): 111–125.
- Dewan H. 2006. “Sustainability Index: An Economics Perspective.” In 40th Annual Meeting of the CEA, 26–28.
- Donkor Stephen M. K. 2003. “Development Challenges of Water Resource Management in Africa.” African Water Journal 1–19.
- Dung Luu Tien, and Nguyen Thi Kim Hiep. 2018. “Challenges and Opportunities for Sustainable Agriculture Development of Vietnam in the Fourth Industrial Revolution.” Industrial Revolution 4.0.
- Eguavoen I., and W. Tesfai. 2012. “Social Impact and Impoverishment Risks of the Koga Irrigation Scheme, Blue Nile Basin, Ethiopia.” Afrika Focus 25 (1): 39–60.
- Endrie B., and P Quraishi. 2016. “Performance Evaluation of Irrigation Management Practice at Ambomesk Irrigation Unit in Koga Irrigation Scheme, Ethiopia.” Ph.D. Thesis, Haramaya University.
- Festus Fatai Adedoyin, Andrew Adewale Alola, and Festus Victor Bekun. 2020. “The Nexus of Environmental Sustainability and Agro-economic Performance of Sub-Saharan African Countries.” Heliyon 6 (9): e04878.
- Fisher W. S., L. E. Jackson, G. W. Suter, and P. Bertram. 2001. “Indicators for Human and Ecological Risk Assessment: a US Environmental Protection Agency Perspective. Human and Ecological Risk Assessment.” An International Journal 7 (5): 961–970.
- Gebre A., D. Getachew, and M McCartney. 2008. Stakeholder Analysis of the Koga Irrigation and Watershed Management Project. Technical Report.
- Gomes E., G. e Souza, J. S. de Mello, L. Angulo Meza, and J. Mangabeira. 2009. “Efficiency and Sustainability Assessment for a Group of Farmers in the Brazilian Amazon.” Annals of Operations Research 169 (1): 167–181.
- Halvorsen R., and R. Palmquist. 1980. “The Interpretation of Dummy Variables in Semilogarithmic Equations.” American Economic Review 70 (3): 474–475.
- Hepelwa A. 2013. “Technical Efficiency As a Sustainability Indicator in Continuum of Integrated Natural Resources Management.” Resources and Environment 3 (6): 194–203.
- Janka D. G. 2012. “Environmental Impact Assessment in Ethiopia: Laws and Practices.” PhD Thesis, University of Alabama Libraries.
- Karagiannis Giannis, and Vangelis Tzouvelekas. 2001. “Self-dual Stochastic Production Frontiers and Decomposition of Output Growth: the Case of Olive-growing Farms in Greece.” Agricultural and Resource Economics Review 30: 168–178.
- Khanal U., C. Wilson, B. Lee, and V.-N. Hoang. 2018. “Do Climate Change Adaptation Practices Improve Technical Efficiency of Smallholder Farmers? Evidence From Nepal.” Climatic Change 147: 507–521.
- Kibret S. A., S. Singh, and J. Brar. 2016. “Measurement of Technical Efficiency of Resettled Farm Households in Western Ethiopia.” Journal of Economics and Finance 7 (6): 54–62.
- Latruffe L., A. Diazabakana, C. Bockstaller, Y. Desjeux, J. Finn, E. Kelly, M. Ryan, and S. Uthes. 2016. “Measurement of Sustainability in Agriculture: a Review of Indicators.” Studies in Agricultural Economics 118 (3): 123–130.
- Lebacq T., P. V. Baret, and D. Stilmant. 2013. “Sustainability Indicators for Livestock Farming. A Review.” Agronomy for Sustainable Development 33 (2): 311–327.
- Legesse Wubeshet. 1997. “Agronomic Report on Gerai Irrigation Project.” Commission for Sustainable Agriculture and Environmental Rehabilitation in Amhara Region (CO-SAERAR).
- Machingura Fortunate, and Steven Lally. 2017. The Sustainable Development Goals and Their Trade-offs, Development Progress. Case Study Report.
- Martine G., and J. E. D Alves. 2015. “Economy, Society and Environment in the 21st Century: Three Pillars or Trilemma of Sustainability?.” Revista Brasileira de Estudos de População Rio de Janeiro 32 (3): 433–459.
- Marx S. 2011. “The Political Ecology of Irrigation Management in the Blue Nile basin. Impacts of Global Environmental Policies on Local Adaptation in the Koga Irrigation Project, Ethiopia.” Cultural and Social Anthropology, University of Cologne, Germany.
- Mase A. S., B. M. Gramig, and L. S. Prokopy. 2017. “Climate Change Beliefs, Risk Perceptions, and Adaptation Behavior Among Midwestern US Crop Farmers.” Climate Risk Management 15 (4): 8–17.
- Meeusen W., and J. van Den Broeck. 1977. “FEfficiency Estimation From Cobb-douglas Production Functions with Composed Error.” International Economic Review 18 (2): 435–444.
- Ministry of Water Resource (MoWR). 2002. Water Sector Development Program 2002–2012. Main Report Volume I, Ministry of Water Resources, Addis Ababa, Ethiopia.
- Murillo-Zamorano Luis R. 1980. “Economic Efficiency and Frontier Techniques.” Journal of Economic Surveys 18 (1): 33–77.
- Orduno M., Z. Kallas, and S. Ornelas. 2019. “Analysis of Farmers' Stated Risk Using Lotteries and Their Perceptions of Climate Change in the Northwest of Mexico.” Agronomy 9 (4): 4.
- Page John M. 1980. “Technical Efficiency and Economic Performance: Some Evidence From Ghana.” European Journal of Sustainable Development 32 (2): 319–339.
- Palmer S., and D. J. Torgerson. 1999. “Definitions of Efficiency.[Internet].” DIO 10: 1136.
- Piot-Lepetit I., D. Vermersch, and R. D. Weaver. 1997. “Agriculture's Environmental Externalities: DEA Evidence for French Agriculture.” Applied Economics 29 (3): 331–338.
- Pourzand F., and M. Bakhshoodeh. 2014. “Technical Efficiency and Agricultural Sustainability – Technology Gap of Maize Producers in Fars Province of Iran.” Environment, Development and Sustainability 16 (3): 671–688.
- Redclift M. 2005. “Sustainable Development (1987–2005): An Oxymoron Comes of Age.” Sustainable Development 13 (4): 212–227.
- Reynolds B. 2012. “Variability and Change in Koga Reservoir Volume, Blue Nile Basin, Ethiopia”.
- Riley J. 2001. “The Indicator Explosion: Local Needs and International Challenges.” Agriculture, Ecosystems and Environment 2 (87): 119–120.
- Rola A. C. 1998. “The Economics of Knowledge Intensive Technologies: The Case of Integrated Pest Management in Iloilo, Philippines.” University of the Philippines.
- Shih Jhih-Shyang, Winston Harrington, William A. Pizer, and Kenneth Gillingham. 2004. “Economies of Scale and Technical Efficiency in Community Water Systems.” Discussion Paper, 04–15.
- Song Xingqiang. 2012. “A Pressure-Oriented Approach to Water Management.” Doctoral Thesis. Royal Institute of Technology (KTH).
- Spicka Jindrich, Tomas Hlavsa, Katerina Soukupova, and Marie Stolbova. 2019. “Approaches to Estimation the Farm-level Economic Viability and Sustainability in Agriculture: A Literature Review.” Agricultural Economics-Czech 65 (6): 289–297.
- Stern D. I., M. S. Common, and E. B. Barbier. 1996. “Economic Growth and Environmental Degradation: the Environmental Kuznets Curve and Sustainable Development.” World Development24 (7): 1151–1160.
- Stringer Randy. 2015. The Environment, Economics and Water Policies, Technical Report.
- Tsionas Efthymios, and Subal Kumbhakar. 2006. “Estimation of Technical and Allocative Inefficiencies in a Cost System: An Exact Maximum Likelihood Approach”.
- Udoh Edet Joshua. 2005. “Technical Inefficiency in Vegetable Farms of Humid Region: An Analysis of Dry Season Farming by Urban Women in South-South Zone, Nigeria.” Journal of Agriculture and Social Sciences 1 (2): 80–85.
- Van Cauwenbergh Nora, K. Biala, Charles Bielders, V. Brouckaert, L. Franchois, V. Garcia Cidad, and Martin Hermy, etal. 2007. “SAFE–A Hierarchical Framework for Assessing the Sustainability of Agricultural Systems.” Agriculture, Ecosystems
Environment 120 (24): 229–242.
Appendices
Appendix 1. Survey questionnaire
The purpose of the study is to examine technical efficiency as a measure of economic sustainability and farmers' perceptions of current production, conservation, efficiency, and adaptation and mitigation measures at household, cooperative, and government levels. Therefore, this questionnaire is designed to collect information from farmers in the Koga irrigation and watershed project to determine the most sustainable and non-sustainable regions. The study benefits farms striving to produce as much as possible by identifying where the levels of technical inefficiency lie and helping improve levels of economic sustainability. The questionnaire has four sections. The first section tries to identify the area of each household using a block name and encode it among the twelve irrigation regions. The second section will help collect household demographics, farm-specific and operational data to fit into a technical inefficiency model. The third section is designed to collect output, income, and factors of production based on microeconomic output theory for use in Translog's stochastic frontier model for analysis. The fourth section aims to collect data on perceptions related to production, conservation, efficiency, and adaptation and mitigation measures. The informed consent is given below.Footnote13
Table A1. Section 1: Area identification.
Table A2. Section 2A: Technical inefficiency model variables – Household [HH] demographics.
Table A3. Section 2B: Technical inefficiency model variables – operational and farm specific variable.
Table A4. Section 3A: Trans-log stochastic frontier model variables-output.
Table A5. Section 3B: Trans-log stochastic frontier model variables-crop type and factors of production.
Table A6. Section 3C: Trans-log stochastic frontier model variables-factors of production.
Table A7. Section 4: Perception of sample households related to production, conservation, efficiency and adaption mitigation measures.
Appendix 2. Summarized data on Koga Irrigation and Watershed blocks
The project established 12 primary irrigation cooperatives depending on secondary canals. These cooperatives established Koga irrigation users marketing cooperative union limited. The total area of the irrigated plot of land in the 2017 budget year was 5343 ha. Cultivated crops include potato, wheat, onion, maize, tomato, green piper, cabbage, carrot, barley, bean, etc.
Table A8. General information about Koga Irrigation and Watershed Project.
Table A9. Contract KDIP implemented activities in Upper and Lower catchments.
Table A10. Summarized data of irrigation blocks.
Table A11. Trans-Log stochastic frontier inefficiency model variables.
Table A12. Trans-log stochastic frontier model results.
Table A13. Output elasticities and returns to scale.
Table A14. Technical inefficiency model results.
Table A15. Level of economic sustainability indicated by technical efficiency indices.
Table A16. Capacity utilization, and inefficiency loss measures.
Table A17. Socio-economic characteristics of farmers.
Figure A1. Proportion of irrigation land in each block.
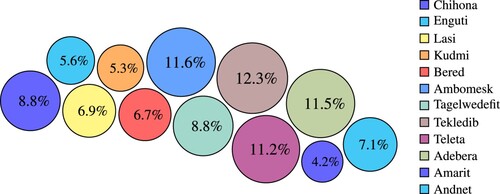
Figure A2. Proportion of sample size in each block.
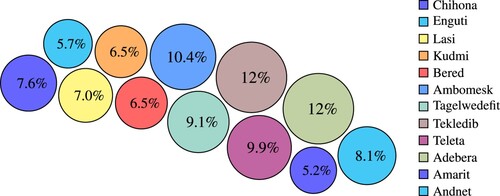
Figure A3. Proportion of sample land size in each block.
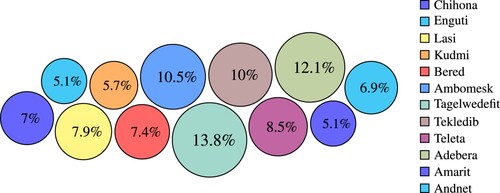
Figure A4. Plot analysis of farm, household specific variables and technical efficiency: (a) total population size and technical efficiency; (b) average household size and technical efficiency; (c) frequency of extension visits and technical efficiency; (d) proportion of male household head and technical efficiency; (e) household with access to credit and technical efficiency; (f) household with own land and technical efficiency; (g) household with rented land and technical efficiency; and (h) off-farm income and technical efficiency.