
ABSTRACT
This paper assesses whether industrial growth in Cambodia, Laos and Vietnam has been inclusive. While inclusiveness of growth is both a highly debated topic in the development discourse and an official government ambition in all three countries, it has not been assessed systematically in this context. In this paper, we focus specifically on one aspect of inclusiveness by examining the wage inequality between five occupational levels in the manufacturing sector. Based on survey data of companies operating in the electronics, food and beverage, and garment sectors, we show that average wage levels have increased for all occupational levels (although at different rates). We observe a U-shaped wage growth distribution, and argue that this could be a result of automation, dependency on foreign buyers, or an oversupply of pre-employment training programs at the technician level. We further observe particularly high wage growth for lower occupational levels in Cambodia and Laos – indicating relatively inclusive wage growth. In Vietnam, however, there is a development towards more wage inequality. Lastly, our study finds a clear convergence effect in the manufacturing sector; here, improved market information or increased labor mobility and reallocation of (training) resources could be contributing factors.
KEYWORDS:
1. Introduction
Cambodia, Laos, and Vietnam have all experienced high GDP growth rates over the last two to three decades. Formerly closed economies and comparatively poor countries, each of them has made much progress in catching up with the rest of the ASEAN (Association of Southeast Asian Nations) region. It remains an open question, however, whether this growth has been inclusive, in the sense that low-income earners have benefited (absolute inclusive growth), possibly even more so than high-income earners (relative inclusive growth).
This study looks at wage growth and wage inequality in the electronics, food and beverage (F&B), and garment industries. To assess inclusiveness, we measure how wages have changed for different occupational levels, and whether higher tier levels have benefited more, or less, than lower tier levels from the overall growth dynamic. We have collected data on employees as well as on companies. This allows us to observe wage dynamics both within and between industries. Causal inference remains difficult, given that the data cover two points in time only – 2012 and 2017 – and are limited to just over 200 companies in the formal part of the economy. Nevertheless, in the absence of more comprehensive data sets, we believe descriptive results (as presented in this paper) can make important contributions to the discussion. And while acknowledging that wage inequality in the formal part of the manufacturing industry does not tell the entire story of inclusive growth in the three countries, we argue that it is a relevant part of the narrative. Looking back, manufacturing has been an important contributor to (inclusive) wage growth. Looking forward, the transition to a more formal economy is desired by all three countries; the wage dynamic in the selected three industries might provide an early indication of what might be observed in other industries, as the economies develop.
The results are noteworthy from both a policy and a research point of view. They show that, on average, workers at the lowest and highest tier occupational levels (general workers and higher management, respectively) experienced high wage increases over the five-year time span from 2012 to 2017, while middle tier (operator, supervisor, and technician) wages grew less quickly, or not at all. In terms of relative inclusive growth, companies in Laos decreased the spread between the wage levels of higher and lower tiers, while those in Vietnam increased wage inequality, on average. In Cambodia, both trends can be observed, albeit at modest levels. The results also show a convergence tendency within all five occupational levels: if employees earned below market average in 2012, these salaries then increased faster than the average wage level.
2. Concepts and literature
In the development context, income inequality is discussed in two strands of academic and policy literature. The seemingly dominant strand, in terms of output, discusses inclusive growth. While there seems to be agreement in academia, applied research and the policy discourse of development partners that inclusive growth refers to growth that improves the situation of the poor, the details of the definition have been heavily debated in all circles (ADB Citation2011; African Development Bank Citation2016; Anand, Mishra, and Peiris Citation2013; Biswas Citation2016; Klasen Citation2010; Ngepah Citation2017; Ranieri and Ramos Citation2013; Zhuang and Ali Citation2010). In their review of 15 articles on inclusive growth, Ranieri and Ramos (Citation2013, 7) found that a wide range of elements were discussed, including poverty, empowerment, opportunity and social protection, gender inequality, access to infrastructure, and good governance.Footnote1
The second strand of literature relevant to this study discusses wage-setting and wage differences. There is a rich body of research in Cambodia, Laos, and especially Vietnam looking at wage differences, primarily studying the wage gaps between women and men (for instance, Siliphong and Phoumphon Citation2019 for Laos, Cheng et al. Citation2019 for Cambodia, Hong Vo et al. 2017 for Vietnam). Other studies have examined the wage gaps between migrants and non-migrants (intra- or inter-country, e.g. Liu Citation2019 for Vietnam), between different types of company ownership – such as foreign, state-owned and local-private enterprises (Nguyen and Ramstetter Citation2019 for Vietnam) – and finally between the formal and non-formal economy (Nguyen-Huu Citation2021 for Cambodia, Nguyen Citation2013 for Vietnam).
There is comparatively little discussion on wage inequality as a whole, however, and a distinction between the absolute and relative component of wage inequality – a perspective which is important to the discussion of inclusive growth – is missing. We believe, therefore, that the research presented here is relevant to both strands of literature. While acknowledging that the story of inclusive growth we explore is very specific – namely, that of workers in the formal part of the economy – and other stories are ignored (such as the differences between the formal and informal sectors, migrants and non-migrants, and the various regions within the countries), we do think that the results help us to understand one important facet of inclusive growth in these countries.
2.1. What fosters inclusive (wage) growth?
A string of IMF and World Bank papers looks at a metric which combines economic growth performance and income distribution. Anand, Mishra, and Peiris (Citation2013) find that lower initial incomes lead to more subsequent inclusive growth, as do more education, openness of the economy in terms of trade and foreign direct investment, stable macroeconomic conditions such as the absence of high inflation and GDP volatility, and good infrastructure. These factors reduce the cost of doing business which, as the study suggests, benefits low wage workers disproportionately.
Other studies have found positive effects of public spending beyond education, particularly in regards to health and social safety nets (Anand, Tulin, and Kumar Citation2014; Balakrishnan, Steinberg, and Syed Citation2013). This is at odds with an earlier observation by Dollar and Kraay (Citation2002), who reported a positive correlation between a lean government, growth and a larger income share of the poorest fifth of the population. The role of government reforms to boost wage incomes (Balakrishnan, Steinberg, and Syed Citation2013), reduce unemployment and increase productivity (Aoyagi and Ganelli Citation2015), and strengthen labor-intensive manufacturing (Pham Citation2015), has been another topic of inquiry. All three studies conclude that such reforms would support inclusive growth.
Discussing global dependencies and technology, Anand, Mishra, and Peiris (Citation2013, 4) refer to several studies that have ‘associated the rising inequality with technological change, financial deepening, and certain aspects of globalization.’ The authors found in their own assessment that technological change had little impact. However, they report that the sophistication level of services and goods exported had a positive effect on inclusive growth: ‘Moving up the value chain in both goods and services exports […] helps foster inclusive growth’ (Anand, Mishra, and Peiris Citation2013, 16).
In the body of academic literature concerned with wage inequalities and wage-setting, studies have discussed returns to education and how these returns have changed over time (di Gropello and Sakellariou Citation2010). Unregulated labor markets, an absence of minimum wage levels and low unionization rates can all lead to larger gender wage gaps (Matteazzi, Pailhé, and Solaz Citation2017) which, given the lower average income of women, are in turn likely to lead to more inequality. Bargaining power both in and outside of unions seems to have an impact on the relation between profits and wages (Bell, Bukowski, and Machin Citation2019).
2.2. Definition as used in this paper
While acknowledging the multi-dimensionality of inclusive growth, this paper focuses on one specific aspect, namely wage distributions (and changes thereto). We explore the following three concepts:
Absolute inclusive wage growth: Wages in lower tier occupational levels have increased.
Relative inclusive wage growth: Wages in lower tier occupational levels have increased more than in higher tier levels (reduction in vertical wage inequality).
Convergence: Within occupational levels, wages have increased more for those who initially earned below market average than for those who earned above it (reduction in horizontal wage inequality).
3. Development of wage growth and wage inequality in the region
The achievement of inclusive growth is an official government ambition in all three countries: Laos and Cambodia explicitly refer to inclusive growth in their respective development plans (Government of Lao PDR's 8th Five-Year National Socio-Economic Development Plan 2016–2020 and Cambodian Industrial Development Policy 2015–2025). Vietnam implicitly refers to inclusive growth, by linking its most recent Five-Year Socio-Economic Development Plan 2016–2020 to the SDGs.
Looking at wages in the three countries, one observes some stark increases: The average monthly wage in Cambodia increased from 119 USD in 2012 to 186 USD in 2017.Footnote2 While wages in Laos are significantly lower in absolute terms, they have seen a steady growth as well (from 89 USD to 118 USD). Vietnam has the highest wage levels of the three countries; while they have also risen significantly (from 168 USD in 2012 to 200 USD in 2018), the increase has not been quite as steep as in its neighboring countries.
One driving factor of wage increases could be the presence of national minimum wage policies. In Vietnam, the minimum wage has increased from 73 USD (2012) to 108 USD (2017). Minimum wages have grown more quickly than average salaries, and stood at 54% of average salary in 2017. Laos has also increased its minimum wage, from 73 USD a month in 2012, to 89 USD in 2017. Average salaries lie just 30% above the minimum wage. In Cambodia, only the textile, apparel and footwear industry has a minimum wage, which rose from 61 USD (2012) to 129 USD (2017).Footnote3 Shrestha (Citation2018) concludes that increasing the minimum wage in Cambodia's garment industry has only had a modest impact on the average wage level (an increase of 3%). For Vietnam, Nguyen (Citation2013) has not found a statistically significant effect of the minimum wage on wage levels, while Hansen, Rand, and Torm (Citation2016) show there is an effect only on the lower tail of the wage distribution.
It should be stressed that the figures above all refer to the formal economy. This is of particular relevance, given that the informal sector encompasses vast portions of the labor market: The ILO estimates that 81% of all workers in Cambodia (2019), 81% in Laos (2017), and 58% in Vietnam (2019) are employed in the informal sector.Footnote4 In the informal economy wages are likely to be lower, yet how much depends on the context: Nguyen, Nordman, and Roubaud (Citation2013) and Nguyen-Huu (Citation2021) have pointed out that depending on job status and position in the earning distribution wage, workers might earn more in the informal part of the economies of Vietnam and Cambodia, respectively. At the same time, it is important to bear in mind that there are large differences between sub-sectors, both in terms of (in)formality and what informality looks like. In the three manufacturing industries examined here, comparatively large companies and exports play an important role. It is likely that these three industries are characterized by a much higher degree of formality than other industries and sectors.
The three selected industries play an important role in the national economic policies of Cambodia, Laos and Vietnam, and already contribute significantly to GDP and employment (note: in Laos, only the garment and F&B industries were examined for this study, as the electronics industry is very small). The focus on manufacturing industries rests on the observation that, historically, the production of industry and consumer goods often constituted the backbone of growth for national economies, and in turn contributed to the improvement of the average standard of living (Attiah Citation2019). In other words, these are industries which have driven (inclusive wage) growth in the past.
4. Data
As part of the research project “Skills for Industry”, co-financed by the Swiss Agency for Development and Cooperation as well as the Swiss National Science Foundation as part of their “Swiss Programme for Research on Global Issues for Development” (r4d program), a company survey was implemented in six countries. In this paper, we focus on the three Southeast Asian countries. We briefly summarize the most important features of the data collection process.
The data collection units were ‘establishments’, defined as physical locations where industrial operations take place. A company may be comprised of one or more establishments. To qualify for the survey, an establishment must have had its own management and control over its workforce. Additionally, it must have been operational between 2012 and 2017. The survey was conducted only once, in Q3/Q4 2018. Both 2012 and 2017 figures were reported based on company documentation.
The survey focused on hiring and training practices, changes in production processes, company growth, as well as employment and wage trends. To this end, it was decided to focus on companies with a minimum size of 50 employees. In Laos, this criterion was initially adhered to, but later, companies with a staff size between 25 and 50 were also included, in order to reach a similar number of companies as in the other countries.
Given the size criterion and the employed sampling procedures, all companies are likely to be part of the formal sector. Yet even formally registered businesses may under- or over-report wage levels to align with what they communicate to local authorities, or due to social desirability. There are no reasons to assume that such under- or overreporting systematically increased or decreased between 2012 and 2017.
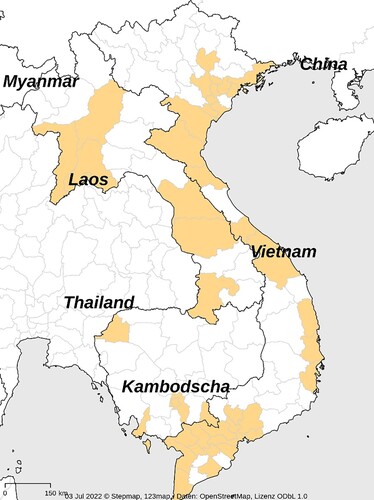
For each of the industries and countries, a company list was compiled, from which either all companies were contacted, or a random sample was drawn. The lists were compiled from official company registration lists, industry association member lists, and ad hoc research. We attempted a representative geographical distribution, mirroring the concentration of manufacturing in certain provinces and areas. In Cambodia, companies were surveyed in the Phnom Penh, Preah Sihanouk, Banteay Meanchey, Kandal, and Svay Rieng provinces. In Laos, Champasak, Khammuane, Luang Prabang, Savannakhet, Xayabury, Vientiane and Vientiane Province were covered. In Vietnam, the surveyed companies were based in the coastal region of Southern, Central, and Northern Vietnam, where most of the manufacturing companies are located (see ).
Figure 1. Provinces in Cambodia, Laos, and Vietnam where data collection took place.
Most interviewees were managers or heads of human resources. All in all, 361 companies were interviewed in the three countries, but for the following analysis, we work with the data from the 236 companies who provided detailed figures.Footnote5 These 236 companies should be broadly representative for companies in the formal part of the three industries. The sample size is not large, but sufficient to describe the most important patterns.Footnote6
Hiring and training strategies as well as wages and employment numbers were gathered separately for five occupational levels. These levels were based on the ILO International Standard Classification of Occupations (ISCO).Footnote7 All wage figures were inflation-adjusted with a 2012 base line, and converted into US dollars using the exchange rate from 31 December 2018.
The companies were partly interviewed by the authors themselves, and partly by their project teams in Cambodia, Laos, and Vietnam (see acknowledgements). Quality and standardization was ensured: firstly, by co-developing the questionnaire, piloting the questionnaire in each country and training team members involved in data collection; secondly, by the fact that generally two persons took part in each interview; and thirdly, by monitoring data quality throughout the collection process.Footnote8
5. Results
5.1. Descriptive statistics
The five occupational levels differ distinctly with respect to average wages (see ). Among the first four levels, the wage steps are relatively similar (between 20% and 36% additional income per step, depending on the level and year). Between technicians and higher management, the step increases to 58% (2012) or even 100% (2017).
Table 1. Wage and employment growth, 2012–2017.
Looking at wage growth, almost all occupational levels benefited from higher wages (inflation-adjusted). Growth was particularly large in the lowest (general worker) and highest (management) tiers; their growth rates translate into annualized growth of 3.4% and 4.8%, respectively. The middle tier wages grew much more slowly, particularly for supervisors (1.8%), or not at all for technicians (0%).
Employment-wise, the dominant group is operators. In most companies, there are few supervisors, technicians, and managers; all three levels together make up less than 10% of the workforce of the average company. This skewed distribution has only become more pronounced since 2012, with all growth happening on the general worker and operator levels. It is not surprising that the number of higher management positions has not changed much: there are only a set number of jobs for high level executives, no matter the size of the company. It is interesting, however, that in the average company, there has not been any growth in technician positions.
The aggregated median values smooth over large industry and country differences: median general worker wages, for instance, vary between 122 USD a month (F&B and garment in Laos) and 198 USD per month (garment in Cambodia). Differences can be observed within a country but also within industries (between countries). Given that purchase power is very similar in all three countries, the differences between wage levels do mirror income differences in real terms.
The median wages in the eight national industries for 2017 are summarized in . In Vietnam, the observed monthly wage level for general workers in the F&B industry (161 USD) is closest to the estimated compound minimum wage of USD 108, while general workers in the other two industries enjoy slightly higher wages (USD 176 in the garment and USD 179 in the electronics industry). In Cambodia, with its minimum wage of USD 129, the garment industry pays barely higher wages (198 USD) than the other two industries, which do not have a minimum wage agreement. Still, on average, all three industries easily clear the minimum wage level. This contrasts with the situation in Laos, where median salaries in both F&B and garment (122 USD) remain close to the level set by minimum wage policies (89 USD, set in 2015).
Figure 2. Median wage 2017, by occupational level. Source: Own survey. Logarithmic wage levels. Grey area: Minimum wage level in 2017.
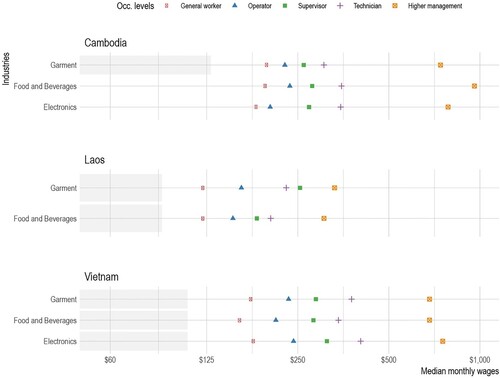
There is more occupational specialization in the middle categories – operators, supervisors and technicians – which could lead to higher earning differences between industries. This seems only to be the case with supervisors in the garment factories in Laos, who earn considerably more than their counterparts in the F&B industry. The other differences between industries are more subtle for these levels.
Looking at the growth rates (), incomes have increased in almost all industries and countries, for all occupational levels. A single exception is technicians in the Vietnamese F&B industry. Again, vast differences can be observed between the eight national industries, in terms of growth rates and spread between occupational levels.
Figure 3. Median wage growth, by occupational level.
Source: Own survey. Note: F&B in Laos shows the same median growth for four of the five occupational levels. Seemingly, companies applied the same rule for wage increases across almost all occupational levels.
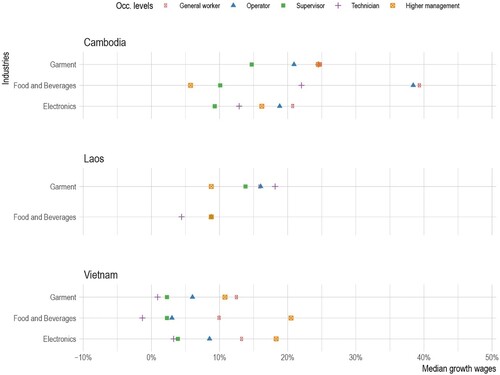
In Vietnam, minimum wages grew by almost 50% between 2012 and 2017, from 73 USD to 108 USD, while wages in the three industries grew with rates of up to 20% – depending on the occupational level. In the manufacturing sector, the minimum wage seems to have caught up to wage levels, rather than pushing them up. In Cambodia, the general workers gained most over the five-year period. This is true for the garment industry, which has a minimum wage, but also for the other two industries. Again, the minimum wage does not appear to be a driving factor, yet it is conceivable that the increase in wages in the garment industry had a signaling effect on the other industries. In Laos, minimum wage levels grew by about 20% between 2012 and 2017 – considerably more than the wage levels of general workers in the three industries. As in Vietnam, this seems to indicate that minimum wage levels have caught up with industry realities.
Higher management has enjoyed considerable wage growth, at least in Cambodia and Vietnam. This is in line with a world-wide trend (Mueller, Ouimet, and Simintzi Citation2017). Additionally, higher management positions in large companies, which operate in foreign markets and have large FDI, might be difficult to fill with locally trained employees. Such positions seem to be regularly filled by foreigners who would likely receive a salary aligned with international market rates. It is possible that this dynamic plays out more in Vietnam and Cambodia than in Laos, given the specific industry characteristics. However, the differences could also reflect the size of the companies, as well as different role requirements and contracts, including performance-pay sensitivity.
Contrary to the high growth rates in the lowest and highest occupational levels, salaries for the mid-level occupations have grown somewhat more slowly. This is particularly visible in Vietnam, where technicians had almost no pay increase at all. There are several possible explanations. The U-shaped wage growth distribution could be the result of an increasing polarization between occupation levels, as discussed by Acemoglu and Autor (Citation2011). They suggest that routine tasks are found predominantly in the middle of the skills spectrum. These tasks lend themselves to automatization, while labor-intensive manual or abstract tasks at the respective ends of the skills spectrum are harder to automate. With fewer routine tasks available, the corresponding employment and wage levels would fall.
Another reason could be that export-oriented businesses within the three industries remain focused on very limited sections of the value chain, which narrows down the importance of technicians and the available tasks, for instance in research and development. Eckhardt, Demombynes, and Chandrasekharan Behr (Citation2016, 43–44) state that in Vietnam, ‘most ICT hardware is manufactured based on foreign designs and specifications, making the industry deeply dependent on imported components, and leading to low [value addition] from domestic firms’. Similarly, in the garment industry, many ‘firms are trapped in low-productivity, low-value production mostly in the cut-make-and-trim market using imported raw materials. A crucial consequence has been that buyers provide all product and engineering specifications, as well as production equipment’. Nolintha and Jajri (Citation2016) found that foreign companies invest little in human capital or R&D in the garment industry in Laos, possibly leading to a similar outcome.
Additional possible explanations are that the number of graduates surpasses the available jobs in Vietnam (labor surplus), not least due to the comparatively high share of the population having completed university-level education (UNESCO Citation2020), or that the skills covered in such courses are not those sought by the labor market (which would explain why managers also reported a skills shortage for those levels).
To further assess relative inclusive wage growth, we constructed ratios between the average wages of occupational levels. summarizes these ratios: (1) comparing the income between the highest and the lowest occupational levels, (2) comparing the income between the highest and the two lowest levels (reflecting that these two lower levels might sometimes be related, see section 4), and (3) comparing the two highest levels with the two lowest ones. The wider the occupational gap reflected in the ratio, the bigger the wage difference.
Table 2. Relative wage growth, 2012–2017.
These descriptive comparisons show that no matter what ratio is used, on average the higher occupational levels saw a higher wage increase than the lower ones in the five-year timespan. It is debatable as to whether the change observed is large, particularly for metrics 1 and 3. For these two ratios, only just over 50% of companies saw an increase, while the others did not change or decreased their ratios.
Looking at the differences between countries and industries, there are some interesting variations (). The largest ratios are observable in Cambodia, the smallest in Laos. One explanation could be that in Laos, companies are smaller, but the differences could also reflect cultural or regulatory reasons, as explained above.
Figure 4. Wage ratios 2017.
Source: Own survey.
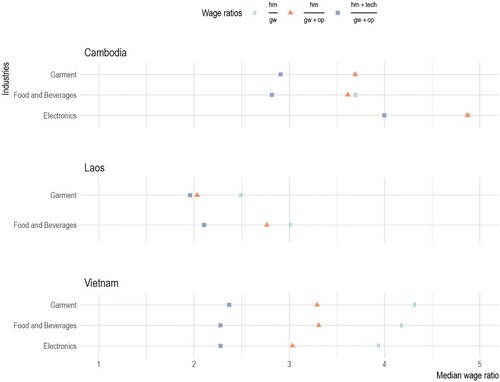
Within each country, the three ratios do not differ much between industries, which is by itself an unexpected observation, yet reflects the findings illustrated by above. Again, country differences dominate industry differences by far.
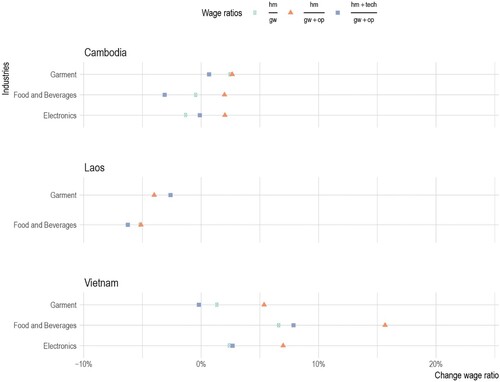
Looking at the changes (), it is striking that, in Laos, wage inequality has decreased in both industries, no matter what ratio is being used. In Vietnam, the opposite is true: Industries have increased wage inequality, albeit at quite different rates. In the F&B industry, wage inequality has increased the most. In Cambodia, finally, there has been no clear tendency in the F&B and electronics industries. Garment has seen some modest increase in wage inequality, despite being the only industry in Cambodia with a minimum wage.
Figure 5. Change wage ratios 2012–2017.
Source: Own survey.
As a third dimension of inclusive wage growth, we look at convergence within the occupational levels: have the companies that paid low wages at certain levels increased them more than companies offering relatively high payment? To assess such an effect, and plot companies’ wages in 2012 and compare them to the subsequent wage growth rates between 2012 and 2017; the first set of graphs shows country differences, while the second set focuses on differences between industries.
Figure 6. Wage growth and initial wage distribution for all countries.
Source: Own survey.
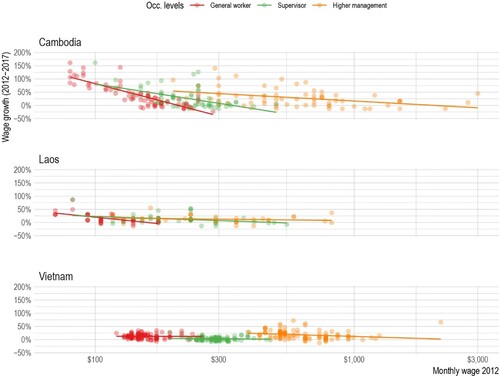
Figure 7. Wage growth and initial wage distribution for all industries.
Source: Own survey.
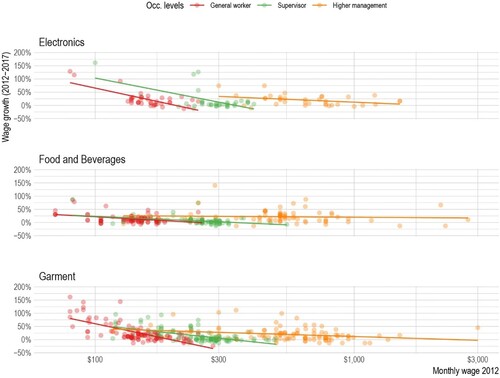
A convergence effect is indeed visible in Cambodia, as well as in the electronics and garment industries: wages tended to return to the mean if a company systematically under- or overpaid its workers in 2012. While differences in productivity or (un)desirable features of jobs were likely persistent, convergence effects could have arisen due to a lack of labor market information, or short-term skills shortages. The absence of such convergence effects could reflect that there was more market information to begin with or that the market was large enough to compensate regional skills shortages, which would explain the smaller spread of wages and absence of convergence in Vietnam, for example. It also seems plausible that mobility was less common and labor market information less accessible to general workers and operators than higher tier occupation levels, thus leading to a stronger convergence effect. Wage differentials could also reflect differences in productivity or (un)desirable features of the jobs. This component of the wage differences was likely persistent.
In some cases, occupational levels were clearly separated from each other (particularly in Vietnam), while in other cases, there was much intermixture. This could mean that there was a clearer signaling effect of occupational levels in Vietnam compared to the other two countries. Another explanation is that the occupational levels were more pronounced and hence homogenous in Vietnam. It should be noted that in individual companies, occupational levels are often more clearly demarcated.
5.2. Regression
To test for factors explaining wage growth, a multivariate regression was run. The dataset was re-structured so that the five occupational levels, rather than the companies, were the units of observation. The features included in the regression are informed by the research literature discussed in chapter 2. They cover occupation levels, original wage levels, degree of skills shortages, training of employees, export-orientation of the companies as well as growth and different types of transformation.
The coefficients in the regression results () show that the occupational levels play a dominant role. As already observed in the descriptive figures, general workers and higher management have seen the highest increases in their respective salaries. The regression results also confirm the observation that lower starting salary levels result in higher growth rates. These coefficients are not only statistically significant (for most levels), but also quite large: Companies which paid their general workers below the median value for general workers in 2012 subsequentially had a wage growth rate for this occupational level which was ca. 23% higher than the wage growth rate in companies that paid a premium in 2012 (see model 4, coefficient ‘General Worker (low)’). The lower the occupational level, the higher this convergence effect.
Table 3. Regression: explaining wage increase.
The skills shortage, as observed and assessed by the companies themselves, has no significant effect across all occupational levels. This is an interesting result, because one could have expected that a shortage would have driven wages up. But of course, the data only allows for a limited understanding of the wage-setting dynamics. It is possible that some of the shortage is a recent phenomon and has not affected five-year wage growth, or that companies with low wage levels have more skills shortages (reversed causality).
In model 3, we have also added variables capturing vocational skills development (VSD): The first variable indicates the number of VSD programs that workers of a company have undergone.Footnote9 A second variable indicates the relevance of VSD for addressing skills shortages (as perceived by the companies). Neither of the two variables yielded a statistically significant coefficient. There is therefore no evidence from this survey that there is a skills premium or that companies which invest in their workers also pay them better.Footnote10
Company-level variables were added in model 4. Sales growth has a positive effect on wages. Although the effect is not very strong, it is statistically significant and therefore points to a relatively stable pattern that growing companies pay better wages. This could be seen as a form of profit-sharing with employees (see section 2). Another explanation is that employees are in a much better implicit or explicit negotiation position when companies are growing, not least because contracts need to be fulfilled.
Companies with a high export orientation have lower wage growth, although this effect is only really visible – and statistically significant – if the regression is run exclusively for general workers and operators. This can be interpreted as exporting companies keeping a tighter control on wages, but only for the lower occupational levels. The coefficient for foreign ownership was not statistically significant. Interestingly, all types of transformation have a positive effect, but only the one indicating changing technology is significant.
In model 5, the same variables as before are used as covariants but only observations for general workers and operators are considered, to see if the explanatory variables have similar or different effects on the wage growth for these lower tier levels. The coefficients seem largely similar (same signs, and roughly comparable size). This means that what increases (or decreases) wage levels overall also does so for the income of the lower occupational levels (see similar observations by Dollar and Kraay (Citation2002)). There are a few notable exceptions. Specifically, the coefficient for exports is only statistically significant when the regression is focused on general workers and operators. The coefficient for transformation in technology on the other hand is only statistically significant in the overall model.
Overall, the regression models explain a sizeable portion of wage growth, but it should be noted that the models contain dummies for countries (large, statistically significant coefficients), industries and size of the company (small, not statistically significant coefficients) which inflate the proportion of variance explained (R2-squared).
5.3. Additional regression models
Because of the skewed distribution of wage change, instead of using wage change in its original form as a dependent variable, the models were also run with its logarithmic value. While having a better fit, these models can only deal with growth, hence about 20% of the observations with no change or negative change are lost. Noteworthy differences are that the convergence effect is particularly strong for supervisors in this scenario, even exceeding the coefficient for general workers. While, in the standard model, change in technology had a positive and statistically significant effect on wages, in the model with log-wage growth the coefficient is negative and insignificant. Instead, changes in products and organization have a positive and statistically significant effect. Of course, it is possible that in a company with growth (covered in the log-model) other factors are more important than in companies overall (covered in the standard model).
6. Conclusion
Our study assessed the wage facet of inclusive growth in Cambodia, Laos, and Vietnam, with a dataset from a recently conducted company survey. We focused on wage dynamics in the electronics, food and beverage (F&B), and garment industries, and distinguished three different notions of inclusive wage growth (absolute, relative and convergence of wage levels). Our dataset covers 236 companies in the formal part of the economy. While it is comparatively rich in detail and contains features of both the companies and employees (occupation levels), it should be noted that the analysis is primarily descriptive in nature, and does not allow for causal inference. Given the general absence of detailed data in this research area, we believe the results can nonetheless add to the discussion of inclusive wage growth in Southeast Asia. Similarly, while the focus on the formal part of the economy means only certain elements of inclusivity can be discussed, we believe that these are important elements.
The results show that in the period from 2012 to 2017, average wage levels increased for all occupational levels. 88% of companies increased wages for general workers, and 83% raised operators’ wages. Thus, the results confirm that there was absolute inclusive wage growth in all countries and industries assessed. The highest wage growth rates can be observed for higher management and general workers, while the middle tier of occupational levels had the smallest increase in salaries. In terms of employment, there was a considerable expansion for workers and operators, but little or no employment growth for the other categories.
Due to the U-shaped wage growth distribution, it is not immediately clear whether growth was also inclusive in relative terms. Calculating various income ratios, we observe that in some countries and industries relative inclusiveness could indeed be achieved, notably in Laos and to a lesser degree in the F&B and electronics industries in Cambodia (depending on the ratios used). In Vietnam, there was a clear tendency towards more wage inequality.
Finally, the convergence effect is clearly visible: employees who earned below market average saw a greater increase in their salaries during the observed time span. It is not obvious, though, what led to the convergence: improved market information, increased labor mobility via on-site housing or subsidized transportation and reallocation of (training) resources in case of short-term skills shortages could all be contributing factors. This might explain why the effect is smaller in Vietnam, with its larger labor market.
Factors influencing wage growth were tested in a regression. Sales growth had a positive, statistically significant (albeit small) effect on wages. In contrast, a high export orientation of a company had a negative influence on the average wages paid. This might be explained by the high competitiveness and cost-pressure of export markets. The effect is, interestingly, limited to the lower occupational levels. The results show further that changes in technology had a positive and statistically significant effect on wage levels across all occupational levels, while changes in products and work organization were not statistically significant in the main regression model.
Additionally we discussed how the particular U-shaped distribution among the five levels – growth being particularly strong at the two ends of the spectrum, i.e. at general worker and management levels – could be shaped by one of the following dynamics: (1) automation, which is starting to hollow out the middle task range, as prominently suggested by Acemoglu and Autor (Citation2011); (2) the export-oriented segments of the industries following standards set by big buyers, even applying their technology and machinery, thus reducing the need for local technicians; or (3) an oversupply of labor at these levels, or training courses not providing the skill sets sought by companies (more likely given that employers report skills shortages). Probably all factors interacted to provide the distribution observed, yet their relative influence cannot be quantified with the data available.
Overall, the observations made on absolute inclusive wage growth seem to confirm several results from earlier studies, regarding convergence, sales, and transformation. The negative effect of exports on wages contradicts earlier results, which might be explained by the choice of countries and industries studied. In Cambodia, Laos and Vietnam, industries have specialized in operating at a very specific node in the supply chain. The positive results of training could not be replicated in our dataset (possibly due to data limitations).
The positive effect of technological transformation on wages, while increasing wage inequality, resonates with the current discussion about globalization, digitalization, and automation. Such changes might necessitate strengthening people's capabilities to deal with the changes and harness new opportunities, for instance through upskilling.
Supplemental Material
Download MS Word (30.9 KB)Acknowledgements
The authors would like to thank Veung Naron, Sry Bopharath, Heang Sokuntheary, Hiev Hokkheang, Pon Dorina, and Ker Bopha (Cambodia), Santiphap Meunmany, Sengprasong Phrakonkham, and Nongkhane Phatthana (Laos) as well as Nguyen Thanh Thuy, Hoang Ngoc Vinh, and Bui Van Hong (Vietnam) for the excellent research assistance, including their valuable support during data collection. We thank Bounseng Khammounty, Dang Hoang Vi, Markus Maurer, Volker Stoer and Stephanie Allais for their valuable feedback and Andrea Marks for her editorial support. We further thank the ‘Skills for Industry’ project team members in Bangladesh, Ethiopia, and South Africa with whom we have developed and implemented the research project. Finally, we are grateful for the financial support our project receives from the Swiss Agency for Development and Cooperation as well as the Swiss National Science Foundation as part of their ‘Swiss Programme for Research on Global Issues for Development’ (r4d program). The main goal of the r4d program is the generation of new knowledge and the application of research results that contribute to solving global problems and securing public good in low- and middle-income countries within the framework of global sustainable development. For further information, see www.r4d.ch.
Disclosure statement
No potential conflict of interest was reported by the author(s).
Additional information
Funding
Notes
1 While there have been more recent contributions to the debate (e.g. Biswas Citation2016; Ngepah Citation2017) the discourse sphere mapped by Ranieri and Ramos (Citation2013) has not been substantially expanded by these contributions, nor has there been a tendency to narrow down the definition.
2 All average and minimum wage figures are inflation-adjusted with a 2012 base line, and were converted into US dollars with the exchange rate from 31 December 2018.
3 Based on data from the Ministry of Labor Vietnam, averaging the regionally set minimum wages, Ministry of Labor Laos, Ministry of Labor Cambodia.
4 See https://ilostat.ilo.org/topics/informality. For Vietnam, there is also a newer estimate (2021) at 82% informality, but this seems heavily influenced by the Covid pandemic, since before there was a steep decline (71% informality in 2013). In Cambodia, there was a small decline (81.3% in 2012, 80.6% in 2019), while there is only one estimate for Laos available from the ILO.
5 There are item non-responders and part-responders for wage and employment variables: those who did not answer at all, and those who reported categorical data (i.e. they responded with one of the five categories ‘declined more than 33%’, ‘declined less than 33%’, ‘not changed’, ‘increased less than 33%’, and ‘increased more than 33%’). If survey participants responded, then they mostly provided absolute figures. In the analysis, we focus only on those observations (around 2/3 valid observations). This allows controlling for the initial wage level in 2012, which turns out to be a crucial determinant for wage growth. Tests show that numerical and categorical responses have a similar distribution.
6 The coverage of the survey varies between 1% and 53%, depending on country and industry. In Cambodia, 16 companies with detailed wage figures were surveyed in the electronics industry, 8 in Food & Beverage, and 56 in the garment industry. Our estimate for the overall number of companies is 30, 140, and 1,120. In Vietnam, the figures are 27, 56, 46 survey companies versus 1,020, 610, and 6,000 overall. And in Laos, we surveyed 28 companies in F&B, and 18 in the garment industry, from a total of 2,100 and 80, respectively.
7 General workers typically perform simple and routine physical or manual tasks. Operators typically perform tasks such as operating machinery and electronic equipment; maintenance and repair of electrical and mechanical equipment; and manipulation, ordering and storage of information. Supervisors typically require an extensive body of factual and procedural knowledge and have oversight of a group of operators and/or general workers. Technicians typically perform complex technical and practical tasks which require an extensive body of factual, technical and procedural knowledge in a specialized field. The higher management typically consists of a group of high-level executives that actively participate in the daily supervision, planning and administrative processes required by an establishment to help meet its objectives.
8 All interviewees were informed of how the information would be assessed, and they provided verbal consent. No identifiable material is presented in the report. Ethical approval is not required in Cambodia, Laos and Vietnam for company surveys.
9 In the survey, the term was specified to include all formal training programs leading to industry-specific skills and entailing some kind of certification. Both short-term training as much as industry-oriented higher education programs are covered, but informal training is excluded.
10 It should be mentioned that the complex dynamic behind training descisions is only very crudely captured by the two variables. In particular, we cannot control for the proportion of workers that had VSD training as this is not known in the survey data (and often not known in detail at the company level at all).
References
- Acemoglu, D., and D. Autor. 2011. “Skills, Tasks and Technologies: Implications for Employment and Earnings.” In Handbook of Labor Economics, Volume 4, edited by O. Ashenfelter, and D. Card, 1043–1171. Amsterdam: Elsevier.
- ADB. 2011. Framework of Inclusive Growth Indicators: Key Indicators for Asia and the Pacific 2011. Mandaluyong: Asian Development Bank.
- African Development Bank. 2016. Measuring Inclusive Growth: From Theory to Applications in North Africa (Working Paper North Africa Policy Series). African Development Bank.
- Anand, R., S. Mishra, and S. J. Peiris. 2013. Inclusive Growth: Measurement and Determinants (No. 13/135; IMF Working Papers). IMF.
- Anand, R., V. Tulin, and N. Kumar. 2014. India: Defining and Explaining Inclusive Growth and Poverty Reduction (WP/14/63; IMF Working Papers). IMF.
- Aoyagi, C., and G. Ganelli. 2015. “Asia’s Quest for Inclusive Growth Revisited.” Journal of Asian Economics 40 (C): 29–46. doi:10.1016/j.asieco.2015.06.005.
- Attiah, E. 2019. “The Role of Manufacturing and Service Sectors in Economic Growth: An Empirical Study of Developing Countries.” European Research Studies Journal 12 (1): 112–127.
- Balakrishnan, R., C. Steinberg, and M. Syed. 2013. The Elusive Quest for Inclusive Growth: Growth, Poverty, and Inequality in Asia (WP/13/152; IMF Working Papers). IMF.
- Bell, B., P. Bukowski, and S. Machin. 2019. Rent Sharing and Inclusive Growth (Working Paper 29; p. 40). LSE International Inequalities Institute.
- Biswas, A. 2016. “Insight on the Evolution and Distinction of Inclusive Growth.” Development in Practice 26 (4): 503–516. doi:10.1080/09614524.2016.1167169.
- Cheng, S., P. Ngov, M. Heng, and S. Heng. 2019. “Investigating the Gender Wage Gap in Cambodia.” In Job Prospects for Youth, Low-Skilled and Women Workers in the Greater Mekong Subregion, edited by R. Vathana, 141–165. Phnom Penh: Cambodia Development Resource Institute (CDRI).
- di Gropello, E., and C. Sakellariou. 2010. Industry And Skill Wage Premiums In East Asia (Policy Research Working Paper). The World Bank. doi:10.1596/1813-9450-5379.
- Dollar, D., and A. Kraay. 2002. “Growth is Good for the Poor.” Journal of Economic Growth 7 (3): 195–225. doi:10.1023/A:1020139631000.
- Eckhardt, S., G. Demombynes, and D. Chandrasekharan Behr. 2016. Vietnam—Systematic Country Diagnostic. Washington, D.C: The World Bank.
- Hansen, H., J. Rand, and N. Torm. 2016. The Impact of Minimum Wage Adjustments on Vietnamese Wage Inequality. Hanoi: ILO.
- Hong Vo, D., L. T. H. Van, D. B. Tran, T. N. Vu, and C. M. Ho. 2021. “The Determinants of Gender Income Inequality in Vietnam: A Longitudinal Data Analysis.” Emerging Markets Finance and Trade 57 (1): 198–222.
- Klasen, S. 2010. Measuring and Monitoring Inclusive Growth: Multiple Definitions, Open Questions, and Some Constructive Proposals (No. 12; ADB Sustainable Development Working Paper Series). Asian Development Bank.
- Liu, A. Y. 2019. “Segregated and Not Equal? Occupation, Earnings Gap Between Urban Residents and Rural Migrants in Vietnam.” International Journal of Manpower 40 (1): 36–55.
- Matteazzi, E., A. Pailhé, and A. Solaz. 2017. “Part-time Employment, the Gender Wage Gap and the Role of Wage-Setting Institutions: Evidence from 11 European Countries.” European Journal of Industrial Relations 24 (3): 221–241. doi:10.1177/0959680117738857.
- Mueller, H. M., P. P. Ouimet, and E. Simintzi. 2017. “Wage Inequality and Firm Growth.” American Economic Review 107 (5): 379–383. doi:10.1257/aer.p20171014.
- Ngepah, N. 2017. “A Review of Theories and Evidence of Inclusive Growth: An Economic Perspective for Africa.” Current Opinion in Environmental Sustainability 24: 52–57. doi:10.1016/j.cosust.2017.01.008.
- Nguyen, C. V. 2013. “The Impact of Minimum Wages on Employment of Low-Wage Workers.” Economics of Transition and Institutional Change 21 (3): 583–615. doi:10.1111/ecot.12022.
- Nguyen, H. C., C. J. Nordman, and F. Roubaud. 2013. “Who Suffers the Penalty?: A Panel Data Analysis of Earnings Gaps in Vietnam.” Journal of Development Studies 49 (12): 1694–1710.
- Nguyen, K. T., and E. D. Ramstetter. 2019. “Ownership-Related Wage Differentials by Occupation in Vietnamese Manufacturing.” The Singapore Economic Review 64 (03): 625–645.
- Nguyen-Huu, T. T. 2021. “Do ‘Inferior’ Jobs Always Suffer from a Wage Penalty? Evidence from Temporary Workers in Cambodia and Pakistan.” International Journal of Development Issues 21 (1): 106–141.
- Nolintha, V., and I. Jajri. 2016. “The Garment Industry in Laos: Technological Capabilities, Global Production Chains and Competitiveness.” Asia Pacific Business Review 22 (1): 110–130. doi:10.1080/13602381.2014.990209.
- Pham, T. T. T. 2015. “Does Exporting Spur Firm Productivity? Evidence from Vietnam.” Journal of Southeast Asian Economies 32 (1): 84–105.
- Ranieri, R., and R. A. Ramos. 2013. Inclusive Growth: Building up a Concept. In Working Papers (No. 104; Working Papers). International Policy Centre for Inclusive Growth.
- Shrestha, M. 2018. The Impact of Minimum Wage Hikes on Employment and Wages in Cambodia (No. 8839; Policy Research Working Paper). The World Bank.
- Siliphong, P., and K. Phoumphon. 2019. “Gender, Employment and Wage Disparities in Laos.” In Job Prospects for Youth, Low-Skilled and Women Workers in the Greater Mekong Subregion, edited by V. Roth, 166–182. Phnom Penh: Cambodia Development Resource Institute (CDRI).
- UNESCO. 2020. Global Education Monitoring Report 2020: Inclusion and education: All means all. UNESCO.
- Zhuang, J., and I. Ali. 2010. “Poverty, Inequality, and Inclusive Growth in Asia.” In Poverty, Inequality, and Inclusive Growth in Asia: Measurement, Policy Issues, and Country Studies, edited by J. Zhuang, 1–32. Anthem Press. doi:10.7135/UPO9780857288066.003.