
 ?Mathematical formulae have been encoded as MathML and are displayed in this HTML version using MathJax in order to improve their display. Uncheck the box to turn MathJax off. This feature requires Javascript. Click on a formula to zoom.
ABSTRACT
This study proposes an analytical approach to support the selection of intervention strategy in response to conditions of food insecurity. This is done by assessing the functionality of the local market providing particular attention to the simulation of supply response. The consideration that price changes can play a major role in raising the trader’s entrepreneurial attitude raises the question whether a price rise is required before trader’s action can be expected. At the same time, the consideration that such a decision is not merely the result of price changes, but involves other contextual factors, as faced or perceived by the trader, highlights the need for a system capable of combining and analyzing information on these contextual factors. Results of the analysis stress the relevance of local market structure and functionality as predictors of the inflationary consequences of a cash injection. This leads to a proposal for a simple way to generate quick and rough estimates of expected price changes, which can turn out particularly useful when the feasibility of field data collection is severely constrained.
1. Introduction
Markets are key elements of people’s livelihood in all contexts, both in normal conditions and in the immediate aftermath of a disaster, as long as conditions allow markets to function properly. Such recognition has contributed to the progressive acceptance of cash-based instruments and, more in general, to the strategic shift from the provision of traditional commodity-based assistance towards innovative response options.
This study focuses on some aspects of the typical analysis required for the selection of humanitarian response options. The leading principle throughout this study is that no intervention is neutral to the system in which it is put in place, be it economic, social, political, or of any other type, although in our case it is mainly considered from an economic perspective. Therefore a proper understanding of the context-specific factors and circumstances in which any intervention is eventually required is key to identifying the most appropriate food assistance instrument or combination of instruments.
The aim of this study is to test the assumption that contextual factors are key determinants of market functionality and therefore both directly and indirectly play an essential role in affecting the effectiveness and efficiency of different intervention strategies. The analysis is conducted through the simulation of supply response to an eventual cash-based intervention. This is motivated by the consideration that when demand is artificially increased through cash transfers, much of the final outcome is given by the capacity to scale up local supply. Contextual factors can remarkably strengthen or weaken such capacity and therefore deserve proper attention when assessing needs and designing intervention strategies.
Data from five case-studies are combined to provide the basis for a comparative analysis of contextual background. These case-studies were the subject of preliminary market assessments focused on the feasibility of cash transfers. The different set-ups considered through the case-studies manage to cover a set of diverse realities. They range from conditions of a chronically low level of development, worsened by either slow- or rapid-onset natural disasters, to somehow more dynamic contexts characterized by either a protracted economic recession or, at the other end, by the start of a process of generalized reprise after a long period of civil conflict.
The profiling exercise of traders conducted through the case-studies has provided interesting behavioral information. In particular, it has been investigated the relevance of price increases as trigger of traders’ decision to scale up their business size. The consideration that different price rises generate a range of different responses from traders in different contexts has highlighted the need to define response capacity at local level.
The discussion below is organized as follows: section 2 reviews current knowledge; sections 3 and 4 outline the methodology applied for this analysis; section 5 presents and discusses the empirical results; and section 6 summarizes the findings and concludes.
2. The relevance of the market
The discussion on the advantages and disadvantages of different forms of food assistance is a controversial, though recurrent, subject. Normally the analysis has focused on the comparative advantages and performance of different strategies, providing regularly mixed results (e.g. Reutlinger Citation1984; Reutlinger and Katona-Apte Citation1984; Coate Citation1989; Dreze and Sen Citation1989; Faminow Citation1995; Basu Citation1996; Castaneda Citation2000; Alderman Citation2002; Sharma Citation2006; Lentz et al. Citation2013; Maxwell et al. Citation2013; Ryckembusch et al. Citation2013; De Matteis Citation2014; De Matteis, Ellis, and Valdes Citation2017).
Quite often the selection of aid modalities does not have a clear answer (Heaslip, Haavisto, and Kovacs Citation2016) and over the past few decades the discussion about the selection of appropriate response options to food insecurity has seen an increasing attention to the most important factors involved in that choice and has prompted the development of a number of field assessment techniques aimed at supporting the design of appropriate intervention strategies.
Overall, cash transfers are increasingly seen as an acceptable and appropriate way to deliver assistance, and such initiatives as the Grand Bargain and the Good Humanitarian DonorshipFootnote1 have accelerated the process leading to increasing amounts of humanitarian assistance being provided in cash. However, a common economic argument against the use of cash transfers makes reference to the risk of a possible unintended effect on inflation. Such price increases would end up reducing the effective value of the transfer and would instead negatively affect the living conditions of the non-beneficiaries. Considering that the non-beneficiaries may be a large and still vulnerable section of the population, a cash-based intervention could simply result in a shift of the food access problem from one group to another (Bailey, Savage, and O’Callaghan Citation2008). In this regard, a rigorous review of the evaluations conducted on a large number of cash-transfer programs implemented during the period 2000–2015 has recognized that a possible unintended effect of cash transfers can be price inflation at local level, which is likely to be stronger where there are market constraints to respond to increased local demand (Bastagli et al. Citation2016). Hence, from this perspective market analysis plays a central role in the discussion, and this consideration is reflected in the increasing attention towards the application of market analysis to assist the selection between response options.Footnote2
Markets facilitate and influence the movement of commodities, contributing to determine the interaction between supply and demand. Price movements signal changes in an economy reflecting events or expectations of events of various nature (e.g. climatic, economic, physical security, and policy). As such, market analysis provides information which is critical for decision making, regarding the selection of appropriate intervention strategy and the size of the intervention, as well as the possibility to foresee the type and size of potential positive and negative effects of the intervention (Albu and Murphy Citation2007; Sivakumaran Citation2012).
The local availability of food provides only a limited basis for the choice of intervention strategy. Access to food is regularly considered as another major dimension of the analysis; not just in terms of consumers’ purchasing capacity, but as the capacity to make demand and supply meet. In other words, it is the strength of market functionality which can play a critical role in the analysis of intervention strategy (Barrett, Lentz, and Maxwell Citation2007; Creti and Jaspars Citation2006; De Matteis Citation2006). Such functionality affects the type of intervention strategy: while a cash-based strategy acts through the demand side, leaving the supply side to the private sector, food transfers bypass the private sector through artificial support to the supply side. In the former case, market functionality is essential to convert increased purchasing capacity into effective demand. At the same time, market functionality may be affected in different ways by different intervention strategies: while a cash-based strategy may strengthen the market and stimulate a demand-driven process of local growth, a commodity-based strategy may risk replacing local supply rather than just filling its gaps. In light of such considerations, the controversial discussion about the preference for either cash or food finally seems to be shifting towards a compromise in favor of a combination of both to be adjusted according to contextual factors (Gentilini Citation2007).
Claims about the relative advantages of cash- and commodity-based transfers tend to refer to programs that are often implemented in different contexts. In general, program features and contextual factors help to determine the effect of the transfer and therefore potentially play a key role in the selection of intervention strategy. In particular, from both theoretical and empirical perspectives the relevance of the market is regularly stressed as a determinant of program performance (Barrett, Lentz, and Maxwell Citation2007; Ahmed, Quisumbingm, and Hoddinott Citation2007; Mohiddin, Sharma, and Haller Citation2007, among others). Davies and Davey (Citation2008) remark that although cash transfers should not be used under all circumstances, where the market is able to respond to increased demand cash transfers should be considered as an alternative to in-kind aid. Furthermore, in areas where markets are functioning and accessible, cash transfers are reported to be more cost-effective and preferred by beneficiaries. De Matteis, Turkmen Ceylan, and Kebede (Citation2021) highlight that market functionality does not necessarily drop during crises, but on the contrary markets may even operate more efficiently in the aftermath of a shock than in normal conditions. In general terms, by accepting that markets exist in crises and in the lives of people affected by crises, humanitarians have moved beyond a perspective that looked at people’s needs and have accepted that they need to understand people’s lives within their social and economic contexts (Levine Citation2017). Therefore, opportunities exist for using both intervention strategies in parallel or in a phased approach depending on seasonal and contextual changes over time and space (Mohiddin, Sharma, and Haller Citation2007; Gentilini Citation2007; Maxwell et al. Citation2013) and market analysis and contextual analysis seem to be well placed to inform the strategy choice. Progress has been made on how price changes and market functionality can be taken into account for the selection of aid modalities in order to optimize the efficiency and effectiveness of operations (De Matteis, Ellis, and Valdes Citation2017; Garcia Castillo Citation2020; Peters et al. Citation2021). In parallel, donors and humanitarian agencies have established guidelines and explicit checklists that markets and social customs must fulfill for the successful implementation of each modality, highlighting the likely consequences of high inflation and depreciation on the efficiency and effectiveness of cash transfers (CaLP Citation2021; DG ECHO Citation2022).
3. The conceptual framework
The positions considered above both in favor and against a cash-based response are somehow centered on the economic question of how markets will be able to react to the increased demand.Footnote3 Basically, this is reflected in the question whether grain – or other food – from elsewhere within the country can be shifted to a zone of food deprivation depending on market incentives facing traders and the non-market barriers or facilitation created by insecurity, institutions or policy.
Often in developing countries market functioning is already weak in normal conditions, but it becomes of particular concern in situations affected by conflict or natural disaster. While in situations of surplus the increased demand generated through an injection of cash is not expected to generate inflation, in situations of deficit the choice is wider. In such situations, if the market works, an injection of cash can generate demand-led growth and traders are expected to be able to respond to the increased demand; on this basis, cash is the appropriate tool. If the market does not work at all, or works inappropriately, a commodity-based intervention is generally appropriate. However in this latest case, extreme situations may require a different response: situations characterized by strong deficit and absence or absolute disruption of the market should be addressed solely through commodity-based interventions, while situations characterized by minor deficit and limited functioning of the market can be addressed through a combination of both cash- and commodity-based interventions.
Having said the above, the question moves onto how to draw the line between the different cases considered. Essentially, this involves verifying the local availability of the commodity in question, its accessibility to local people, and the existence of a functioning market. This means that in order to provide a useful basis for decision-making, market analysis will have to link three aspects: food supply, demand and market functioning. Some contextual factors affecting one or more of the three aspects just mentioned can be considered as well to improve the analysis whenever possible: transport and storage infrastructure, security, credit facilities, policies and public control, etc. The main objective is to provide a basic understanding of markets, spelling out the extent to which markets function and ultimately their relevance to food availability and people’s access to food. Such knowledge and understanding of market structure and functioning would form the framework for the simulation of alternative intervention strategies, aiming at reducing an eventual gap between supply and demand generated by either an excess of demand or a shortage of supply manifesting in problems of either availability or access to food, or both.
To cover the points just mentioned it is necessary to analyze: supply (availability), demand (access), and the interaction between the two. The price of food commodities exchanged becomes the link between supply and demand and constitutes the key to the analysis by combining information about both consumers’ willingness to pay for a good and traders’ costs in supplying it.Footnote4 While the demand side of the analysis is focused on beneficiaries’ use of the transfer to estimate how the demand, particularly for staple food, will change after an income rise generated either through a cash transfer or food aid, the present study is focused on the other side of the spectrum: the assessment of expandability of supply.
A key step in the analysis of supply and of its expandability is the estimation of price elasticity of supply (i.e. how the supply of a specific food commodity will change following a change in the commodity price) as well as of its determinants. Considering the market focus of our perspective, the aim of the analysis is to try to establish the relevance of the trading sector in responding to the demand for food, and its flexibility to expand in response to an eventual increase in demand. Essentially this is reflected in a decision that the trader is to make: whether to scale up or not his/her business size. Besides the relevance of the price change, the context in which such decision is to be taken is expected to play a determinant role, with the price increase somehow related with the characteristics of the context. The assumption throughout this analysis is that in the presence of a functional market market-based strategies are preferable because they are more effective and efficient than alternative strategies, while it is more difficult to make a choice in the case of low market functionality.
4. Methodology
This study combines a few analytical tools that are described in the following sub-sections. All of the tools are functional to this study; however a few of them – related to the analysis of key contextual features – get only partial application here, through metadata deriving from the analysis conducted at case-study level. This is notably the case of price time-series analysis applied in each case-study to assess the degree of local market functionality. The summary measures of market integration and of price variability presented in are the results of the analysis conducted separately for each case-study. Although each single application is not reported here, it is felt important to present the methodology which is behind the meta-data used in this study.
4.1. Traders’ business size and market competitiveness
A traders’ survey should be able to provide a description of the traders operating in a certain geographical area and a specific sector. Besides the role played within the market chain, one of the descriptive bits of information detected through a traders’ survey that is of particular relevance for the purposes of this analysis is the business size of each operator. Different sizes of business are expected to raise different types of constraints and may therefore play a certain role in contributing to traders’ decision making.
From another perspective, the analysis of market share estimates covered by individual traders or groups can help to estimate concentration ratios and therefore to consider the degree of competitiveness of the food marketing channels as well as the risk of collusion.Footnote5
Estimating business size is not so easy and even a group categorization such as small, medium and large is very context-specific. The method proposed in this case is quite rough, but acceptable for the purpose of the analysis conducted here, which is not aimed at an exact definition of the business size but rather its approximate classification. From this perspective, traders’ business size can be estimated by considering the value of the few major food commodities traded.Footnote6 Such rough estimate will feed into an ordinal classification of business size which allows to deal with different business size typologies encountered through the various case-studies.
In addition to the above, our rough estimates of individual business size can also be used to assess the degree of local market competitiveness. This is done through the estimation of the Herfindahl-Hirshman Index (HHI) which compares the squared business size of each unit against the cumulative size of the units surveyed. The Normalized HHI is given by:
(1)
(1) where N is the number of units surveyed; si is the market share of the ith unit.
At this point, a word of caution is due on the use and interpretation of HHI. Caution is not only due to the quick and rough approach proposed here for the estimation of business size, but it is also due to the limited knowledge of local business size data. A proper estimate of HHI would require a census of all local traders, which is very unlikely to be available when a market analysis is conducted in remote and/or risky areas. Having said that, it is felt that this kind of information can provide useful insights even with incomplete data.
4.2. Willingness to trade
A preliminary step in the analysis of supply expandability is to determine availability and access to critical inputs. In fact, it goes without saying that traders’ confidence in accessing a sufficient amount of critical inputs such as food commodities in particular would constitute a necessary precondition for the feasibility of a cash-based initiative.
Along the same lines, it is possible to find out traders’ willingness to scale up their supply as well as to investigate the eventual constraints to doing so that they may face. The number of possible reasons of traders’ interest in scaling up their business can vary from case to case, but the most relevant for our analysis can be reduced to the following five:
prices
security
roads and accessibility
credit
storage facilities.
After all, prices cannot be expected to be the only determinant of traders’ behavior: other factors play a role, whether related to the individual trader or a certain typology of traders, or simply to external factors. Such factors are linked to the context in which the trader happens to operate. They can be either a direct or indirect expression of the context, or, more subtly, be a reflection of how the trader, either as an individual or a professional category, perceives a specific aspect of the context, as for instance the reliability of market signals. All such factors, real or perceived, contribute to forming the trader’s willingness to trade (WTT).
A system capable of combining and analyzing information on these factors is required. A few components of such a system can be identified. A certain knowledge of local trading structure and capacity is necessary, with a summary identification of local trader categories. This component refers to the core of the implementation of a potential response to an eventual disequilibrium manifesting in the local market. This core component does not operate in isolation but is linked to another focal point of the system: the source of the additional quantity to be supplied. This may involve the farming sector only marginally, but as long as the area under consideration is not a surplus producing area the focus of the analysis will be on the identification of the major trading links for major commodities both at the local level as well as mainly in neighboring areas. The strength of these links constitutes a key component in assessing the solidity of any market-related strategy, and price transmission analysis is the appropriate tool for the job. A good understanding of transport-related factors (e.g. availability and access to transport) as well as other eventual constraints, such as security in the source markets and along the main transport routes, will contribute to the contextual picture. Finally, information required from traders is limited to: (a) estimation of the minimum average price increase at which they would be willing and ready to scale up their business size, and (b) their perception of the eventual availability and accessibility of additional critical inputs such as credit and commodities.
The analysis sketched above can be carried out through multivariate regression. Since the decision to start or scale up own business size can be considered a dichotomous choice problem, it is possible to carry out econometric estimation through the application of limited dependent variable models. This type of non-linear statistical model relates choice probability to explanatory factors. In the present case the objective is to estimate the probability that traders are willing to start new activities or scale up their existing activities conditional upon specific trade and trader’s characteristics. The present analysis focuses on business size for what concerns the trader’s characteristics and on the factors highlighted above as major determinants of business size as well as on reliance on market signals for decision making. In order to do this a model is required that is able to reflect the adoption of a certain set of behavioral responses which are empirically observed. Although ordinary least squares estimates can be computed for binary models, the error terms are likely to be heteroskedastic leading to inefficient parameter estimates and thus making inappropriate classical hypothesis tests. Probability models can be of help in overcoming such a constraint. In particular, the use of the logit model, which gives maximum likelihood estimators, helps to overcome most of the problems associated with linear probability models and provides parameter estimators which are asymptotically consistent, efficient and Gaussian so that the analogue of the regression t-test can be applied.
The adoption behavioral model used to examine factors influencing traders’ WTT can be presented as follows:
(2)
(2) where
is the observed response for the ith trader (
= 1 for a positive response,
= 0 otherwise) and
is a vector of explanatory variables observed for the ith trader.
Considering that in our case the behavioral model reflects decisions taken according to the simulation of eventual price changes, it can be better expressed through an ordered multinomial model. The use of such a type of model is justified by the structure of the dependent variable (i.e. price increase) where values are condensed along the average value in each class considered. In ordered logit, an underlying score is estimated as a linear function of the independent variables and a set of cutpoints. The probability of observing outcome Yi corresponds to the probability that the estimated linear function, plus random error, is within the range of the cutpoints estimated for:
(3)
(3) where the error term ui is assumed to be logistically distributed in ordered logit. The coefficients b1, b2, … , bk are estimated together with the cutpoints k1, k2, … , kk-1, where k is the number of possible outcomes, k0 is taken as –∞ and kk is taken as +∞. Expressed through (3) the analysis of traders’ willingness to accept to scaling up their activities should help both to consider the feasibility of expanding and adapting supply to the estimated increased demand – highlighting the weight of various factors in traders’ decision – and concurrently estimating the possible risk of inflation.
As mentioned earlier on, one of the prerequisites of any market-based intervention strategy is expandability of supply, which ultimately leads to traders’ access to critical inputs. The list of such inputs is quite long, however the analysis of such key inputs as cash, essentially in the form of credit, and commodities, can go a long way. In our case-studies traders’ confidence in the accessibility of each key input is expressed as a dichotomic variable which has been considered separately in order to avoid any risk of simultaneity bias.
4.3. Market functionality
In this study the degree of market functionality is primarily assessed through the analysis of market integration. The basic principle is the assumption that the closer the changes in prices experienced in two markets, the more integrated the two markets can be seen to be. In order to study the interdependence of price time series between any pair of markets i and j, we can refer to a linear relationship of the type:
(4)
(4) where
represents the retail price prevalent on market i at time t;
represents the retail price prevalent on market j at time t;
represents the error term;
and
represent the coefficients to be estimated.
Once the condition of stationarity of the series and their co-integration are verified, the Error-Correction Model is adopted:
(5)
(5) where Δ indicates the change in price in market i or j between one period and the previous one (t and t–1).
This model can be interpreted by considering how traders adjust the price of their merchandise () from one period to the next in response to changes in concurrent prices on other relevant markets (
) as well as to the previous disequilibrium between the price prevalent on their market i and on market j. From this perspective α2 measures the short-run effect in the process of price change and α3 measures the speed of adjustment of price on market i to a discrepancy between pi and the price prevalent on the reference market (
) in the previous period.
The error-correction term can be interpreted as the deviation from the long-term equilibrium between the prices on two markets, where the coefficient
measures the long-term effect in the process of adjustment. The greater the value of
, the more integrated are the two markets, and at a larger scale, the more functional is expected to be the local market.
The half-life index h helps with a summary measure of the process of price transmission. It measures the number of time units required for the process of change in one market to take effect in the other market, per each pair of markets, before restoring half of the long-run equilibrium between their prices. This is measured as:
(6)
(6) where
is the estimate of
, the coefficient of the lagged difference in:
(7)
(7) The ratio θ2/h provides a combined picture of the characteristics of the adjustment process and facilitates comparison.
The same price dataset used for the analysis of market integration has been used to estimate the degree of price variability, which is considered here as another proxy of market functionality. Price variability is measured as the relative standard deviation.
4.4. Other contextual variables
Two additional contextual variables have been considered in this study: density of road network and physical security.
Roads are known to be among the major drivers of economic growth at local level. A study has estimated the dominant role of transport charges in the structure of food marketing costs in Eastern Africa (World Bank Citation2009). Not only are such charges transmitted to end users by raising market prices; it has also been shown that in Africa such costs have also a significant impact on agricultural productivity and supply response (Dorosh et al. Citation2008; Lall, Wang, and Munthali Citation2009). Therefore, the simple indicator of the road density in an area can be quite revealing, particularly when considering market-based development strategies. For the present study, the data utilized for the estimation of road density have been selected on the basis of purposive sampling: in each case-study three spots have been selected per relevant area and from each of them the estimation area has been defined as a circle with a radius of approximately 18 kilometers. For the estimation of the index of road-density weights have been attributed arbitrarily to different types of roads: a weight of one for primary roads and of 0.75 for secondary roads.
Physical security is expected to play a role in defining trader behavior and productive activity in general. The assumption is that ceteris paribus activities are discouraged in areas of higher insecurity. In this case, we have used security levels defined by the United Nations Department for Safety and Security (UNDSS). The index ranges between zero and five with the higher the value the poorer the security conditions.
5. The data
A set of diverse realities has been considered in this study, ranging from a chronically low level of development in the northern Kenyan districts of Turkana and Wajir, characterized by severely limited resources, to much higher living and economic conditions affected by a long-term recession in Swaziland. The cases of South Sudan and Haiti fall somewhere between the two extremes, with contexts which in some respects are close to that of arid lands in northern Kenya, but whose conditions of development have been affected by civil conflict and exposure to natural disasters. In such a diverse set of conditions the process of institutional development is arguably at different stages, and the market, considered either as an institution in itself or as the outcome of the initiative and control of other institutions, is no exception.
We use a dataset which has been compiled from a set of case-studies that were conducted as stand-alone exercises in different periods over a seven-year time-span. It is understood that each case-study reflects a few settings which are time-sensitive and which may have changed over time. Having said that, all case-studies followed a similar methodological approach, and therefore the combination of data collected through the case-studies provides a valuable opportunity to apply a comparative approach in the analysis of determinants of supply response in different settings.
When the analysis is conducted from a contextual perspective the focus is on both the characteristics of the context and the interaction between the main players and the context itself. In the present case, the focus being on the supply side of the food trade relationship, the players are the traders, while the context is provided by the various aspects of natural, social, economic, institutional structure and infrastructure.
Large part of the data used in this study has been collected through traders’ surveys, while secondary data have been used to contextualize the analysis. While the present analysis is conducted on the original data collected through traders’ surveys, for the purposes of contextual analysis we use metadata to summarize the contextual variables.Footnote7 shows the sample size used for primary data collection in the various case-studies as well as the number of monthly price series considered for the analysis of market integration.
Table 1. Sample sizes.
In three case-studies the trader survey expanded beyond the focus area in order to provide a comparative perspective.Footnote8 In all cases the selection process was purposive and essentially dictated by geographical considerations, where preference was given to urban and trading centers.
The price series refer to the most common staple in each case-study: maize in Kenya and Swaziland, sorghum in South Sudan and rice in Haiti. As shown in , the number of price series considered in each case-study is different, ranging from a maximum of 50 markets in the Wajir case-study to only four in the case of South Sudan.Footnote9
6. Findings
6.1. The context
summarizes the variables considered in the five case-studies.
Table 2. Summary table.
The first remark is about traders’ regularly greater confidence in accessing food commodities rather than cash, with the exception Northern Bahr el Ghazal in South Sudan, and of Wajir and all other areas covered through the Kenya II case-study.Footnote10 Keeping aside the Kenya II case-study, the gap in confidence ranges from a mere 3% recorded in Lakes, South Sudan, and Lubombo, Swaziland, to a maximum of almost 40% in North Turkana. Such information could provide substantial assistance in exploring alternative intervention strategies. The greater the traders’ confidence about accessing commodities and the larger the gap between their ability to access the two key inputs, the stronger the justification for cash-based strategies. The contrary is the case when traders’ confidence in the accessibility of cash appears to be significantly higher than their confidence in the accessibility of the quantity of commodities envisaged as necessary to respond to an increased demand. From this perspective, North Turkana and Shiselweni seem to be ideal candidates for a cash-based intervention strategy, while in Northern Bahr el Ghazal a commodity-based approach appears to be more appropriate.
However, a certain caution is deemed appropriate since a biased attitude may be expected from traders: this may occur in two ways. In traders’ opinion their ability to access cash may be downscaled in order to support a cash-based intervention which would stimulate local demand and, hopefully, their business as well. The same attitude may lead them to overemphasize their optimism about accessing additional commodities.
It could be argued that traders’ business size and market power may influence access to inputs as well as reflect a diverse business approach and strategy. It is expected that both a large business size and a condition of market power can facilitate access to inputs. Conversely, while the former is expected to lead to economies of scale which can get translated into price reductions, the latter is expected to be associated to price rigidities. In our sample, the distribution of business size is expected to reflect the different level of local economic growth. Having said that, caution is required when comparing average business sizes across different economic environments, and particularly at international level; hence data on business size used for further analysis is expressed in the form of local quartile dummies.
Our consideration about business size is also expected when comparing the average degree of market power across different economic contexts. Data in our sample highlight that, while in Kenya market power seems to be inversely linked to economic growth – i.e. more developed areas are characterized by lower levels of market power – the same relationship does not seem to apply in other cases.
When considering the points above it may be worth as well enlarging the geographical scope of the contextual analysis in order to consider food trade links in the markets or area considered within a wider picture. A review of the links between local markets and the supplying areas would help to understand the solidity of traders’ confidence in the accessibility of inputs and therefore in their supply capacity. At the end of the day, it is important to keep in mind that commodities need to be sourced somewhere, and every time we enlarge the geographical scope for cash intervention, it is necessary to include in the analysis an additional level of source markets. Such a process could confidently stop only after reaching a solid level of confidence about aggregate production and trade capacity which can ensure a stable flow of commodities towards the geographical areas of interest and which is capable of covering the increased demand stimulated at local level. Such observation is crucial for areas and markets that rely on imports from other areas to satisfy local requirements.Footnote11 This leads to the crucial role of the integration of different areas and markets in affecting local supply capacity.
The analysis of market integration can help to examine the effectiveness of market functioning. features the average values of the ratio θ2/h which provides a combined picture of the characteristics of the price adjustment process. First of all, the highest rates of integration are found in Haiti, scoring approximately the same as the dynamic productive and commercial areas in the various countries considered. Remote resource-poor areas are generally left behind reflecting a lower degree of market functionality, with the remarkable exception of the areas north of Wajir, where the border trading centers help to make the difference. South Sudan seems to be somewhere midway in the scale of recorded values; however a word of caution is required since such a value reflects only a very limited number of markets for which data are available and which result to be cointegrated. A good degree of integration is found also in Swaziland, with minor gaps among the different areas of the country.
Price variability is another indicator of market functioning considered in this analysis. Average data in partially support the consideration that price variability tends to rise in remote and depressed areas. For instance, this seems to be the case when comparing North Turkana against South Turkana, but, contrary to expectations, this does not occur when comparing Turkana against the Rift Valley. Likewise, conflicting indications are provided by our estimates of average price variability in the Swaziland, Haiti and Kenya II case-studies.
In terms of road density, the index shows a striking difference between more and less developed areas. This is particularly evident in the case of the Kenyan data, with an almost six-fold increase in road density from North Turkana southwards towards the very productive and commercially lively area of Rift Valley along Lake Victoria. Likewise, an almost five-fold increase is recorded in the eastern part of the country, moving from Wajir southwards towards Nairobi. The data from South Sudan reflect the same North–South increase in road density. The Swaziland case records the highest road density in our sample and shows only a small disparity among the three areas considered. Once again, as expected, the most developed area – i.e. Manzini – has the highest road density. Haiti falls in the better-off part of the combined distribution, with only some minor disparity among the three focus areas.
Finally, it is interesting to consider how the security index follows quite closely the distribution of road density, showing a clear relationship between roads and security, as expected. The negative sign of the index (−0.78) highlights how a higher degree of insecurity is expected to occur in remote and underdeveloped areas, where road density is low.
6.2. Willingness to trade and price increase
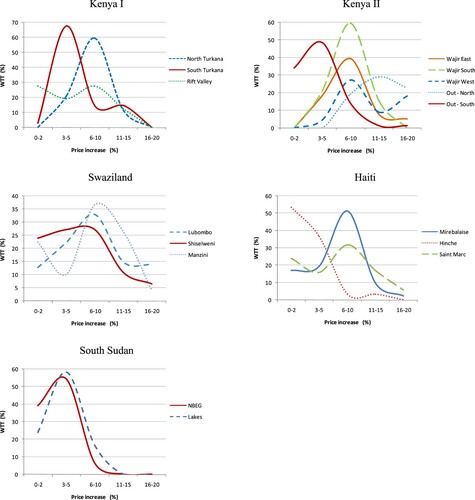
Since the focus of this study is the analysis of traders’ decision to start or scale up their business, of key relevance is the review of the determinants of traders’ decision to do so. As the contexts of the case-studies are different, traders’ priorities may differ; nevertheless they consistently happened to believe that a price increase was unavoidable in their effort to scale up supply, in view of the tight conditions in which they were operating. reports the distribution of minimum price rises that traders consider appropriate to expand their business size. As expected, distributions have a bell shape; however, each distribution has its own peculiarities which differentiate it from the others. In fact, the results of a similarity test, presented in in the Appendix, remark how all distributions in each case-study are significantly different from each other, with the exception of Lubombo and Shiselweni in Swaziland, as well as Wajir East and Wajir West, and Wajir West and Out of Wajir North in the Kenya II case-study.
Table 3. Distribution of expected price increase.
provides some summary statistics on WTT estimates. Overall, minimum price rises vary widely through the various case-studies, ranging between 3.8% recorded in South Sudan and the values 10.7% – 10.9% recorded in the two Kenyan case-studies. Average estimates for Haiti (7.1%) and Swaziland (8.5%) fall somewhere in between the two extremes. Average values resemble closely median values, with the exception of the Kenya II case-study (6.6%) which remarks a high variability among its various components, both in Wajir and, particularly out of Wajir. In fact, as reported in , average estimates of minimum price increase record their highest values in Wajir North and Wajir West and decrease sharply when moving out of the district southwards. None of the other case-studies records such a high level of variability in the estimates of the minimum price rise than those estimated through the Kenya II case-study. This is confirmed by comparing the values of standard deviation estimated for each distribution.
The differences of expected price rise distributions highlighted above can be easily visualized in . For each distribution, the area below the curve helps to visualize the size of traders’ response to price changes, and hence of supply change. This size is to be cumulated as we proceed through the various categories of price rise. Any additional quantity will be brought into the local market and sold at a higher price. With this in mind, in order to consider the possible applications of this kind of analysis it suffices to compare the evolution of the WTT curves related to North Turkana and South Turkana. A glance is enough to get a clear idea of the significantly higher risk of price increase in the former than in the latter. Along the same reasoning it comes clear that curves scoring their maximum frequencies with reference to the same price rise category may lead to different estimates of price rise according to the size of their maximum frequencies. For instance, as eloquently shown through the graph about the Kenya II case-study, although Wajir South, Wajir East and Wajir West share their maximum frequency of WTT in response to the same rate of price rise – i.e. 6–10% – such price rise is expected to lead to quite different cumulative supply increases, which can be estimated respectively to be around 80.8%, 57.9% and 31.8%, as can be deducted from .
Figure 1. Distribution of WTT. Source: .
The considerations above, somehow expected, do not express any a priori judgement of the feasibility and appropriateness of a cash-based intervention strategy in any of the case-studies or areas considered, but can be very useful in a decision-making process. Not only does this analysis manage to draw attention to the higher-than-average or lower-than-average risk of inflation which is to be expected; it also helps in getting some estimates of this risk and can be expanded to consider, on a preliminary basis, eventual mitigating measures that can be adopted in order to contain the risk of excessive price change.
This is of particular relevance when considering intervention strategies such as demand-based measures like the provision of cash transfers or, on the other end, of commodity-based transfers. In fact, the ultimate purpose of the analysis of traders’ willingness to trade is related to the estimation of the likely price increase expected to be associated with a local increase in demand. More in general, for the purposes of this study it can be useful to show how contextual information collected through the various case-studies can help to model very different market conditions. provides the results of a likelihood analysis conducted through specifications of the ordered logit model presented in section 4.1.
Table 4. Determinants of willingness to trade.
In the coefficients of market structure and functionality record strong values, always with the expected sign. This supports the position held throughout this analysis about the relevance of market features as key determinants for the choice between a cash-based or a commodity-based strategy or a combination of both. As expected, the stronger the degree of market functioning, the lower the inflationary consequences of a cash injection. In particular, market integration comes up among the major predictors of WTT and risk of price rise.Footnote12 The comment just made is supported by our result about price variability. As mentioned earlier on, high price variability is expected to be a feature of malfunctioning markets, and as such, is expected to be associated to high rates of price rise in case of demand surge. Having said that, the consideration that market functioning is strongly affected by market structure is supported by the large coefficient of market power detected through our analysis. The control that few traders can exercise over the local supply comes up as the strongest determinant of WTT and therefore of the eventual price rise which can be expected to be associated to a demand surge.Footnote13 This is reflected, although at a much lower level, by the relevance of business size over WTT.
In terms of traders’ perception of market functionality, their confidence in accessing key inputs has the expected sign. Although insignificant, traders’ confidence in the availability and accessibility of cash helps to contain any price increase. However this holds only if balanced by access to commodities. In fact, results show how traders’ access to additional commodities is a significant determinant of WTT and results more effective than access to cash. Once the former becomes more restricted than the latter, financial surplus automatically translates into price increase.
About more general contextual factors, our results confirm our expectation that conditions of insecurity contribute to raise prices. Conversely, results about road density are of more difficult interpretation. As shown in model A, contrary to expectations, an increase of road density seems to favor a price rise. A possible interpretation can take into account the consideration that road density cannot necessarily contribute to containing prices on its own if prevailing security conditions do not allow proper use of the road network. Hence, to take account of this consideration, in model B we have combined the two variables security and road density. In this case, the original scores of the security variable have been inverted, retaining the original domain of the index. This inversion is motivated by the need to align the security variable and the measure of road density, on the consideration that roads density cannot necessarily contribute to containing prices on its own if prevailing security conditions do not allow proper use of the road network. The sign of the coefficient supports our interpretation. Nevertheless, the low value of the coefficient remarks how the combined contribution of increased road density and security conditions has only a very limited impact in containing the likely price rise induced by a demand surge.
The inclusion of case-study dummies in models C, D and E, necessary to take into account case-study fixed effects, contributes to increase the value of the coefficients of market-related variables and the overall significance of the model.
In summary, market structure and functionality come out of the analysis as the major determinants of the risk of price rise. All other factors considered seem to be less relevant in explaining variations in WTT.
In practical terms, this means that measures of these two key contextual features can suffice to provide a reliable estimate of the price changes that can be expected from alternative intervention strategies. This consideration helps to improve the practicability of the data collection activities required to conduct this analysis. In fact, when resource availability and/or prevailing local security conditions constrain the feasibility of data collection, the analysis of local market structure and functionality is expected to provide critical support in the strategic decision making. provides an interesting sketch of the relationship between one of the key features of local market structure and the price changes which can be expected from an increased purchasing capacity. Needless to say, is based on the dataset derived from the case-studies considered earlier on,Footnote14 and therefore it should be considered in itself of limited application. Nevertheless, it is felt that the relationship identified in can be of support for cases in which proper field activities of data collection are temporarily unfeasible or seriously constrained. In such conditions, if a rapid response is required, the functional relationship identified in can provide the starting point for a quick-and-rough estimation process that is expected to be refined at a later stage with more in-depth fieldwork. highlights the existence of a linear relationship between the minimum price increase that can be expected as a consequence of increased demand and the degree of local market power. In particular, the trend line reveals that any percentage increase in the degree of local market power is expected to lead to a price increase of at least 0.27%, starting from a minimum price increase estimated just above 5% to be expected in the most competitive local market settings. In general terms, this rate of price increase may seem excessive in a competitive market, but it can be explained by the temporary prevailing emergency conditions considered here.
Figure 2. Functional relationship between local market power and expected minimum price increase.
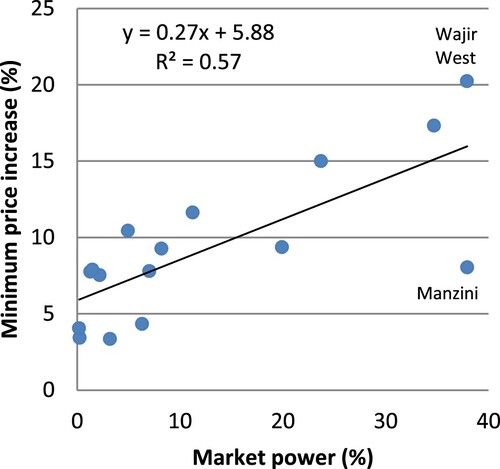
Having said the above, the large range of coefficients related to local dummies reported in reminds us of the possible large variations due to contextual features which are not captured by the models. In such large variation can be visualized by considering the dispersion of points around the trend line. It may suffice to consider the very different contextual features of markets in Manzini and Wajir West, where the same degree of market power was estimated in association with very different rates of minimum price rise. Therefore, caution is required when making use of the functional relationship presented in . A more in-depth analysis of local data along the models presented in would help to shed light on additional key contextual aspects, with particular reference to the analysis of market functionality. In fact, the quite different degrees of market integration estimated in the two areas can easily explain how in the two markets a similar degree of market power can be associated to very different estimates of minimum price rise. Having said that, a necessary trade-off can be identified between resource availability for the assessment and the precision of the estimates produced.
7. Conclusions
This paper has focused on the relevance of contextual factors in affecting local supply and consequent market price changes. A few key factors shaping the functioning of the local market have been examined on the basis of data from case-studies which have been combined to provide a comparative perspective. This approach has shown to be quite helpful in highlighting how different strategies in response to local food insecurity can facilitate or constrain the development of local business, remarking therefore how contextual analysis can provide a critical contribution in the design of intervention strategies.
The case-studies have provided a diverse background to the analysis of contextual factors and of the various relevant links among them. This has geared towards the analysis of the relevance of various factors in influencing traders’ decisions to scale up supply of the main staple food commodities. Commodity prices, business size, market integration, and traders’ confidence in accessing key inputs have been considered as the main determinants of supply expandability.
Results of the analysis of traders’ WTT stress the relevance of local market structure and functionality. This supports the position held throughout this analysis about the relevance of market functioning as a determinant of the choice between a cash-based or a commodity-based strategy or a combination of both. As expected, the more competitive the market structure and the stronger the degree of market functioning, the lower the inflationary consequences of a cash injection.
In more general terms, the ultimate purpose of this exercise is the estimation of the likely price rise associated to a certain increase in local demand which can be reasonably expected from an increase in purchasing capacity as in the case of cash-based programs. Therefore, this approach can be quite helpful to compare intervention strategies that may provide more or less emphasis on the provision of cash. At this regard, the analysis of the combined case-study dataset reveals some interesting results. The rate of price increase expected in neighboring food insecure areas has often been found to be significantly different reflecting contextual features. This type of information can be very useful for decision-making purposes when designing or fine-tuning an intervention strategy. Hence, an analytical approach has been proposed for the estimation of local price changes on the basis of a few key features of the local market. The proposed analytical approach can prove quite useful in adjusting intervention strategies to the peculiarities of prospective intervention areas, particularly when a quick decision is required and field activities are constrained.
Acknowledgements
The authors gratefully acknowledge the valuable comments received on preliminary research from Bereket Kebede, Stephen Devereux, Pieter Serneels and from the participants of the webinar hosted by the University of Teramo on 30 June 2020 and coordinated by Bernardo Cardinale. The authors are indebted to the organizations which provided field support for the collection of data used for this study: the European Commission, the Food and Agriculture Organization, Oxfam, Save the Children and Mercy Corps. Usual disclaimer applies.
Disclosure statement
No potential conflict of interest was reported by the author.
Correction Statement
This article has been corrected with minor changes. These changes do not impact the academic content of the article.
Notes
1 Details about the Good Humanitarian Donorship and the Grand Bargain can be found at https://www.ghdinitiative.org/ghd/gns/home-page.html and https://interagencystandingcommittee.org/grand-bargain.
2 See Sivakumaran (Citation2012) and Juillard (Citation2018) for a review of the discussion.
3 While a demand-based intervention can be implemented through various modalities, for simplicity throughout this study we refer to cash assistance.
4 For simplicity, throughout this document we make the assumption that authorities do not interfere in the market determination of prices.
5 Timmer, Falcon, and Pearson (Citation1983) suggest that the greater the number and the diversity of traders operating in a market, the lower the risk of collusion.
6 It is reasonable to assume that the number of most relevant commodities dealt with by a trader varies according to the degree of development of the market or geographical area under investigation.
7 In other words, most of the contextual variables adopted in this study are the output of the analysis conducted through the various case-studies. This is the case of measures of market integration, price variability, local security and road density.
8 In order to remark the degree of remoteness and isolation which characterizes most of the focus areas, fieldwork has often tried to expand towards surrounding and better-off areas.
9 The low number of time series considered in the South Sudan case-study is of concern and findings need to be considered with caution.
10 In the latter case, the traders’ full confidence to access cash and commodities gives the impression of a biased response. It could be argued that the increasing adoption of cash-based – and more generally market-based – strategies may have contributed to induce such confidence.
11 Incidentally, it is worth remarking that such local requirements may not necessarily manifest as local demand, but may consist as well of a regular flow of commodities procured and moved by residents or relatives for their own consumption.
12 Ceteris paribus, a unitary increase of the degree of market integration is associated to an estimated price reduction ranging between −1% and −16%. The higher the degree of market integration, the lower the expected price increase.
13 Ceteris paribus, a unitary increase of the degree of market power is associated to an estimated price increase ranging between 6% and 14%. The higher the degree of market power, the larger the expected price rise.
14 In the rate of minimum price increase is measured by the WTT and the degree of market power is measured by the Herfindahl-Hirshman Index. Both variables are sourced from and are presented here in percentage format.
References
- Ahmed, A., A. Quisumbingm, and J. Hoddinott. 2007. Comparing Cash and Food Transfers to the Ultra-Poor in Bangladesh. Washington, DC: IFPRI.
- Albu, M., and E. Murphy. 2007. Market Analysis Tools in Rapid-Onset Emergencies. Phase One Report. Rugby: Practical Action.
- Alderman, H. 2002. Subsidies as Social Safety Nets: Effectiveness and Challenges. Social Protection Discussion Paper No.0224. Washington, DC: World Bank.
- Bailey, S., K. Savage, and S. O’Callaghan. 2008. Cash Transfers in Emergencies: A Synthesis of World Vision’s Experience and Learning. HPG Report. London: ODI.
- Barrett, C., E. Lentz, and D. Maxwell. 2007. A Market Analysis and Decision Tree Tool for Response Analysis: Cash, Local Purchase and/or Imported Food Aid? The Decision Tree Tool. Atlanta: CARE International.
- Bastagli, F., J. Hagen-Zanker, L. Harman, V. Barca, G. Sturge, T. Schmidt, and L. Pellerano. 2016. Cash Transfers: What Does the Evidence Say? A Rigorous Review of Programme Impact and of the Role of Design and Implementation Features. London: ODI.
- Basu, K. 1996. “Relief Programs: When It May Be Better to Give Food Instead of Cash.” World Development 24 (1): 91–96.
- CaLP. 2021. Good Practice Review on Cash Assistance in Contexts of High Inflation and Depreciation. CaLP.
- Castaneda, T. 2000. The Design, Implementation and Impact of Food Stamps Programs in Developing Countries. Nutrition Toolkit No.6. Washington, DC: World Bank.
- Coate, S. 1989. “Cash Versus Direct Food Relief.” Journal of Development Economics 30 (2): 199–224.
- Creti, P., and S. Jaspars, eds. 2006. Cash Transfer Programming in Emergencies. Oxford: Oxfam.
- Davies, S., and J. Davey. 2008. “A Regional Multiplier Approach to Estimating the Impact of Cash Transfers on the Market: The Case of Cash Transfers in Rural Malawi.” Development Policy Review 26 (1): 91–111.
- De Matteis, A. 2006. Market Functioning in Turkana District, Kenya. Nairobi: Oxfam.
- De Matteis, A. 2007. Feasibility Study for Cash Transfers in Swaziland. An Analysis of Market Functioning. Mbabane: Save the Children.
- De Matteis, A. 2011. Giving Choices to Earthquake Survivors Outside Port-Au-Prince. Final Evaluation of Mercy Corps’ Market Fair Program in Haiti. Port-au-Prince: Mercy Corps.
- De Matteis, A. 2012. Using Food Aid to Stimulate Markets in Pastoral Areas. Market Assessment into the EC Food Facility Programme in Northern Kenya. Nairobi: Save the Children.
- De Matteis, A. 2014. “Preferred Form of Food Assistance in Remote Resource-Poor Areas: The Case of Arid Lands in Kenya.” Journal of Development Effectiveness 6 (2): 167–195.
- De Matteis, A., F. Ellis, and I. Valdes. 2017. “The Relevance of Market Prices for the Design of Transfer Programs in Response to Food Insecurity.” The Quarterly Review of Economics and Finance 66: 202–211.
- De Matteis, A., and P. Holdsworth. 2009. Assessment to Advise DG ECHO’s Future Food Aid / Food Security Strategy in Southern Sudan. Bruxelles: Agrer.
- De Matteis, A., F. B. Turkmen Ceylan, and B. Kebede. 2021. “Market Resilience in Times of Crisis: The Case of Darfur.” Review of Development Economics 25 (3): 1107–1127.
- DG ECHO. 2022. Cash Transfers. Thematic Policy Document n.3. Bruxelles: DG ECHO.
- Dorosh, P., H. Wang, L. You, and E. Schmidt. 2008. Crop Production and Road Connectivity in Sub-Saharan Africa: A Spatial Analysis. Africa Infrastructure Country Diagnostic Working Paper N.19. Washington, DC: World Bank.
- Dreze, J., and A. Sen. 1989. Hunger and Public Action. Oxford: Oxford Clarendon Press.
- Faminow, M. 1995. “Issues in Valuing Food Aid: The Cash or In-Kind Controversy.” Food Policy 20 (1): 3–10.
- Garcia Castillo, J. 2020. “Deciding Between Cash-Based and In-Kind Distributions During Humanitarian Emergencies.” Journal of Humanitarian Logistics and Supply Chain Management 11 (2): 272–295.
- Gentilini, U. 2007. Cash and Food Transfers: A Primer. Occasional Paper n.18. Rome: WFP.
- Heaslip, G., I. Haavisto, and G. Kovacs. 2016. “Cash as a Form of Relief.” In Advances in Managing Humanitarian Operations, edited by C. Zobel, N. Altay, and M. Haselkorn, 59–78. Cham: Springer.
- Juillard, H. 2018. Minimum Standards for Market Analysis (MISMA). CaLP.
- Lall, S., H. Wang, and T. Munthali. 2009. Malawi Country Economic Memorandum: Seizing Opportunities for Growth Through Trade. Volume II: Infrastructure Investment in Malawi. Insights from Spatial Analysis. Washington, DC: World Bank.
- Lentz, E. C., C. B. Barrett, M. I. Gomez, and D. G. Maxwell. 2013. “On the Choice and Impacts of Innovative International Food Assistance Instruments.” World Development 49: 1–8.
- Levine, S. 2017. Markets in Crises: The Implications for Humanitarian Action. HPG Report. London: ODI.
- Maxwell, D., H. Stobaugh, J. Parker, and M. McGlinchy. 2013. Response Analysis and Response Choice in Food Security Crises: A Roadmap. HPN Network Paper n.73. London: ODI.
- Mohiddin, L., M. Sharma, and A. Haller. 2007. “Comparing Cash and Food Transfers: Findings from a Pilot Project in Sri Lanka.” Field Exchange 30: 19–21.
- Peters, K., S. Silva, R. Gonçalves, M. Kavelj, H. Fleuren, D. den Hertog, O. Ergun, and M. Freeman. 2021. “The Nutritious Supply Chain: Optimizing Humanitarian Food Assistance.” INFORMS Journal on Optimization 3 (2): 200–226.
- Reutlinger, S. 1984. “Project Food Aid and Equitable Growth: Income-Transfer Efficiency First!” World Development 12 (9): 901–911.
- Reutlinger, S., and J. Katona-Apte. 1984. “The Nutritional Impact of Food Aid: Criteria for the Selection of Cost-Effective Foods.” Food and Nutrition Bulletin 6 (4): 1–10.
- Ryckembusch, D., R. Frega, M. Silva, U. Gentilini, I. Sanogo, N. Grede, and L. Brown. 2013. “Enhancing Nutrition: A New Tool for Ex-Ante Comparison of Commodity-Based Vouchers and Food Transfers.” World Development 49: 58–67.
- Sharma, M. 2006. An Assessment of the Effects of the Cash Transfer Pilot Project on Household Consumption Patterns in Tsunami Affected Areas of Sri Lanka. Washington, DC: IFPRI.
- Sivakumaran, S. 2012. Market Analysis in Emergencies. CaLP.
- Timmer, C. P., W. D. Falcon, and S. R. Pearson. 1983. Food Policy Analysis. Baltimore: John Hopkins University Press.
- United Nations Department of Safety and Security. Weekly Travel Advisory, Various Issues. http://dss.un.org/dssweb/.
- World Bank. 2009. Eastern Africa: A Study of the Regional Maize Market and Marketing Costs. Report No.49831-AFR. Agriculture and Rural Development Unit (AFTAR). Washington, DC: World Bank.
Appendix
Table A1. Similarity of WTT distributions.
Table A2. WTT estimates.