
ABSTRACT
Data availability plays a crucial role in the fight against poverty. Yet, it lags behind the data available on most other economic phenomena. This paper catalogs and reviews existing data availability for low- and middle-income countries with a view to break the cycle of outdated poverty data and strengthen statistical systems – while drawing readers’ attention to existing information and experiences. Countries that generate and analyze frequent and accurate poverty data are identified to show what is possible and to better document what is already available. Results show that data for both monetary and multidimensional poverty dramatically increased since 1980. Sixty countries already produce annual updates to key statistics, and some have continuous household surveys with cost-cutting synergies. International agencies have explored short surveys for comparable data but the success and uptake of these have not followed expected patterns. Certain regions have agreed on harmonized variable definitions across countries, and new technologies reduce lags between data collection and analysis. These existing resources and experiences can inform much-needed efforts to expand data availability.
JEL:
Introduction
The COVID-19 pandemic has created a setback in global poverty trends – but where are the data to probe these trends? Data on poverty are severely limited both in terms of frequency and coverage. The limitation in frequency is especially striking when compared to the data availability concerning other economic phenomena. GNI data are published annually,Footnote1 while inflation and external debt statistics are available on a quarterly basis. Stock market data are made public every day, and with the invention of high-frequency trading, it has become available for investors at the fraction of a second. Dissatisfied with this disparity, the post-2015 development agenda identified the need for regularly updated data to monitor Sustainable Development Goals (SDGs), the first of which is ending poverty in all its forms. In the context of the pandemic, which set a landmark in the data landscape, this paper exhaustively catalogs and reviews the poverty data from international multi-topic surveys that could be used for poverty measurement and analyses, from their inception through early 2020 – that is, up until the brink of the pandemic. While many energetic efforts have been initiated during the pandemic, the data organization in this paper fills an ongoing gap to landscape existing data that could illuminate poverty trends, and interlinkages across indicators, across developing countries.
In using the term poverty in this paper, we signify both monetary and multidimensional poverty.Footnote2 For example, the $1.25/day poverty measure reflected money poverty and was published for 115 countries using data 2000–2012; the $1.90 is published for 118 developing countries 2000–2012.Footnote3 The global Multidimensional Poverty IndexFootnote4 complements the $1.90/day measure by measuring multidimensional poverty and has been published for over 120 countries. In an open letterFootnote5 to the High Level Panel advising the United Nations on the content of a post-2015 development agenda, more than 120 Southern non-governmental organizations stated their number one concern was that ‘Poverty is multidimensional and should not be narrowly defined and measured only as a matter of income.’ The final Sustainable Development Goals’ first two targets under the first goal include (a) a target of eradicating $1.25/day poverty and (b) a target focused on ‘poverty in its many dimensions’. The data requirements to monitor progress in poverty in several dimensions are the focal issue of concern in this paper.
Nearly every country in the world uses household surveys to produce its poverty statistics, whether these are income or consumption poverty, or multidimensional poverty. Thus, in this paper, we limit the scope to poverty data based on household surveys; elsewhere we have considered insights that other data sources can contribute (Alkire and Samman Citation2014).
In spite of the explosion of economic data availability, many authors studying various dimensions of poverty have brought to light data limitations.Footnote6 In terms of frequency, poverty data continues to lag behind other economic information, as it is often collected only every three to ten years – and often published a full year or two after data collection is finished. In terms of coverage, by and large most poverty datasets still miss information on important dimensions of poverty such as violence, empowerment or informal work – as well as key indicators such as quality of services (Alkire Citation2007). But on the other hand, some available data are only scantily analyzed. For example, even when multiple poverty indicators are available from the same survey, most indicators are analyzed in a dashboard style, ignoring how many multiple interconnected deprivations individual people or households experience, and consequently providing little information for integrated, cross-cutting or coordinated policy responses.
This situation does not meet the demands of policy. Managing initiatives that reduce poverty requires timely data to plan, monitor, evaluate, and re-design policies. Management requires recent data that are cleaned and analyzed promptly – and analyses that provide information in the form required for policy coordination and integrated multi-sectoral response.
Despite the limitations of currently available data, there are more poverty data for developing countries now than in any previous period in history. For example, this paper identifies 121 developing countries with monetary poverty data and 137 countries with multi-topic household survey data. Further, the content of that data has expanded significantly, including data from the same survey, and the patterns of its expansion seem to be catalyzed in part by data needs of the MDGs (Cassidy Citation2014) and SDGs.
The aim to increase the periodicity and timeliness of household surveys is longstanding. Attempts at innovations have had mixed results, yet these experiences – both negative and positive – are illuminating.Footnote7 This paper traces recent developments in certain household surveys, showing their tremendous rise since the 1980s, yet observing that the gaps in poverty data remain a key constraint in the fight against poverty. It then describes national annual surveys including some which are both nationally produced and create comparable indicators. It also discusses shortened surveys (KIS, Interim DHS and CWIQ) promoted by international agencies, and closes with examples of how time-saving survey technologies support data collection at decreased cost. Taken together these examples shed some light on the question of whether a step-change in the generation of poverty data, and its effective use to eradicate poverty, might come to pass – and if so, what avenues might be pursued.
Existing poverty data: level and trends
Poverty data for developing countries have made huge leaps in the last thirty years.Footnote8 There are more data now than in any previous period in history. Further, the content of that data has expanded significantly, with the patterns of its expansion fueled by widened national priorities and capabilities and also by international interest in topics including the SDGs. Surveys are just one source of poverty data. Many countries have data for key SDG indicators from multiple sources: census data; survey data (both national survey data and international, i.e. from DHS, MICS, CWIQ and LSMS) and administrative data. There is also an active exploration of the potential of ‘big data’ to improve sampling frames and to provide poverty-relevant indicators, such as electricity and road access.Footnote9
Here, we document the dramatic rise in poverty-related household surveys in developing countries since 1980.Footnote10 The good news of this rise is certainly to be celebrated. We track the surveys that have been completed, and which have issued reports. A great (and desirable) degree of data availability occurs in circumstances in which the micro-data are available. Micro-data are publicly available, or available upon request for some of the surveys included (most DHS and MICS), but not others.
While such a review could include many survey forms including labor force surveys or those fielded in OECD countries, we focus here on the rise of household surveys in developing countries that can be used to analyze monetary poverty or that address at least three dimensions related to multidimensional poverty. We focus on two periods: 1980–2020 in the case of monetary poverty data, and 1985–2020 for multidimensional poverty data.
Household surveys for monetary poverty, 1980–2020
The precise number of available household surveys that are exclusively or partially concerned with household income or consumption and expenditure is hard to determine since a myriad of online search engines and survey networks currently exist. They include poverty data that is collected at different moments in time, on disparate administrative levels and using divergent data gathering methods. To illuminate the field while seeking data quality, we have restricted the analysis of monetary household surveys to those listed on the main page of PovcalNet, the World Bank’s regional survey aggregation website.Footnote11
As the left panel of indicates, the absolute number of income or consumption and expenditures surveys, as well as the absolute number of countries with such monetary surveys, have dramatically increased from the early 1980s until 2020.Footnote12 By the procedures followed in the study, survey data on income or consumption and expenditure are available for 121 countries.Footnote13
Figure 1. Monetary surveys; cumulative and number per year.
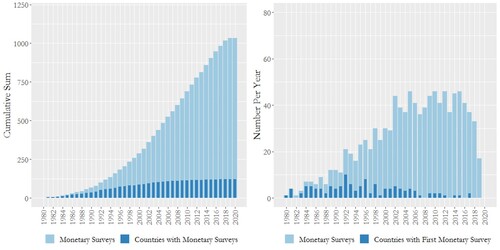
The right panel of shows the number of ‘new’ surveys fielded each year and number of ‘new’ countries gaining surveys each year. These marginal increases were greatest during the late 1980s and the mid-1990s respectively.
In total, 1,033 monetary surveys are listed during the period 1980–2020. The country with the highest number of surveys in this period is Brazil (35), followed by Costa Rica (33), Romania (33), and Honduras (31).
Household surveys for multidimensional poverty, 1985–2020
Many surveys are fielded which collect SDG-related or deprivation-related information related to services, but not necessarily on monetary poverty. Due to restrictions with regards to information on data coherence, quality, and availability, a comprehensive overview of all existing national multidimensional household poverty surveys cannot be provided. There is no equivalent to PovcalNet for multidimensional poverty datasets.
For the purposes of this paper, we have simply identified seven major multidimensional surveys for quantitative analysis and listed their trajectory since 1985 (the earliest date of surveys). Each of these surveys fulfills the following three criteria: (1) The survey must measure at least three aspects of well-being (such as health and nutrition, education, living conditions, or employment); (2) The survey must be relevant for the comparative study of [some] developing countries; (3) The survey must be widely used and provide high-quality data.
Four surveys to which these criteria apply are the Demographic and Health Surveys (DHS), which collects data on population, health, HIV, and nutrition; the Core Welfare Indicator Questionnaire surveys (CWIQ) which collect information on household well-being and basic community services; the Multiple Indicator Cluster Surveys (MICS) which monitor the situation of women and children, particularly with regards to health and education. The Living Standards Measurement Study (LSMS) office of the World Bank provides technical assistance to many surveys that are not listed as LSMS; we include LSMS surveys listed on their website which measure consumption behavior, economic well-being, and a variety of sectoral aspects such as housing, education and health.Footnote14 We also include World Health Surveys (WHS) alongside surveys listed in International Household Survey Network (IHSN) as Integrated Survey (non-LSMS) or Integrated Living Conditions Survey (ILCS).
Together these contribute 992 surveys. Just as the monetary surveys included income or consumption based on various definitions, so do not the surveys reported here all contain the same indicators or definitions. The number of each kind of survey, and country coverage, appear in ; a list by country appears in Appendix A.
Table 1. Major multi-topic surveys.
It must be noted that these seven surveys do not include the extensive multi-topic household surveys that have been completed at national levels to investigate quality of life, social indicators, and living conditions. To create a catalogue of multi-topic surveys that include national surveys it would be necessary to construct the relevant criteria and apply these to multiple data banks. Appendix B introduces 14 data portals that might be consulted for such a task, as well as a series of datasets organized by region.
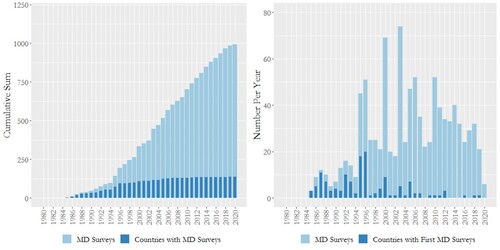
The left panel of shows that even using just this cross-section of surveys, the number of multidimensional household poverty surveys has increased dramatically since 1985 and now covers 137 countries. As we see from the right panel, major increases of both multidimensional surveys and the countries with multidimensional surveys occurred during the mid-1990s, 2000, 2005, and 2010 – corresponding with the rollout of successive phases of the MICS surveys. Of the 992 surveys listed here, Malawi (34) and Tanzania (31) have the highest number of surveys.
Figure 2. Multidimensional surveys; cumulative and number per year.
From this brief and incomplete review, we can nonetheless observe the strong rise in data availability for both monetary and multidimensional poverty since the 1980s. The strong gains since the 1980s, and the increase in pace since 2000, all show that household surveys have not at all been static. But has this salutary progress been sufficient? The resounding consensus is that it is not.
Ongoing limitations: content, quality, frequency, timeliness and availability
Existing data on poverty remains limited – particularly in terms of content as they overlook key indicators, data quality which is variable; frequency of surveys, timeliness of data publication and analysis, and availability of that data.
A thorough review of these issues is not presented here, for many have already identified them in depth and the Data Revolution, which the High Level Panel summoned, has caught the imagination of many. This section simply reminds the readers of the points made in a myriad of studies.
In terms of frequency, as mentioned above, poverty data tend to be relatively infrequent. Coverage is restricted as poverty data still misses information on important dimensions of poverty such as violence, empowerment or informal work. Even information on basic variables like health remains severely limited. Also, most poverty analysis does not address the interconnectedness of deprivations that lock people into poverty. The first key message in The MDGs at Mid-point – a 50-country study on accelerating progress that the UNDP released in Citation2010 – was that successful countries had addressed different deprivations together because of these interconnections. The joint distribution of deprivations – which can be seen using multi-topic surveys – can be analyzed to inform joined-up policies – through multidimensional analyses.
Many examples have been used to show the scale of the problem. For example, India had no publicly available and nationally representative official multidimensional micro-data between 2005/6 and 2015/16. SDG assessments of data availability observed severe gaps in the ability of most countries to report trend data on many SDG indicators. This is not new: in the previous era, the mid-point assessment of the MDGs led by an eminent group of economists observed that:
Many, among the poorest and most vulnerable countries, do not report any data on most MDGs. When it is available, data are often plagued with comparability problems, and MDG indicators often come with considerable time lags. Improving data gathering and its quality in all countries should be a central focus of the second half of the MDG time frame and beyond. Reliable data and indicators are essential, not only to enable the international development community to follow progress on MDGs, but also for individual countries to effectively manage their development strategies. Bourguignon et al. (Citation2008, 6)
While efforts to improve poverty data have increased the content and frequency of poverty data, attention is drawn to ongoing data gaps again and again, for example in the final report on the MDGs:
Despite considerable advancements in recent years, reliable statistics for monitoring development remain inadequate in many countries. Data gaps, data quality, compliance with methodological standards and non-availability of disaggregated data are among the major challenges to MDG monitoring. United Nations (Citation2014)
Notwithstanding the visible lack of poverty data, in some cases, funds are invested in multi-topic household surveys that are never fully analyzed – perhaps because their content, or the timeliness of data cleaning and publication, did not meet policy needs. The issue of data creation and its use for policy must thus be considered together.
Experiences in annual multi-topic household surveys
The previous section addressed the steep rise in the number of countries having at least one data point, as well as of multiple data points. This section now focuses on experiences in more frequent data collection, reporting, analysis and policy use.
National surveys
Many countries have frequent household survey instruments in place for some core indicators of human poverty.Footnote15 However, there does not seem to be a publicly accessible and complete record of these surveys internationally.Footnote16 Yet despite the perception that annual or biennial data are very rare, we have encountered quite a range of such experiences.
A few countries update a wide range of poverty data regularly. For example, Colombia updates both official income and multidimensional poverty data and statistics annually and Mexico does so every two years. The European Union Statistics on Income and Living Conditions (EU-SILC) described more fully below, provide annual official updates of the EU-2020 multidimensional poverty and social exclusion indicators – covering quasi-joblessness, material deprivation, and being at-risk-of (relative) income poverty – for over 30 countries.
More commonly, the annual surveys either primarily collect monetary poverty data or primarily cover some dimensions of poverty but do not include detailed income or consumption and expenditure modules. For example, India’s National Sample Survey (NSS) provides annual updates of consumption poverty, with a large round for greater disaggregation roughly every five years. Pakistan’s Social and Living Standard Measurement Survey (PSLM) fields annual surveys, alternating between two questionnaires and between district- and province-level disaggregation potentials.
Some countries have moved to higher-than-annual frequency: Indonesia’s SUSENAS collects consumption poverty data every quarter and releases poverty statistics twice per year. Ecuador has a multi-topic survey that provides three nationally representative statistical updates per year, and at lower levels of disaggregation annually.
presents an incomplete list of annual surveys that are implemented by national statistics offices. It covers 60 countries and surely excludes some existing experiences.Footnote17
Table 2. Sixty Annual Household Surveys.
This list does not exhaust relevant cases, and would be much longer, if the period is extended slightly. A number of countries field surveys every two years rather than annually. In addition to Mexico, these include Viet Nam’s Household Living Standard Survey, Nicaragua’s Encuesta Nacional de Hogares sobre Medición de Nivel de Vida, Thailand’s Household SocioEconomic Survey, and Malaysia’s Household Income and Basic Amenities survey, which is fielded twice in five years.
Continuous national household sample surveys
A challenge of data collection is that not all indicators require annual updates. Certain indicators change slowly so require updating only every three to five years. Some indicators require a long and detailed questionnaire, or a different sample design to focus on a particular subgroup. In some cases, if comprehensive data are available occasionally, estimates can be computed based on variables available in shorter interim surveys (as SWIFT, explained below, is doing for consumption poverty). There are also varying needs for disaggregated data. For these reasons, if management capabilities are sufficiently strong, the ideal institutional arrangement for high-frequency data is the ‘continuous’ national household sample survey, which may have a core module of high-frequency indicators, and rotating modules according to the specific indicator needs. They may also schedule regular but distinct surveys (labor force, agricultural, or health surveys for example).
Indonesia, Ecuador, and others countries including Brazil,Footnote18 have what can be called ‘continuous household surveys’ in that the survey teams are in the field more or less continuously with different surveys and modules. When management capacity is adequate, data quality and availability increases in a way that is cost-saving and coordinated. Different surveys are drawn from a master sample, normally can be aggregated for more in-depth disaggregation, and may have a panel element. In addition to these continuous national household surveys, there is also a ‘continuous DHS’ – which has been implemented in Peru and in Senegal.
While annual updates of poverty figures are not yet the norm, these examples demonstrate their feasibility. In addition, evidence from the 2008 financial crisis suggests that these high-frequency surveys were ‘a good means of gauging the expenditure impacts of shocks and even some of the specific coping mechanisms involved’ (Headey and Ecker Citation2013, 332). However, the national surveys mentioned above are not comparable to one another. Furthermore, they focus primarily on consumption/expenditure or income data and omit many other core indicators of human poverty. We turn now to various initiatives to generate internationally comparable data, and annual data on these other aspects of poverty.
Internationally comparable short surveys
The Demographic and Health Surveys (DHS) and Multiple Indicator Cluster Surveys (MICS) have increased in prominence due to their quality, quantity, and comparability, their free public availability, as well as the match between these surveys and key MDG indicators. Because of their data quality, they are used in academic research. Corsi et al report: ‘A … systematic review found that 1117 peer-reviewed publications using DHS data have appeared in more than 200 journals, between 1984 and 2010’ (Citation2012, 1607). Yet, because the DHS and MICS are fielded every 3–5 years (DHS on average just over 5 years; MICS every 5 years in the past, but are moving towards every 3 years), and their cleaning and standardization require some time, they are not designed for annual reporting.
This fact has been overtly recognized and acknowledged by these institutions, which have explored various responses. Their responses are relevant to present discussions. For example, due to the length of the DHS, the DHS office set up the Key Indicator Survey (KIS)Footnote19 whose purpose was to monitor key health and population indicators at a lower level of disaggregation, e.g. districts. KIS questionnaires are ‘designed to be short and relatively simple, but also to be able to produce indicators comparable to those from a nationally representative … DHS (see Table 3 for an overview of the indicators).’ KIS topics cover family planning, maternal health, child health, HIV/AIDS, and infectious diseases. Their design and content are highly relevant to certain proposed SDG indicators – but they were never fielded. The reason why they were never fielded is that in fact, if a survey was rolled out, the reach was expanded to include many additional indicators. Thus, the lack of adoption of KIS indicates a hunger for data, which is positive. Nevertheless the uptake of shorter surveys could expand if data collection became more regular overall (as has indeed occurred using the remote rapid surveys during the pandemic). The KIS questionnaire and design thus remain a potential resource for this conversation to re-engage.
Table 3. The 20 indicators of KIS.
DHS also set up Interim DHS, which ‘focus on the collection of information on key performance monitoring indicators’. Designed to be nationally representative using smaller sample sizes than most DHS surveys, Interim DHS have shorter questionnaires and are conducted between DHS rounds. The Interim DHS surveys have been fielded in Egypt, Guatemala, Jordan, and Rwanda, but again, did not have an enthusiastic take-up. However, like KIS, the survey and sample design are available and can enrich present discussions.
The Core Welfare Indicators Questionnaire (CWIQ) was developed at the World Bank in late 1990s to collect data on the access, usage, and quality of services more frequently than LSMS.Footnote20 The core module took roughly 40 min, including anthropometry. At that time, the documents for the CWIQ reported that each household cost $54 in the pilot test reducing to $30 in full survey. Mechanisms to foster data quality included enumerator training and rapid feedback from the questionnaires, which were machine-read, reducing data entry time, and improving accuracy. Timeliness of data and reporting was also stressed, with results being available 6–8 weeks from the end of the fieldwork. Although designed as a stand-alone survey, in many cases, the CWIQ came to be fielded together with a household budget survey or other module, thus losing its quick-ness, but gaining through complementary data. As in the case of KIS, the temporarily expansion of CWIQ is not necessarily a negative finding, given the current infrequency of data collection. An independent evaluation of the CWIQ does not appear to have been conducted, so the status and assessment of this initiative – ranging from the cost to data quality to spread effects such as capacity building – are not yet clear, but could be important to understand for similar initiatives.
These examples – KIS, I-DHS and CWIQ – draw attention to the need to understand fully the ‘demand’ for and ‘inhibitions’ to shortened surveys before embarking. However, they also offer a set of resources on potential questionnaire design and content for consideration in light of the SDGs.
Regional annual surveys with harmonized indicator definitions
The examples above did not address the difficult question of the comparability of survey data across countries. The tradeoff between greater national accuracy and comparability over time (with previous surveys), and greater international comparability, are well-known. What may not be so well-known are the positive examples of annual or biennial surveys that are fielded by NSOs and do include a core of comparable questions.
A noteworthy and rich example for the SDG discussions are the MECOVI surveys in Latin America, which have developed partially harmonized data on 24 Latin American and Caribbean countries for the analysis of poverty and inequality. In many but not all countries, new surveys are fielded annually.Footnote21 Launched in 1996 and ongoing to this day, MECOVI has increased the capacity of the national statistical systems in undertaking and disseminating analyses from multi-topic household surveys, whilst providing timely and comparable data on key economic, social and living standards indicators. The MECOVI country surveys are not identical, but do cover core variables. In partnership with the World Bank IBRD, and CEPAL, a research center CEDLAS, at University of La Plata, provides support for the harmonization and comparative analysis, including preparation of the SEDLAC database. This database also (like Oxford Poverty and Human Development Initiative's (OPHI) database on the MPI, but focused on this region) includes maps with subnational details of key indicators. The MECOVI programme is longstanding and thoroughly-evaluated, so provides a rich resource for present conversations.
Another relevant example is that of EU-SILC. The European Union Statistics on Income and Living Conditions (EU-SILC) publish annually, timely and comparable cross-sectional and longitudinal multidimensional micro-data on income poverty, social exclusion, and living conditions, now for over 30 countries.Footnote22 Anchored in European Statistical System, the EU-SILC project started in 2003 and is ongoing. It may be of interest for the SDG monitoring options because EU-SILC data have been used since 2010 to monitor poverty and social exclusion in the EU towards a target: ‘A headline poverty target on reducing by 20 million in 2020 the number of people under poverty and social exclusion has been defined based on the EU-SILC instrument.’Footnote23
The EU-SILC is replete with interesting lessons. For example, many surveys are only representative at the national level, but some sample sizes are much larger. Certain questions (e.g. levels of education, self-reported health status) may still be difficult to compare across countries (Alkire, Apablaza, and Jung Citation2014) – an issue that future surveys may address. Also, the use of registry data alongside survey data has been explored in the EU-SILC project, and studies have shown both the potentials and significant difficulties of registry data for poverty monitoring.
One key feature of the EU-SILC process, which could be of tremendous relevance to the SDGs, was the open method of coordination. This method balanced national priorities with progressive harmonization of data and targets.
The open method of coordination, which is designed to help member states progressively to develop their own policies, involves fixing guidelines for the Union, establishing quantitative and qualitative indicators to be applied in each member state, and periodic monitoring. (Atkinson et al. Citation2002, 1–5)
It may be that for the SDGs, some degree of harmonization across indicators could be advanced in a similar process, at least for some regional or other country groupings. In any case, given the challenges arising from the MDGs’ more top-down measurement agenda, familiarity with alternative processes of data harmonization could be useful.
New technologies: supporting data and transparency
The initiatives reviewed thus far build on tried and tested survey methodologies. In some cases, newer technologies are in use, but by no means in all. New technology has made it possible to extend the reach and speed up the availability of the data, creating a veritable ‘revolution’ indeed. Longer treatments of these technologies with additional examples are collected in a very useful Paris21 Review paper Knowing in Time (Prydz Citation2014). Here, we focus mainly upon the use of new technologies to facilitate data entry, uploading, analysis, and visualization. However, it should be noted that some important changes to the consent form and survey – for example, retaining the cell phone numbers of respondents for a given set of months – could facilitate monitoring in case of a shock or disaster, by re-contacting respondents with a mini-panel question to ascertain changes in status.
The other bottleneck that these new initiatives are addressing is survey length. For example, a standard consumption/expenditure questionnaire provides a wealth of information on topics ranging from consumption patterns to dietary diversity, to the percentage of income spent on various items, to inequality and distributional issues, and can be analyzed in many ways. Yet if interim annual income and expenditure surveys are used primarily to determine whether or not an individual is income poor, it may be possible to derive this poverty status using shorter modules and imputation, leaving space in surveys to address other core indicators of the SDGs in the years when full consumption/expenditure details are not required.
In terms of promptness and availability, survey programmes have made some important advances, particularly given the more widespread use of Computer-Assisted Personal Interviewing (CAPI) and cloud-based technology. CAPI has a number of features that bolster efficiency and accuracy.Footnote24 The immediate transfer of data to central offices permits their immediate analysis. Moreover, such technology is linked with fewer coding errors (as the programme can query errors); enables last-minute updates or corrections to questionnaires; permits dynamic questionnaires (e.g. that enable experiments or asking particular questions based on previous responses); let respondents answer sensitive questions directly without being witnessed and enables more efficient enumerator management.
A signally relevant and rich potential instrument also under development at the World Bank is called the Survey of Welfare via Instant Frequent Tracking (SWIFT). Using a projection method, SWIFT imputes poverty and inequality indicators using models that are calibrated using a country’s previous LSMS or HBS and implemented using core non-monetary indicators. SWIFT has also proposed to include directly the indicators required for a post-2015 MPI (multidimensional poverty index), and questions on subjective well-being (OECD) and consumer sentiment (Eurostat). SWIFT is also taking advantage of CAPI and cloud-based technology to enable the efficient and timely collection, transfer, analysis and release of data.
Other cutting-edge and serious experiments are being undertaken using mobile phones as the medium for a serious of questions on different aspects of well-being (Croke et al. Citation2012).Footnote25 Driven by the same needs as those that motivate the move towards annualized household survey data collection, these forays into ‘high frequency’ survey data are quite certain to strengthen if not transform SDG data collection considerably over the coming decade, but will not replace household surveys in the short and medium term.
Other data collection methods using new technologies explore how to involve the ‘respondents’ more actively in both the data collection and its analysis, so that they – as well as other institutions – can be lead agents of poverty reduction. For example, Paraguay’s Poverty Spotlight are featuring similar technologies – having devised a 20-min visual survey methodology that enables people who are poor to create innovative maps showing the dimensions in which they are poor by using stoplight colors (red, yellow, green), photographs, maps electronic tablets and simple software.
A final note concerns the promptness and availability of the SDG indicators’ publication and construction themselves. Often there is a great silence after data collection has closed before the data are released – a gap the CAPI-cloud technology could shrink. Yet, there is a second delay before the release of official statistics based on those data. Again, some pioneering examples are worth considering. Mexico’s lead institution on poverty measurement and monitoring, CONEVAL, obtains the data from ENIGH (Encuesta Nacional de Ingresos y Gastos de los Hogares). By their own presentations, CONEVAL prepares the official multidimensional poverty statistics (which include income poverty) nationally and by state two weeks after receiving the cleaned data.Footnote26 Not only that, but without great delay, the programmes used for calculating poverty are made publically available in STATA, SPSS and R languages, together with a technical note, on the CONEVAL website.Footnote27 Thus, academics and technicians can run the programme on the micro-data set (which is also publicly available) to understand, verify the national poverty estimations, and to study and further analyze them. Ecuador’s INEC has a similar online portal with data, algorithms, and poverty analyses.
Conclusion
The move to more frequent reporting of the SDGs is a serious proposition, replete with challenges. There are likely to be shortfalls from the ideal. Yet observing that 60 countries already update data annually, annual updating of a small core set of appropriate poverty-related indicators, and the production of reliable statistics from these data, seems feasible for many countries, and two- to three-year updates of core indicators feasible for nearly all countries – especially since prominent surveys like DHS and MICS are also moving in this direction. The frequent reporting of good quality data with timely data publication and analysis would greatly increase the relevance of measures of poverty to ‘managers’ and policy makers, and these in turn would spark a virtuous cycle. Making micro-data and program files available would increase transparency and increase data analysis by other actors at little cost.
Because of serious and legitimate concerns regarding the realism of increasing data frequency whilst guarding or also increasing the quality of both data and statistics, this section has reviewed a set of positive and negative experiences. We observed that many countries, rather un-noticed, already have annual surveys of some type – and named 60 of them. Most but not all of these are upper middle- and high-income countries. A particularly rich experience appears to be continuous household surveys, which offers the flexibility to update indicators when warranted, decreases issues of seasonality (by fielding over 12 months), and may be more cost effective.
We also observed the challenges faced by international survey initiatives, and the resources already developed for rapid surveys, but these are not cited in the literature calling for more frequent data collection. The hesitant uptake of short surveys points to a hunger for data – which we view to be a real but transitory issue that could subside if data frequency rose. We also reviewed positive examples of nationally implemented yet harmonized indicators which address the need for country ownership and comparability – such as MECOVI and EU-SILC. Both initiatives have interesting processes including data harmonization, financing, the governance roles of international and national bodies, the ongoing role of technical support and a central and standardized data repository. They also are useful to study because they also face ongoing limitations in data quality, sample size, use of registry data, and panel components.
Moving beyond these to consider the timeliness of data, and of non-income indicators, we presented the emerging SWIFT initiative in the World Bank, which fields a short questionnaire to permit the modeling of monetary poverty and direct measurement of multidimensional poverty in a short survey. Aware of the need to communicate poverty results so that they energize and motivate local communities as well as policy makers, we shared the Paraguayan stoplight survey. Finally, in the interests of encouraging transparency of analysis, we shared leading example from countries such as Mexico and Ecuador that post the Stata/SPSS/R files used to compute monetary and multidimensional poverty online, and of generating official national poverty figures rapidly after data release.
This paper skips over many additional vital topics upon which others have written, such as the sequencing of countries moving towards annual surveys, and the important issue of how an increase in data frequency and accuracy can be used to strengthen national statistical systems. Despite these gaps, we hope that the existing conversations, which must address these and other difficult questions, will be facilitated by the information shared here.
Acknowledgements
We are grateful for comments or insightful suggestions from Tony Atkinson, K. Beegal, Gero Carletto, Enrico Giovannini, Attila Hancioglu, Sunita Kishor, Claire Melamed, Jeff Sachs, Emma Samman, Umar Serajuddin and Hiroki Uematsu; and to the Sustainable Development Solutions Network (SDSN) for support. We are also deeply grateful to OPHI colleagues for stellar research assistance and reflective advice, in particular to Felix Stein, Gisela Robles, Usha Kanagaratnam, Joanne Tomkinson Mihika Chatterjee and Christian Oldiges for careful research assistance and to Adriana Conconi, Bouba Housseini, Suman Seth and MPPN colleagues for substantive inputs. For financial support from ESRC/DFID (ES/N01457X/1) we are very grateful.
Disclosure statement
No potential conflict of interest was reported by the authors.
Additional information
Funding
Notes
1 Note that annual GNI data may be subject to issues of accuracy. For example, in 2014, the GNP of Nigeria was re-based. The World Bank’s Nigeria Economic Report (2014) suggest that ‘For the new base year of 2010, the assessed value of GDP increased by 60.7% relative to previous statistics. For 2011, 2012, and 2013, the assessed increases in the level of Nigerian GDP were 68.3%, 76.9%, and 88.9%, respectively.’ I am grateful to K. Beegle for this example.
2 Research addressing monetary and multidimensional poverty is vast. Earlier influential papers include: Atkinson (Citation1987), Foster, Greer, and Thorbecke (Citation1984), Kakwani (Citation1980) and Sen (Citation1976). For more recent work see: Alkire and Santos (Citation2013), Chen and Ravallion (Citation2010), Deaton and Dupriez (Citation2011), Kakwani and Silber (Citation2008) and Ravallion (Citation2017).
3 PovcalNet, corroborated by Umar Serajuddin and Hiroki Uematsu (December 2015).
4 The global MPI (http://www.ophi.org.uk/multidimensional-poverty-index/mpi-2016/) has been estimated and analysed by OPHI, a research centre in the University of Oxford, and published by UNDP’s Human Development Reports since 2010.
6 For example, papers addressing challenges surrounding data availability are: Glewwe (Citation2005), Amarante (Citation2014), Dhongde and Minoiu (Citation2013) and Lemmi et al. (Citation2019).
7 See Schündeln (Citation2018) for discussions on how data quality relates to the frequency of visits.
8 Some use the word poverty to refer to monetary disadvantage, and the word ‘deprivation’ to cover other disadvantages such as malnutrition, low education, ramshackle housing, and so on. We follow the terms used in recent post-2015 agenda documents, which refer to multidimensional poverty, or poverty in all its dimensions.
9 For further discussion of administrate data, public opinion surveys, and big data as resources for poverty data please see Alkire and Samman Citation2014.
10 We have excluded countries classed as high income by the World Bank, from the main analysis.
11 We have only used the surveys that included the labels: ‘expenditure’, ‘income/income and basic amenities’, ‘income inequality’, ‘budget/budgetary’, ‘household’, ‘consumption’, ‘labour force’, ‘panel surveys’, ‘integrated’, ‘poverty’, ‘priority survey’, ‘welfare’. We excluded all ambiguously or unmarked surveys as well as all surveys that included the labels: ‘agriculture’, ‘census’, ‘consumer finance’, ‘CWIQ’, ‘MICS’, ‘family life’, ‘health’, ‘energy’, ‘panel’, ‘manpower’, ‘housing’, ‘priority’, ‘social’, ‘informal sector’, ‘internally displaced persons’, ‘housing’, ‘service delivery’, ‘social indicators’, ‘social development’, ’socio-economic’, or ‘service delivery’.
12 In 2020, the totals for monetary surveys were 121 countries and 1033 surveys; the figures since 2020 are underestimates as many subsequent surveys have not yet been added.
13 This does not mean we have fully comparable poverty measures for all countries; the surveys generating income and consumption poverty figures are often tailored to national specifications. Still, what we see is a marked rise in data availability.
14 LSMS surveys also measure monetary poverty so are counted as both income and multidimensional surveys. In this period, there were 132 LSMS covering 36 countries, but as they are rarely the only survey in a country they do not affect the total number of countries covered.
15 In a linked paper with Alkire and Samman (Citation2014), we list in Appendix B a set of ‘core indicators of human poverty’ that would come from household survey data, in health and nutrition, education, living standard, work, and violence.
16 For example, in World Development Indicators, a total of 42 countries, both developed and developing, published income poverty data for at least five consecutive years between 2002 and 2012 – but in some cases these published figures are extrapolations, and other countries that have annual data are not included.
17 These are but a sample of surveys as of course other institutions and researchers also have rich data sources. For example, South Africa’s NIDS (National Income Dynamics Survey) is not an official national survey but still provides panel data roughly every two years.
18 Brazil’s PNAD has become a continuous national household sample survey: http://www.ibge.gov.br/english/estatistica/indicadores/trabalhoerendimento/pnad_continua/
19 The KIS website (http://dhsprogram.com/What-We-Do/Survey-Types/KIS.cfm) contains the survey modules.
20 http://web.worldbank.org/WBSITE/EXTERNAL/COUNTRIES/AFRICAEXT/EXTPUBREP/EXTSTATINAFR/0,,contentMDK:21104598~menuPK:3091968~pagePK:64168445~piPK:64168309~theSitePK:824043,00.html ; See also http://www.afdb.org/fileadmin/uploads/afdb/Documents/Publications/African.Statistical.Journal_Vol3_2.Articles_8.ExperiencesApplicationCoreWelfareIndicatorQuestionnaireCWIQ.pdf
21 Details by country are available on: http://www.cedlas.econo.unlp.edu.ar/wp/en/estadisticas/sedlac/estadisticas/
22 EU-SILC Data for 31 countries was available annually for 7 consecutive years between 2006 and 2012. These are: Austria, Belgium, Bulgaria, Croatia, Cyprus, Czech Republic, Denmark, Estonia, Finland, France, Germany, Greece, Hungary, Iceland, Ireland, Italy, Latvia, Lithuania, Luxembourg, Malta, Netherlands, Norway, Poland, Portugal, Romania, Slovakia, Slovenia, Spain, Sweden, Switzerland, United Kingdom.
24 See Caeyers, Chalmers, and De Weerdt (Citation2012) for experimental evidence relating to the advantages of CAPI over PAPI (pen-and-paper interviewing).
25 See also their briefing note on http://siteresources.worldbank.org/EXTPREMNET/Resources/EP102.pdf
26 Presentation by CONEVAL, Salamanca, 2013; confirmed by personal conversation with Gonzalo Hernandez Licona, President of CONEVAL.
References
- Alkire, S. 2007. “The Missing Dimensions of Poverty Data: An Introduction.” Oxford Development Studies 35: 347–359.
- Alkire, S., M. Apablaza, and E. Jung. 2014. “Multidimensional Poverty Measurement for EU-SILC countries.” OPHI Research in Progress 36c, Oxford University.
- Alkire, S., and E. Samman. 2014. “Mobilising the Household Data Required to Progress Toward the SDGs.” OPHI Working Paper 72, Oxford University.
- Alkire, S., and M. E. Santos. 2013. “A Multidimensional Approach: Poverty Measurement & Beyond.” Social Indicators Research 112 (2): 239–257.
- Amarante, V. 2014. “Income Inequality in Latin America: Data Challenges and Availability.” Social Indicators Research 119 (3): 1467–1483.
- Atkinson, A. B. 1987. “On the Measurement of Poverty.” Econometrica: Journal of the Econometric Society 55 (4): 749–764.
- Atkinson, A., B. Cantillon, E. Marlier, and B. Nolan. 2002. Social Indicators. The EU and Social Inclusion. Oxford: OUP.
- Bourguignon, F., A. Bénassy-Quéré, S. Dercon, A. Estache, J.W. Gunning, R. Kanbur, S. Klasen, S. Maxwell, J.P. Platteau, and A. Spadaro. 2008. “Millennium Development Goals at Midpoint: Where do we stand and where do we need to go?”. European Commission.
- Caeyers, B., N. Chalmers, and J. De Weerdt. 2012. “Improving Consumption Measurement and Other Survey Data Through CAPI: Evidence from a Randomized Experiment.” Journal of Development Economics 98 (1): 19–33.
- Cassidy, M. 2014. “Assessing Gaps in Indicator Coverage and Availability.” SDSN Briefing Paper, Paris and New York: Sustainable Development Solutions Network.
- Chen, S., and M. Ravallion, 2010. “The developing world is poorer than we thought, but no less successful in the fight against poverty.” The Quarterly Journal of Economics 125 (4): 1577–1625.
- Corsi, D. J., M. Neuman, J. E. Finlay, and S. V. Subramanian. 2012. “Demographic and Health Surveys: A Profile.” International Journal of Epidemiology 41: 1602–1613.
- Croke, K., A. Dabalen, G. Demombybes, M. Giugale, and J. Hoogeveen. 2012. “Collecting High Frequency Panel Data in Africa Using Mobile Phone Interviews.” Policy Research Working Paper 6097. The World Bank.
- Deaton, A., and O. Dupriez. 2011. “Purchasing Power Parity Exchange Rates for the Global Poor.” American Economic Journal: Applied Economics 3 (2): 137–166.
- Dhongde, S., and C. Minoiu. 2013. “Global Poverty Estimates: A Sensitivity Analysis.” World Development 44: 1–13.
- Foster, J., J. Greer, and E. Thorbecke. 1984. “A Class of Decomposable Poverty Measures.” Econometrica: Journal of the Econometric Society 52 (3): 761–766.
- Glewwe, P. 2005. “Chapter XVII Using Multi-Topic Household Surveys to Improve Poverty Reduction Policies in Developing Countries.” In Household Sample Surveys in Developing and Transition Countries (pp. 355–66).
- Headey, D., and O. Ecker. 2013. “Rethinking the measurement of food security: from first principles to best practice.” Food Security 5 (3): 327–343.
- Kakwani, N. C. 1980. Income Inequality and Poverty. New York: World Bank.
- Kakwani, N., and J. Silber. 2008. Many Dimensions of Poverty. London: Springer.
- Lemmi, A., D. Grassi, A. Masi, N. Pannuzi, and A. Regoli. 2019. “Methodological Choices and Data Quality Issues for Official Poverty Measures: Evidences from Italy.” Social Indicators Research 141 (1): 299–330.
- Prydz, E. B. 2014. “Knowing in Time; How Technology Innovations in Statistical Data Collection Can Make a Difference in Development.” Paris21, Discussion Paper No. 2. http://www.paris21.org/sites/default/files/PARIS21-DiscussionPaper2-Knowing.pdf.
- Ravallion, M. 2017. Poverty Comparisons. London: Routledge.
- Schündeln, M. 2018. “Multiple Visits and Data Quality in Household Surveys.” Oxford Bulletin of Economics and Statistics 80 (2): 380–405.
- Sen, A. 1976. “Poverty: An Ordinal Approach to Measurement.” Econometrica: Journal of the Econometric Society 44 (2): 219–231.
- United Nations. 2014. The Millennium Development Goals Report. New York: United Nations.
- UNDP. 2010. “What Will It Take to Achieve the Millennium Development Goals?: An International Assessment.” United Nations Development Programme (UNDP), United Nations.
Appendix
Appendix B – reviewed survey sources
This appendix has two parts. Section B.1 lists data portals which can be used to identify national multi-topic household survey data, together with brief descriptions of each portal. Section B.2 lists particular longitudinal multi-topic datasets that include and supplement the examples of EU-SILC and MECOVI covered in this paper.
B.1 data portals
Bureau for Research and Economic Analysis of Development (BREAD)
Type: Longitudinal
Regions: All continents
Unit level: Individual/household
BREAD, founded in 2002, is a non-profit organization dedicated to encourage research on development economics. Its website currently locates over 40 types of available household surveys and other data sources about developing countries.
http://www.ipl.econ.duke.edu/bread/
CCPR
Type: Mostly longitudinal/some cross-sectional
Regions: All continents
Unit level: Individual/household
Part of UCLA, CCPR’s Survey Database holds over 500 different census datasets and other population surveys from developing countries on demography and reproductive health. The datasets are grouped by regions and type of survey modules, ranging from income over migration and health measurements to time allocation.
Cross-National Equivalent File (CNEF)
Type: Longitudinal
Regions: Australia, East Asia, Europe, North America
Unit level: Individual
The CNEF contains equivalently defined variables for eight population panel studies: The British Household Panel Study (BHPS, 1991–2008), the Household Income and Labour Dynamics in Australia (HILDA, 2001–2009), the Korea Labour and Income Panel Study (KLIPS, 1998–2008), the Panel Study of Income Dynamics (PSID, 1970–2007) in the United States, the Russia Longitudinal Monitoring Survey (RLMS-HSE, 1995–2010), the Swiss Household Panel (SHP, 1999–2009), the Canadian Survey of Labour and Income Dynamics (SLID, 1993–2009), and the German SocioEconomic Panel (SOEP, 1993–2009).
http://popcenter.uchicago.edu/data/cnef.shtml
DataFirst Archive, South Africa
Type: Longitudinal/cross-sectional
Regions: Africa
Unit level: Individual /household
DataFirst is a research unit at the University of Cape Town engaged in promoting the long term preservation and reuse of data from African socioeconomic surveys. Its Data Portal currently provides access to 287 African census-, survey-, and merged meta-data.
http://www.datafirst.uct.ac.za/
Eurostat
Type: Mostly longitudinal/ some cross-sectional
Regions: Europe
Unit level: Individual/household/firm
Eurostat is the Statistical Office of the European Communities. Its key role is to provide the European Union with a high-quality statistical information service that enables comparisons between countries and regions. Eurostat’s principal database is the New Cronos – which contains high quality macroeconomic and social statistics data covering not only EU Member States but also many of the central European countries, Japan, the United States and the main economic partners of the EU. The Cronus Database contains monthly, quarterly, bi-annual or annual data from 1960 onwards, depending on the variable and country selected.
http://www.epp.eurostat.ec.europa.eu/
INDEPTH Network
Type: Mostly longitudinal/ some cross-sectional
Regions: Africa, South Asia, East Asia
Unit level: Individual
The INDEPTH Network is a global network of 41 health and demographic surveillance system field sites in 20 low- and middle-income countries in Africa, Asia and Oceania, including India. Founded in 1998, its Central Data Catalogue currently holds 19 surveys.
http://www.indepth-ishare.org/
Integrated Public Use Microdata Series International (IPUMS International)
Type: Longitudinal
Regions: All continents
Unit level: Individual
IPUMS International is a collaboration of the Minnesota Population Centre, National Statistical Offices, and international data archives aiming to distribute harmonized population census micro-data. The database currently features censuses from 74 countries conducted from 1960 to the present, and describes approximately 545 million recorded persons. The data series includes information on a broad range of population characteristics, including fertility, nuptiality, life-course transitions, migration, labor-force participation, occupational structure, education, ethnicity, and household composition. The information available in each sample varies according to the questions asked in that year and by differences in post-enumeration processing.
http://www.international.ipums.org/international/
International Food Policy Research Institute (IFPRI)
Type: Longitudinal
Regions: Africa, Asia, Latin America
Unit level: Household/community
IFPRI currently shares 99 of its datasets, which feature both household/community level surveys and social accounting matrixes. The household and community surveys include several surveys of household characteristics, consumption and health as well as agricultural information and food security information, while the social accounting matrices are an economic framework study with a focus on agriculture. Some studies include geospatial data. IFPRI also publishes implementation, monitoring and implementation data, for instance on cash transfer implementation.
Inter-University Consortium for Political and Social Research (ICPSR)
Type: Longitudinal/cross-sectional
Regions: All continents
Unit level: Individual/household
The ICPSR is an international consortium of academic organizations and research institutions established in 1962. It maintains and provides access to a vast archive of social science data, featuring over 8,000 discrete studies/surveys with more than 60,000 datasets. Apart from offering a topic- and regional-specific search, ICPSR hosts 16 discipline-related thematic collections in education, aging, criminal justice, demographic data, health and mental health, instructional data, race and ethnicity, and terrorism.
International Household Survey Network (IHSN)
Type: Longitudinal/cross-sectional
Regions: All continents
Unit level: Individual/household
The IHSN Central Survey catalogue provides a searchable list of surveys and censuses conducted in low- and middle-income countries. This catalogue is maintained in collaboration with the World Bank and a large number of national and international agencies. Currently, it features 4221survey entries from 239 countries, dating from 1890 to 2014. The catalogue offers metadata including, when available, the survey questionnaire, manuals and report, and list of related citations. It does not provide access to micro-data, but when available, provides a link to external catalogs where the data can be obtained.
Programme for the Improvement of Surveys and the Measurement of Living Conditions in Latin America and the Caribbean/ Mejoramiento de las Encuestas de Hogares y la Medición de Condiciones de Vida (MECOVI)
Type: Longitudinal/cross-sectional
Regions: Latin America
Unit level: Household
MECOVI was launched in 1996 and aims to generate both country-specific and region-wide information about living conditions. The program is executed by the World Bank, the Inter-American Development Bank and the United Nations Economic Commission for Latin America and the Caribbean, as well as specialized institutions or agencies in participating countries. Apart from its work around national statistical capacity building, MECOVI has created a Regional Poverty Data Bank that contains an inventory of more than 400 household survey data sets from 23 countries in the LAC region. The data sets are accessible to World Bank users or via the respective National Statistical Offices.
http://www.cepal.org/deype/mecovi/
Rural Income Generating Activities (RIGA) Database
Type: Longitudinal/cross-sectional
Regions: Africa, Asia, Eastern Europe, Latin America
Unit level: Household
RIGA is a collaborative effort of FAO, the World Bank and American University in Washington, DC, to promote the understanding of roles, relationships and synergies between on-farm and off-farm income generating activities for rural households. Building on existing household living standards surveys, the database contains cross-country comparable indicators of household-level income for 35 surveys representing 19 countries, with surveys conducted between 1992 and 2009.
http://www.fao.org/economic/riga/riga-database/en/
UCLA Social Science Data Archive (SSDA)
Type: Longitudinal/cross-sectional
Regions: Mostly US, but all other continents as well
Unit level: Individual/household
The SSDA, founded in 1964, is maintained so as to provide a foundation for social science research as well as instructional support. Its current list of data sets features around 3000 items, many of them older surveys.
http://www.dataarchives.ss.ucla.edu/
UK Data Service
Type: Longitudinal/cross-sectional
Regions: All continents
Unit level: Individual/household
The UK Data Service, funded by the Economic and Social Research Council (ESRC), provides access to secondary social and economic data including large-scale government surveys, international macro-data, business micro-data and census data from 1971 to 2011. It currently features over 6,000 datasets that are arranged by survey type (UK surveys, cross-national surveys, longitudinal studies, census data, international macro-data, business micro-data, qualitative methods) as well as core themes (labor market, housing and the local environment, crime and social control, health and health behavior). The UK Data Service was established in 2012 and previously existing data archives such as the Economic and Social Data Service (ESDS) have been moved to it in order to create a single portal.