
 ?Mathematical formulae have been encoded as MathML and are displayed in this HTML version using MathJax in order to improve their display. Uncheck the box to turn MathJax off. This feature requires Javascript. Click on a formula to zoom.
ABSTRACT
Blindness or loss of vision is primarily caused by diabetic retinopathy, or DR. It is a retinal condition that may cause harm to the eyes’ blood vessels.Due to the complicated eye structure, manually detecting diabetic retinopathy takes time and is prone to human mistake. There have been several automatic methods proposed for the diagnosis of diabetic retinopathy from fundus images.Using a combination of InceptionV3 and ResNet50, an optimised deep Convolutional Neural Network model of feature fusion is presented in this paper to categories diabetic retinopathy photos into five kinds. Concatenating results in the suggested model including both the Inception Modules and the Residual Blocks, this mitigates the gradient problem and reduces the number of parameters. Resnet50 and Inceptionv3, two different deep learning (DL) models, were used. The proposed hybrid InceptionV3 and ResNet50 based optimised deep CNN (IR_ODCNN) model gathers features from the data and joins them before sending them to the DCNN that has been optimised for classification. The hyper parameters for CNN layer training are optimised using the Grey Wolf Optimizer (GWO) method. An image dataset of the fundus is used to assess the suggested model. The experimental findings indicate that, when compared to the current approaches, In terms of classifying diabetic retinopathy, the proposed model performs better.
1. Introduction
A retinal vascular condition called diabetic retinopathy manifests in diabetic people. Between 2010 and 2050, It is projected that there would be twice as many Americans living with DR – that is, 7.7 million against 14.6 million.Diabetic retinopathy is largely influenced by the duration of diabetes; the chance of developing diabetic retinopathy rises with diabetes duration. Further research has revealed that many diabetics are often ignorant (Gargeya and Leng, Citation2017). Digital colour fundus images must be analysed by clinical experts with specialised training in order to manually detect DR. The delayed results, however, may lead to patients not being followed up with and receiving inaccurate information (Hemanth et al., Citation2020).
The most severe form of the condition, known as proliferative diabetic retinopathy (PDR), is brought on by the retina’s new blood vessels revascularizing.In PDR, scar tissue growth is frequent and can lead to macular issues or support independent tissue of the retina. PDR is a serious illness that can impair both central and peripheral vision.In PDR, scar tissue frequently forms and may lead to the development of independent retinal tissue or result in macular issues. Both central and peripheral vision may be severely impacted by PDR, a serious disorder.
Non-proliferative diabetic retinopathy (NPDR) and proliferation diabetic retinopathy are the two different types of diabetic retinopathy. The disease’s initial symptom is non-proliferative DR. Blood vessels swell or occasionally bump (aneurysm) at this symptom. Any abnormal injury or disease-related change in the retina’s structure is referred to as a lesion. According on their severity rating, the lesions are divided into two categories: brilliant lesions and dark lesions. Identification of retinal lesions, including micro aneurysms, haemorrhages, exudates, is essential for the early identification of DR.
DL-based intelligent systems are therefore suggested as a possible early and scalable substitute for DR detection. Better analysis and interpretation are not possible using conventional machine learning (ML) models and data analysis techniques because of their shallow nature and Distinct DL architectures that were previously developed have demonstrated varying results in terms of feature extraction and classification when it comes to diagnosing drug resistance. Nevertheless, evaluating a complete DLmodel in a single experimental setup is not always effective and can be inconsistent. Due to their complexity and high computational cost with poor performance, the current models cannot identify the disease in its early stages. For automatic identification of DR from fundus pictures, a number of methods, including DL-based methods, have been suggested to overcome these problems.
In order to detect and categorise diabetic retinopathy, a hybrid methodology is put forth in this article.We employed dataset preprocessing tools to highlight subtle information in order to accurately classify DR anomalies. To improve the quality of the images, we used image enhancing algorithms. For DR classification, an optimised deep CNN (IR_ODCNN) model based on a hybrid InceptionV3 and ResNet50 architecture is suggested. This paper draws features from fundus images using the InceptionV3 and Resnet50 architecture. Subsequently, the collected features are merged and fed into the DCNN classification algorithm for DR classification. The hyper parameters for CNN layer training are optimised using the Grey Wolf Optimizer (GWO) method. When it comes to early-stage diabetic retinopathy detection, the suggested DL model performs noticeably better than current techniques.
The following is this paper’s primary contribution:
To increase classification accuracy, we suggest an effective hybrid approach that makes use of a deep CNN for automated diabetic retinopathy identification.
As a preprocessing step, histogram equalisation is carried out to enhance the image quality.
The architectures of InceptionV3 and Resnet50 are utilised to extract features from fundus pictures.To categorise the DR image, the collected features are then merged and fed into the DCNN classifier.The hyperparameters for CNN layer training are optimised through the Grey Wolf Optimizer (GWO) technique. The Grey Wolf Optimizer (GWO) technique is used to improve the hyperparameters for CNN layer training. To test the suggested hybrid architecture using a sophisticated dataset that is accessible to the public.
The suggested hybrid technique’s performance is compared to that of current methods, taking into account the combination of discriminative features from InceptionV3 and ResNet50.
This is how the rest of the document is organised. In Section 2, the relevant initiatives for the identification and categorisation of diabetic retinopathy are discussed.Section 3 provides a description of the preferred technique for this study. In Section 4, the experiment’s findings and analysis are provided. This paper concludes with Section 5.
2. Related work
In the medical field, computer-aided diagnosis, or CAD, has become increasingly common in recent years. To assist physicians in diagnosing medical photos, this state-of-the-art technology uses computer algorithms. Within the medical industry, CAD architecture is becoming increasingly significant and is meant to solve problems with categorisation (Adriman et al., Citation2021). Detecting diffuse reflection (DR) in pictures by identifying healthy and diseased areas and evaluating a variety of features, including veins, haemorrhages, node points, exudate regions, microaneurysms (MAs), and texture (Wan et al., Citation2018). Machine learning (ML)-based classification algorithms are widely used to classify the presence or absence of DR (Wang et al., Citation2020).
To find the DR, several ML approaches have been developed. Using clutter rejection, Keerthi et al.‘s (Farooq et al., Citation2022). According to the proposed technique, 79% sensitivity and 90% specificity were reported. Istvan and Hajdu (Xuechen et al., Citation2019) utilised major component analysis with the Radon transform to extract prominent features, and then employed an SVM classifier to decide the DR. For the suggested model, the region under the bend (AUC) was 0.96. Balint and Hajdu (Qummar et al., Citation2019) fostered a group strategy for microaneurysm distinguishing proof.
During the feature extraction stage, the accompanying feature extraction strategies were applied: 2D Gaussian transformations, formal hat transformations, greyscale diameter closure, and circular Hough transformations (Qiao et al., Citation2020) offers a robotised DR location strategy in view of the arrangement and fluctuation recognisable proof of time series information. The review detailed in (Samanta et al., Citation2020) utilises different strategies, for example, gear and patient clinical assessments, preparing tests, dust particle imaging, segmentation mistake, and arrangement blunder of the retinal optic disc, fovea, and vasculature.Without involving the user, the method described in (Jadhav et al., Citation2021) is shown for branching and geometric models.It is noteworthy that these automated methods could save time and lessen the workload for medical practitioners, all while offering a precise and trustworthy diagnosis of DR.
The utilisation of CNN models in the field of DR has been concentrated on with an end goal to give better automatic discovery. The CNN approach acquainted in (Kingma and Ba, Citation2014) sends sores with a worldwide evaluating network with input from two organisations. To assess the model, class weight and kappa values were utilised; PDR level was disregarded. An alternate report (Yun et al., Citation2008) utilised a Kaggle dataset to fabricate three neural network models: the CNN, the feedforward neural network, and the deep neural network.
Yasashvini R et al. proposed using CNN and half and ybrid deep convolutional neural networks for the grouping of diabetic retinopathy. CNN, mixture CNN with ResNet, and half and half CNN with DenseNet are utilised on an enormous dataset of around 3662 train pictures to consequently recognise which step DR has progressed (Pramit et al., Citation2023). To assess the viability of 26 state of the art profound learning organisations and their commitment to profound element extraction and picture order of DR fundus pictures, Cart Das et al. proposed a total methodology. While prepared utilising the Kaggle’sEyePACS fundus picture dataset, Origin V3 had the least overfitting in this model, though ResNet50 showed the most noteworthy overfitting. The most ideal, effective, and trustworthy DL method for DR detection is EfficientNetB4, which is followed by InceptionResNetV2, NasNetLarge, and DenseNet169 (Ishtiaq et al., Citation2023). PramitDutta et al made a combination model called ‘Conv-ViT’ for the examination of fovea-cut optical coherence tomography (OCT) pictures to recognise retinal circumstances. Transfer learning-based CNN models like Origin V3 and ResNet-50 handle surface information by working out the connection of the encompassing pixel. Moreover, the vision transformer model is intertwined to evaluate shape-based information by deciding the association between far off pixels. These three models hybridise to deliver the four sorts of retinal sicknesses: choroidal neovascularization (CNV), diabetic macular oedema (DME), DRUSEN, and Typical (Lam et al., Citation2018). A method for identifying and classifying DR phases was presented by Uzair Ishtiaq et al. to help determine if patients are in the proliferative stage or any of the non-proliferative stages. The groundwork of this order procedure is a hybrid approach in light of picture preprocessing and troupe highlights. After Local Binary Patterns (LBP) and deep learning features were consolidated, the troupe highlights vector was made, and theBinary Dragonfly Algorithm (BDA) and Sine Cosine Calculation (SCA) were utilised to optimise it. Moreover, this better component vector was provided to the machine learning classifiers (de La Torre et al., Citation2020). An productive picture handling strategy was introduced by Nasr Gharaibeh et al. (Al-Hazaimeh et al., Citation2019) for the finding of diabetic retinopathy sicknesses utilising retinal fundus pictures.The pre-processing,optic disc detection and blood vessel segmentation and removal, fovea removal, feature extraction(i.e. microaneurysm, retinal discharge, and exudates), include choice, and element order were the different advances engaged with this automated screening framework for diabetic retinopathy. Calculations and approaches for handling retinal pictures, vein division and extraction, optic circle confinement and expulsion, include extraction, and eventually order for different light sores utilising SVM and Naïve-Bayes classifiers were introduced by Gharaibeh et al (Nasr et al., Citation2021).
A geometrical-based method for reliable human image detection was presented by Obaida M. Al-Hazaimeh et al (Al-Hazaimeh et al., Citation2019). A Matlab software-based simulation utilising the INRIA dataset was carried out, and the outcomes are verified through comparison with five cutting-edge methods documented in the literature and a few machine learning techniques, including artificial neural networks (ANN), Random forest and support vector machine (SVM) (RF).Using the Auto-Encoder (AE) model is a novel method that Wei Li et al (Wei et al., Citation2019). suggested to enhance classification performance. A Multi-objective Segmentation Method for chest X-rays based on Collaborative Learning from Multiple Partially Annotated Datasets. The method first extracts multi-scale features from many partially annotated datasets using an encoder built with densely connected blocks Wang et al (Wang et al., Citation2024). Based on local semantic guidance, a two-path gland segmentation technique for diseased images of the colon is presented.The original image data set is expanded and sub-datasets sensitive to particular attributes are generated by utilising the improved candidate region search technique Ding et al (Ding et al., Citation2022).
This study suggested using CNN on fundus pictures as a unique method for DR detection.To be more precise, the suggested approach called for running tests with two different CNN designs, Inceptionv3 and Resnet50, and then employing these networks for feature extraction.With FC7 features, the Alex Net DNN-based DR obtains a DR accuracy of classification of 97.93%, compared to 95.26% with PCA. It also appears to be better with the LDA feature selection. The Alex Net DNN-based DR surpasses the SIFT-based DR, according to a comprehensive evaluation using the spatially inconsistent features transfer (SIFT) approach (performance 93.30%) dependent DR feature extraction (Bodapati et al., Citation2021, Shanthi and Sabeenian, Citation2019). Our findings imply that Giardia ssp. may modify mast cell-driven intestinal immune responses by increasing or decreasing mast cell protease activity. Giardia ssp. may benefit from tight junction destruction during infection if mediated regulation of the mast specific proteases is increased (Zhan et al., Citation2020, Gadekallu et al., Citation2020).
It has been proposed to use the Diagnostic accuracy of Micro Aneurysms and Identification and Early Mechanism for Non-Proliferative Eye Disease. They successfully train convolution neural network for text categorisation of retinal images, improving the effectiveness and correctness of NPDR prediction (Gao et al., Citation2018, Odeh et al., Citation2021). Because of the model’s outstanding durability and portability, it has the potential to perform fantastically in limited application areas with less computer resources to accelerate the screening process. GoogleColab was used to train the dataset. Our model was trained on four classes. On the validation set, we got an Ehrlich Sigma score of 0.8336, while on the training set, it was 0.9409 (Raja Sarobin M and Panjanathan, Citation2022, Das et al., Citation2023).
Inceptionv3 and Resnet50 are two distinct CNN architectures that were particularly tested as part of the recommended approach, and these networks were then used for feature extraction. The recommended CNN model for classification might be fed by concatenating the acquired features. Pre-processing methods like Histogram Equalisation and Intensity Normalisation helped in order to improve the fundus images even more. According to the test findings, the suggested method performed better than the state-of-the-art DR detection strategies.
3. Proposed methodology
Deep learning is a strongmachine learning technology that has been utilised to effectively satisfy clinical imaging undertakings like object detection, segmentation, and classification. DL algorithms may in a flash gain from the info, dissimilar to ordinary CNNs that depend on feature extraction methods. Because of this, DL approaches have been applied in various enterprises, including bioinformatics, finance, drug advancement, clinical imaging as well as instructive projects. CNN is the method among the various DL strategies that is most usually used to deal with image-based medical hardships.
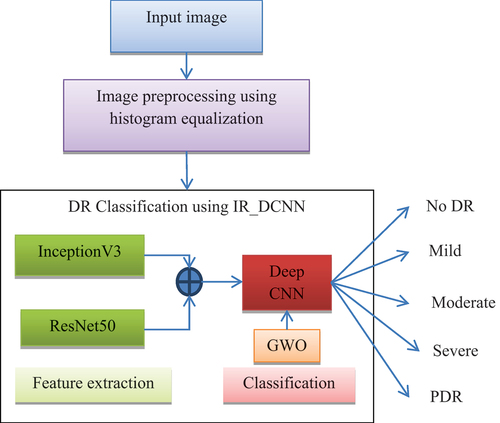
The proposed framework gives a end-to-end mechanism for DR classification by using a hybrid technique with ResNet50 and Inceptionv3. Both the Resnet50 and Inceptionv3 models are utilised to remove highlights from the input photosThe proposed DR arrangement block outline is shown in .
Figure 1. A suggested block diagram.
3.1 Dataset of input image
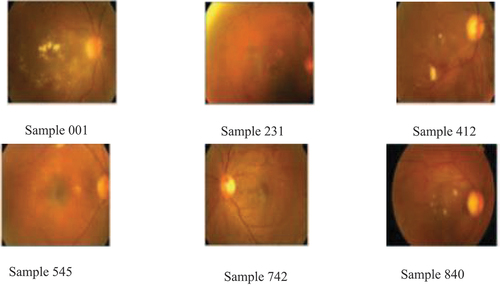
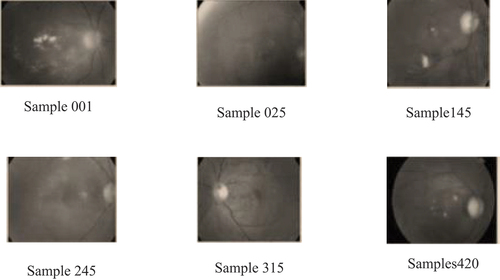
The dataset contains 840 photos of the fundus with different resolutions, including 375 mild, 799 moderate, 193 severe, and 295 proliferating images. Create training and testing sets from the 432 image dataset, each consisting of 351 and 550 photos, respectively. displays the sample input images.
Figure 2. Sample images.
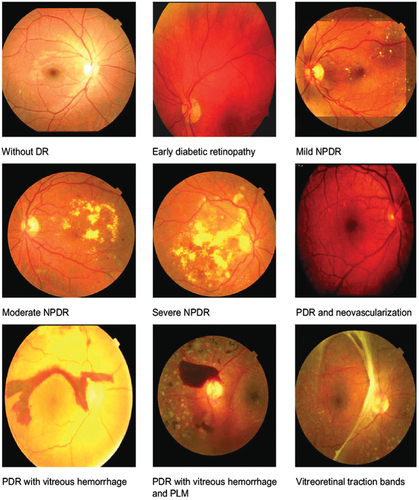
Using samples of diabetic retinopathy from the Image Net Dataset, these degrees of DR are normal, mild, moderate non-proliferative, severe non-proliferative, and proliferative.
3.2 Preprocessing
The fundus image’s characteristics are enhanced, and undesirable noise is eliminated, to image preparation. Preprocessing can improve some aspects of an image. The quality of the input images, computing cost, computational time, and noise reduction all has a role. Pre-processing of images is utilised. Any pixel in a linear method algorithm can be applied linearly without stating whether the image is corrupted or not. Nonlinear algorithms only can apply to pixels by determining whether they are corrupted or not. Corrupted images were then removed using a specialised algorithm.
3.2.1 Histogram equalization
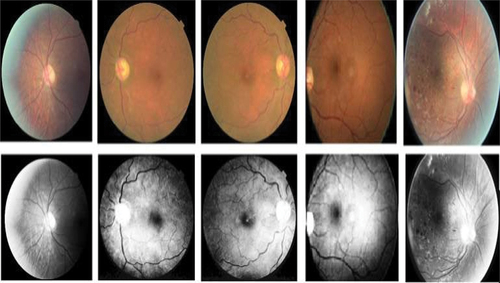
The intensity levels of images can be changed through a process called histogram equalisation to increase contrast. The histogram of the output region is then contrasted with the other histogram that was supplied. Histogram equalisation is done to make the fundus image more contrasted. The histogram is changed to achieve this. The contrast enhancement technique is used to create the fundus image, and the histogram just shows how frequently each of the grey levels, which range from 0 to 255, occurs. shows the fundus image dataset of histogram equalization.
Figure 3. Fundus image dataset of histogram equalization.
The histogram equalisation is
where
is the intensity area
N is the total number of pixels that make up the image’s intensity.
Assuming that’m’ stands for the fundus image, and integer pixel intensities can range from 0 to L-1.
where
L is the intensity values
ρ is normalised histogram
This enhances the fundus image and increases the likelihood that it will achieve its brightness. By adding the intensity pixel values to the ones that already exist, a uniform intensity distribution is created. The filtered image’s contrast is increased using the histogram equalisation process.
3.3 DR classification
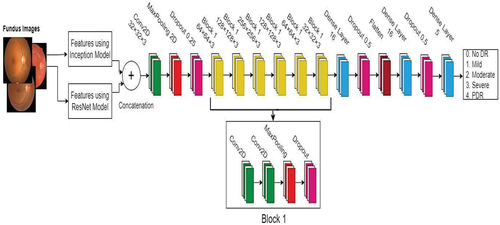
The effectiveness of the system as a whole is increased by this crucial activity. In the proposed classification InceptionV3 and ResNet50 architecture were used in the system to extract features from the DR pictures. Then the features are concatenated and using this features DR images are classified by using deep convolutional neural network.Optimizing the hyperparameters for CNN layer training is done via the Grey Wolf Optimizer (GWO) method. Local features, which are used to illustrate local anomalies, are the selection of a group of noticeable spots from a single image and the description of the vector properties surrounding the salient points, regardless of scale fluctuation, brightness variation, or orientation change. shows the suggested IR_ODCNN model for detecting Diabetic Retinopathy
Figure 4. Suggested IR_ODCNN model for detecting Diabetic Retinopathy.
3.3.1 Inceptionv3 model
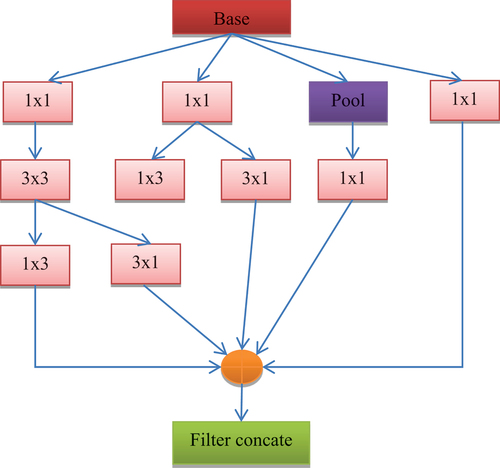
The InceptionV3 model’s design is most frequently utilised for medical imaging purposes. For classification purposes, it is commonly used. Filters of various sizes are known to be combined to form a single filter in the InceptionV3 model. This approach lowers computational costs and the number of trainable parameters.The Inception-V3 is chosen for the initial feature extraction approach due to its capacity to remove high-level features utilizing a scope of channel changes with 277 and a successful combination of various convolution activity types. By utilising two (3×3) layers as opposed to one (5×5) convolution layer, the construction of Origin V3 shows the quality of dimensionality decrease without forfeiting the model efficiency, as a (5×5) convolution is 25/9 = 2.78 times more computationally costly than a (3×3) convolution. In this procedure, an addition of 28% can be accomplished using two (3×3) convolutions.Further time savings are achieved by factorising greater convolution, as seen in . This is because asymmetric convolution is implied. Additionally, the computational cost is decreased by using a (1×3) convolution layer followed by a (3×1) convolution layer rather than (3×3) convolutions. The Inception-V3 architecture also made use of an effective grid reduction technique to address problems with traditional pre-trained models with regard to computational expense. To solve the issues, different convolution and pooling techniques are used, followed by the last concatenation.
Figure 5. InceptionV3 model architecture.
First, the 84 × 84× 3 images are sent to the Inception-V3 for the feature extraction task, but it does not include the Inceptionfeature_texture from the last concatenate layer (mixed10) auxiliary classifier component that generates texture features. Next, using a flattened layer, the texture feature is transformed into a 1D vector, producing an output from YInception as
3.3.2 Resnet50
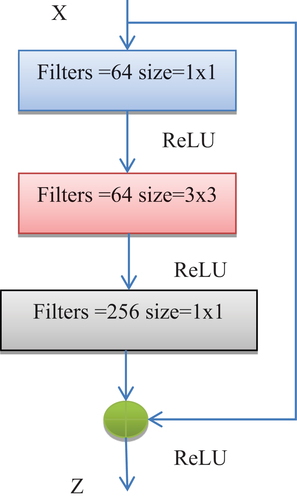
Aside from extricating highlevel elements from the InceptionV3 model, the ResNet-50 is used to focus on low-level highlights and utilises the architecture’s residual connections. shows the essential plan of the ResNet50 model.An original component included to the ResNet50 model was the remaining block, a feedforward model with an association that considers the expansion of new data sources and the production of entirely different results. With this methodology, the model performs better without altogether expanding in complexity.When comparing the DL models under consideration, Resnet50 produced the highest accuracy as a result it was chosen for DR detection.This block’s output, Z, is determined by multiplying the input, x, by the residual function, F, which is shown as
where the weight matrix Wi of three successive convolution layers is updated with the input x by the residual function F. The 1D vector output of YResNet is then produced by converting the texture feature, ResNetfeature_texture, using a flattened layer.
Figure 6. Basic ResNet 50 model architecture.
3.3.3 Deep convolutional neural network
There are two techniques that are most frequently utilised that are average pool and maximum pool.The CNN model consists of three layers: pool, activation, and convolution. When data is received, it is integrated into the network via a number of filters. Traditional HR filters are similar to these filters. They are discovered by independent research; they are not disclosed to the public. Using feature detector maps with different kernel sizes or visual input at different locations, the convolution layer gathers local features.
Benefits of the convolution layer include the target alignment stability, local connection, and strength approach. Usually placed following the convolution layer is the pooling layer. A typical neural network is The completely connected classification layer in the final pool layer simulates this.
In the convolutional layer, which is composed of convolutional nuclei, each neuron serves as convolutional nucleus. The convolution action becomes a correlation operation if the kernel is symmetric. The receptive fields created by the convolutional kernel are tiny slices of the original image. A representation of the convolution operation is as follows:
The index of the k convolutional kernel of the first layer is multiplied by each element of the input image tensor in this instance.
Due to the internal covariance shift, which necessitates careful parameter tweaking, the learning rate slows down. The hidden unit value distribution changes as a result of the internal covariance shift. Equation demonstrates batch-normalisation of a shifting feature-map.It gathers related data from the surrounding area of the receiving field and produces the most prevalent response there. shows the deep convolutional neural network architecture.
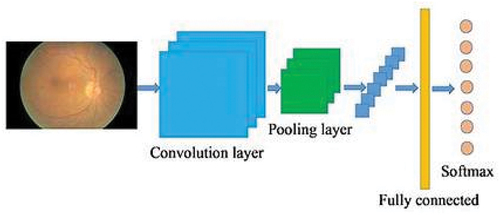
Figure 7. DeepConvolutional neural network.
To create a trustworthy and effective network for the model, the three variables’ depth, width, and frequency were scaled. The suggested classification in this study is the network’s several variants, which range from B0 to B7. This network’s fundamental building block is mobile inverse bottleneck convolution, an enhancement of the squeeze-and-excitation network (SENet) built on the foundation of an inverted dense block. The input image sizes are set to 224 × 224.
Each of the network’s 16 Conv blocks has a kernel that can be either 3 by 3 or 5 by 5, depending on the block. The fundus image, which is used as input data, is added to the network at first and processed using a pattern of three Conv2D layers, sixteen Conv layers, and one Conv2D layer, as seen in the image.
In order to scale the network width, depth, and quality equally using a complicated variable, a new compound scalable technique is designed when the model parameters and computation amount are maximised. The equation’s formula is precise and displays the highest level of model correctness.
In EquationEquation (2)(2)
(2) , N stands for the classification network, J for convolution, I for the number of convolutional layers, and j, I I and Ch for baseline network specified constants. The network’s width, depth, and precision are scaled using the factors w, d, and r, and their calculation are as follows:
The network’s Breadth, Length, and Density are optimised using the composite parameter to create the three-dimensional properties.
3.3.3.1. Hyper parameter setting
The hyperparameters are chosen and modified during model training to enhance model prediction. lists the model hyperparameter and tuning method that were chosen. Weights are updated using the GWO and the categorical cross entropy loss function during training. It is impossible to overestimate the influence that hyperparameters have on the DCNN’s accuracy and convergence. The DCNN’s hyperparameter selection is crucial and is dependent on the application for which it is being employed. The most typical DCNN training hyperparameters include momentum, regularisation coefficient, learning rate, and number of epochs.The gradient descent algorithm’s learning rate sets its speed, and momentum dictates how much updating previous weights influences updating current weights. Thus, in order to assist the network in generating the most precise findings, these hyperparameters must be optimised to take into account all of these settings.
Table 1. Hyper parameters the suggested model’s value.
Algorithm 1: The proposed IR_ODCNN model’s training algorithm
Input: Baseclassifierlist:IR_ODCNNclassifier_list,validationset: data_valid,testset: data_test,trainingset: data_train_process.
Output:The initial prediction probability value of the test sets sample is Test_pro, and the base classifier’s IR_ODCNN value is F1_list.
Define the test sets sample’s list of finite probability values.
M = 0.
for j = 1 to K do
for i = 1 to N do
while M < Iteration do
In base classifier, remove the player and load the weight. ‘imageNet’,andgetthemodel:base_model.
After base_model, add the output layers module for the classification model.
The validation set and the training set, data_train_process
M = M + 1;
end while
end for
The test’s final test sample, Tm, was determined by choosing the category with the highest probability value, which misrepresented the test set’s sample size.
3.4. Performance measures
The effectiveness of the classifier network is based on how many test records the classification model correctly and incorrectly predicts. A table that indicates the proportion of records that were calculated incorrectly and properly is called a confusion matrix. The values in the confusion matrices represent the number of samples that were correctly and incorrectly identified. True Positive (TP), True Negative (TN), False Positive (FP), and False Negative (FN) are the four value categories that make up the confusion matrix. The detected lesions are evaluated using the sensitivity, specificity, and accuracy performance standards.
Sensitivity or Recall:
It evaluates the capacity to accurately identify DR lesions as follows:
Specificity:
The ability to accurately reject DR lesions is measured by specificity, which is written as,
Accuracy:
The formula used to determine lesion detection performance is
Precision:
The capacity of an ML model to properly anticipate positive cases is measured using precision. It illustrates the relationship between the total of the actual positive estimations and the false positive estimates that are true positives.
F1-Score:
The precision and recall harmonic means are used to define the F1-score. The F1-Score is computed using the following formula:
4. Experimental result
The recommended solution’s MATLAB code was created on a Windows PC with a 4.6 GHz CPU and 4 GB of RAM. To locate the sample image, a database query is made. We looked at the study’s model’s f1-score, accuracy, precision, recall, and confusion matrix. Additionally, accuracy curves were made to monitor the model’s performance with respect to the number of epochs.
Image Net is the dataset used to test the efficiency of the suggested technique. The Image Net dataset contains 10 microscopic images, all of which have high DR. 840 images are available. 30% of the images were used in the testing phase and 70% in the training phase. Preprocessing, which improves the image’s quality and contrast, is used to generate these photographs.
Figure 8. Sample input images from image net dataset.
Since the input sample images from the Image Net dataset in are insufficient for accurate classification, Hybrid IR_ODCNN is suggested as a solution to enhance classification performance.
Numerous challenges that ultimately result in feature extraction are dealt with through preprocessing. Preprocessing is done on each microscopic image to increase its effectiveness. The preprocessed image is shown in .
Figure 9. Pre-processed image.
Preprocessing Since it gets the image ready for further processing, an image is a crucial stage in any categorisation process. For ease of study, the Red-Green-Blue (RGB) image is typically transformed to greyscale.
From big data sets, the best feature can be extracted using the feature extraction approach, which entails selecting and merging numerous variables into features. While being precise and distinctive in identifying the underlying data gathering, these features are simple to use. Colour, form, and texture are three key factors that are examined in this method.
It is commonly known that the InceptionV3 model may mix filter of different sizes to create a single filter. The collected characteristics are then merged and fed into the DCNN classification system to categorise DR. The CNN layers are trained by optimising the hyperparameters using the Grey Wolf Optimizer (GWO) algorithm. When it comes to early-stage diabetic retinopathy detection, the suggested DL model performs noticeably better than current techniques.
illustrates how the large diagonal elements represent properly classified occurrences. The quantity of rows and column in theconfusion matrix in a multi-class order issue is equivalent to the quantity of particular classes in the dataset. For each class, the disarray framework is used to produce the TP, TN, FP, and FN perceptions. Numerous presentation measurements, including recall, accuracy, precision, and F1 score, are surveyed considering the perceptions. shows the F1-score, recall, accuracy, and precision for every one of the five classes. The quantity of moderate and non-extreme DR cases that the model predicts for each DR grade is displayed in . Even though they are classified as non-severe DR cases, it is anticipated that some moderate NPDR patients may be severe.The F1 score is derived from measurements of precision and recall. compares the students’ performance in all five classes.The f1-score, the suggested CNN classification method.
Figure 10. Confusion matrix.
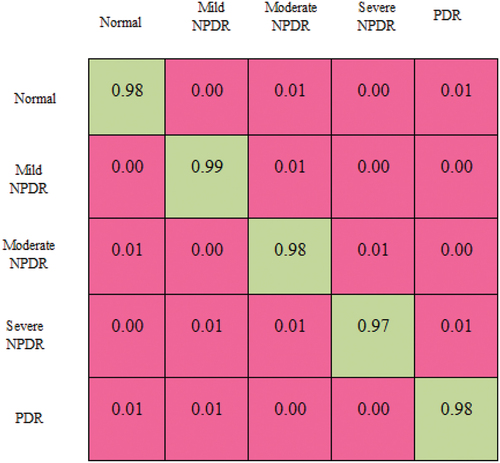
Figure 11. Comparison of each class’s performance.
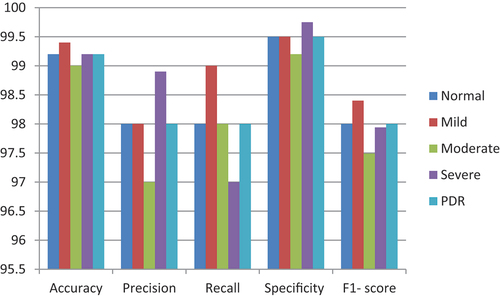
Table 2. Performance metrics determined by observing the confusion matrix and calculating the percentage.
Due to the developments in Deep Learning technologies and powerful computers, picture categorisation accuracy has significantly improved in recent years. Currently, work is being done to develop AI-based methods that can carry out ocular activities. Using the OCT dataset, the Inceptionv3 model’s accuracy, recall, specificity, precision, and f1 score values were 81.18%, 94.43%, 93.71%, 95.12%, and 90.29%, in that order. ResNet is a popular neural network used for various computer vision tasks. Utilising an OCT fundus image dataset, we evaluated the ResNet50 model. The model’s f1 score, accuracy, sensitivity, specificity, and precision were, in that order, 90.65%, 96.75%, 95.48%, 96.25%, and 93.28%. With f1 score values of 99.2%, 97.98%, 99.49%, 97.98%, and 97.96%, respectively, the proposed model learns deep features and achieves accuracy, sensitivity, specificity, and precision. ResNet50 and Inceptionv3 features are combined to achieve this. shows the comparison performances of various CNN architectures.
Figure 12. ROC curve.
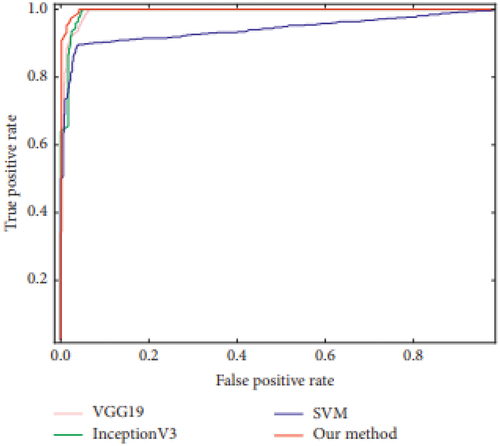
The area under the ROC curve(AUC) and the ROC bend are fundamental measurements for assessing the algorithm’s viability. The further the ROC bend slants to the upper left, the nearer the AUC value is to 1, showing a higher order result from the strategy. In , the ROC curves for each approach are shown in a single coordinate graph to work with comparisons. Our methodology’s ROC curve is situated nearer to the upper left of the chart than those of the other three strategies, as displayed in . Similar outcomes are gotten in view of the AUC value utilising our technique, the VGG19 model, and the InceptionV3 model. An essentially more modest outcome is delivered by the SVM model. The comparing AUC scores for our strategy are 0.9981, 0.9935 for VGG19, 0.9924 for InceptionV3, and 0.9414 for SVM. The process times for various classifiers are shown in .
Table 3. The suggested hybrid architecture, ResNet50, and InceptionV3 performance.
Table 4. Computation time.
Finally, we compared our suggested classification methodology has two feature of Convolutional Neural Network. We also compared our conclusions to other research that used the same dataset. The proposed method’s performance comparison is shown in . which uses hybrid classification model with the other existing algorithms and proposed approach achieves better accuracy of 99.2%.
Table 5. Comparison between the suggested model and alternative DL models.
5. Conclusion
DR is a major contributor to visual loss in people of working age. Patients need to have rigorous systemic care, which includes controlling their blood pressure and glucose levels, to get the greatest results. Early diagnosis and treatment of diabetes can avoid eyesight loss. Diabetes over a long period of time causes a leak in the retinal blood vessels. DRstages are commonly using blood vessels, exudate, haemorrhages, microaneurysms, and texture. In this paper, a novel hybrid InceptionV3 and ResNet50 based optimised deep convolutional neural network (IR_ODCNN) is developed for the diagnosis of diabetic retinopathy. The recommended approach uses Inceptionv3 and Resnet50 in an end-to-end methodology to extract features from diabetic fundus images. The traits acquired from the two models are integrated and fed into the suggested optimised deep CNN, in order to categorise the retinopathy. Numerous experiments are run to enhance the presentation of the proposed model, including methods for image and information expansion.Better results are obtained using the suggested hybrid classification model: 99.2% classification accuracy, 98% recall, 99.49% specificity, 97–98% precision, and 97–96% F-Score.The new model exhibits encouraging results when compared to the existing one.Future extensions of this research were to train the proposed hybrid architecture for all likely retinal diseases. Thus, hybrid deep CNN can identify retinal problems early in patients, improving diagnosis and averting vision loss.
Disclosure statement
No potential conflict of interest was reported by the author(s).
Additional information
Notes on contributors
M.Mary Vespa
M Mary Vespa is currently pursuing his doctoral studies in the Department of Computer Science and Engineering in Anna University, Chennai, India. She received her B.Tech in Information Technology from C.S.I institute of Technology, Thovalai,India and M.E in Computer Science and Engineering from Veltech Engineering College, Avadi, Chennai, India. Her areas of research include Image Processing , Medical Imaging and Soft Computing.
C.Agees Kumar
C Agees Kumar received his B.E in Electronics and Instrumentation Engineering from National Engineering College, Kovilpatti, India, M.E in Process Control and Instrumentation from Annamalai University, Chidambaram, India, and PhD degree from the Faculty of Electrical and Electronics Engineering, Anna University, Chennai. He is currently a Professor with the Department of EEE, Arunachala College of Engineering for Women, Vellichanthai, India. His current research interests include multiobjective optimization, power electronics, electrical drives, and soft computing.
References
- Adriman R, Muchtar K, Maulina N. 2021. Performance evaluation of binary classification of diabetic retinopathy through deep learning techniques using texture feature. Procedia Comput Sci. 179:88–13.
- Al-Hazaimeh OM, Al-Nawashi M, Saraee M. 2019. Geometrical-based approach for robust human image detection. Multimedia Tools Appl. 78(6):7029–7053.
- Bodapati JD, ShareefShaik N, Naralasetti V. 2021. Composite deep neural network with gated-attention mechanism for diabetic retinopathy severity classification. J Ambient Intell Humaniz Comput. 12(10):9825–9839.
- Das D, Kumar Biswas S, Bandyopadhyay S. 2023. Detection of diabetic retinopathy using convolutional neural networks for feature extraction and classification (DRFEC). Multimedia Tools Appl. 82(19):29943–30001.
- de La Torre J, Valls A, Puig D. 2020. A deep learning interpretable classifier for diabetic retinopathy disease grading. Neurocomputing. 396:465–476. doi: 10.1016/j.neucom.2018.07.102.
- Ding S, Wang H, Lu H, Nappi M, Wan S. 2022. Two path gland segmentation algorithm of colon pathological image based on local semantic guidance. IEEE J Biomed Health Informat. 27(4):1701–1708.
- Farooq MS, AnsifArooj R, Baqasah AM, YaseenJabarulla M, Singh D, Sardar R. 2022. Untangling computer-aided diagnostic system for screening diabetic retinopathy based on deep learning techniques. Sens. 22(5):1803.
- Gadekallu TR, NeeluKhare SB, Singh S, Kumar Reddy Maddikunta P, Srivastava G. 2020. Deep neural networks to predict diabetic retinopathy. J Ambient Intell Humaniz Comput. 14:1–14.
- Gao Z, Jie L, JixiangGuo YC, Zhang Y, Zhong J. 2018. Diagnosis of diabetic retinopathy using deep neural networks. IEEE Acces. 7:3360–3370.
- Gargeya R, Leng T. 2017. Automated identification of diabetic retinopathy using deep learning. Ophthalmol. 124(7):962–969.
- Hemanth DJ, Deperlioglu O, Kose U. 2020. An enhanced diabetic retinopathy detection and classification approach using deep convolutional neural network. Neural Comput Appl. 32:707–721.
- Ishtiaq U, RahayuMohdfaizal Abdullah E, Ishtiaque Z. 2023. A hybrid technique for diabetic retinopathy detection based on ensemble-optimized CNN and texture features. Diagn. 13(10):1816.
- Jadhav AS, Patil PB, Biradar S. 2021. Optimal feature selection-based diabetic retinopathy detection using improved rider optimization algorithm enabled with deep learning. Evol Intell. 14:1431–1448.
- Kingma DP, Ba J. 2014. Adam: a method for stochastic optimization. Proceedings of the 3rd International Conference for Learning Representations; San Diego.
- Lam C, Darvin Y, Guo M, and Lindsey T. Automated detection of diabetic retinopathy using deep learning AMIA summits on transl sci proc. 2018: p.147, 2018.
- Nasr G, Al-Hazaimeh OM, Abu-Ein A, Nahar KM. 2021. A hybrid SVM NAÏVE-BAYES classifier for bright lesions recognition in eye fundus images. Int J Electr Eng Inform. 13(3):530–545.
- Odeh I, Alkasassbeh M, and Alauthman M. 2021. Diabetic retinopathy detection using ensemble machine learning. Proceedings of the 2021 International conference on information technology (ICIT); Amman, Jordan. IEEE. p. 173–178.
- Pramit D, KhaledaAkthersathi MAH, Ali AkberDewan M. 2023. Conv-ViT: a convolution and vision transformer-based hybrid feature extraction method for retinal disease detection. J Imaging. 9(7):140.
- Qiao L, Zhu Y, Zhou H. 2020. Diabetic retinopathy detection using prognosis of microaneurysm and early diagnosis system for non-proliferative diabetic retinopathy based on deep learning algorithms. IEEE Acces. 8:104292–104302.
- Qummar S, Khan F, Shah S, Khan A, ShahaboddinShamshirband ZUR, Ahmed Khan I, Jadoon W. 2019. A deep learning ensemble approach for diabetic retinopathy detection. IEEE Acces. 7:150530–150539.
- Raja Sarobin M V, Panjanathan R. 2022. Diabetic retinopathy classification using CNN and hybrid deep convolutional neural networks. Symmetry. 14(9):1932.
- Samanta A, Saha A, Chandra Satapathy S, Lawrence Fernandes S, Zhang Y-D. 2020. Automated detection of diabetic retinopathy using convolutional neural networks on a small dataset. Pattern Recognit Lett. 135:293–298.
- Shanthi T, Sabeenian RS. 2019. Modified alexnet architecture for classification of diabetic retinopathy images. Comput Electr Eng. 76:56–64.
- Wang X-N, Dai L, Shu-Ting L, Kong H-Y, Sheng B, Qiang W. 2020. Automatic grading system for diabetic retinopathy diagnosis using deep learning artificial intelligence software. Curr Eye Res. 45(12):1550–1555.
- Wang H, Zhang D, Feng J, Cascone L, Nappi M, Wan S. 2024. A multi-objective segmentation method for chest X-rays based on collaborative learning from multiple partially annotated datasets. Inform Fusion. 102:102016.
- Wan S, Liang Y, Zhang Y. 2018. Deep convolutional neural networks for diabetic retinopathy detection by image classification. Comput Electr Eng. 72:274–282.
- Wei L, Liu X, Liu J, Chen P, Wan S, Cui X. 2019. On improving the accuracy with auto-encoder on conjunctivitis. Appl Software Comput. 81:105489.
- Xuechen L, Shen L, Shen M, Tan F, Qiu CS. 2019. Deep learning based early stage diabetic retinopathy detection using optical coherence tomography. Neurocomputing. 369:134–144.
- Yun WL, RajendraAcharya U, Venkatesh YV, Chee C, Choo Min L, Yin Kwee Ng E. 2008. Identification of different stages of diabetic retinopathy using retinal optical images. Inf Sci (Ny). 178(1):106–121.
- Zhan W, Shi G, Chen Y, Shi F, Chen X, Coatrieux G, Yang J, Luo L, Li S. 2020. Coarse-to-fine classification for diabetic retinopathy grading using convolutional neural network. Artif Intell Med. 108:101936.