
Abstract
The purpose of this article is to stimulate the discussion about the constant influx of new and potentially useful methods for empirical investigations in regional science and policy analysis. Particularly, the focus here lies on a brief presentation of ‘quasi’-experimentalist methods as a promising approach to derive causal statements with respect to the effectiveness of regional policy instruments. Outlining potential advantages and pitfalls of this approach by means of an illustrative empirical example, this article finally sets up a research agenda for its future use by regional scientists and economic geographers.
Introduction
While regional science is at the forefront of developing new empirical methods such as spatial econometrics, it is also experiencing a constant influx of new ideas from outside fields. Initially it is thereby not clear whether these ideas will affect research in a substantial way or – as Berliant (Citation2010) puts it – end up as fads.
This article discusses the potential role of ‘experimentalist methods’ in regional science and policy analysis, which can be best described by three words: causality, causality and causality. It begins by carving out the current state of the art of the experimentalist approach in the field of regional science. It then illustrates the main advantages but also current limitations by means of an illustrative empirical example, which allows some further light to be shed on the question whether regional science and policy analysis needs an experimentalist buzz.
Experimentalist methods in regional science: state of the art
According to Bartels (Citation1982), the social relevance of regional science research is primarily determined by the quality of regional policy analysis. Basically, three different methodological approaches can be distinguished: descriptive, structural and experimentalist (Holmes, Citation2010).
Structural and experimentalist approaches can be delimited from the descriptive approach since these methods explicitly seek to identify policy changes’ quantitative impacts via a well-defined causal identification strategy. The structural approach starts from a fully specified economic model to identify empirically the underlying model parameters. The experimentalist approach focuses less on theoretical underpinnings; rather it stresses the importance of finding experimental settings, where certain parameters are exogenous thereby permitting identifying a causal link between an ‘intervention’ (e.g. regional policy instrument) and an ‘outcome variable’ (e.g. regional development in terms of output or employment evolution).
Inspired by natural sciences’ controlled laboratory experiments, economists began adapting these tools for analysing economic interactions. Laboratory experiments require the experimenter to retain full control over the experiment’s parameters, and that ‘study objectives’ (individuals, firms or regions) are randomly assigned to the treatment under study. Although such laboratory experiments are increasingly gaining importance in economics, such test arrangements suffer the important shortcoming that social and economic interactions cannot always be replicated in laboratory situations (cf. Frank, Citation2012).
Thus, economists (mainly labour and health economists) have developed what they call ‘quasi’-experimentalist tools that try to bridge the gap between the controlled laboratory experiments’ methodological clarity and the empirical fact that most economic circumstances require researchers to cope with the available real-world observational data.
Quasi-experimentalist tools aim at constructing an empirical strategy that answers the counterfactual question:
What would have happened to the study objective if everything else would be equal except the fact that in one case the study object would have got the treatment and in the other case not?
In a laboratory experiment, this question is easily answered by simply conducting the experiment repeatedly for many times whilst altering the intervention status on the study object and keeping the other parameters fixed. However, with observational data, the counterfactual question cannot be answered simply because it cannot be observed.
The quasi-experimentalist approach addresses this problem by arranging empirical observations so that the counterfactual question can be proxied in a meaningful way. An effective proxy allows identifying the causal impact of an intervention (say policy instrument) on the outcome variable. Approaching this issue is not easy, primarily because an appropriate ‘control group’ must be constructed that can be compared with the ‘treatment group’ being subject to the intervention under ceteris paribus conditions.
Treatment group, control group and statistical estimation
Using control groups for evaluating regional policies was introduced by Isserman & Merrifield (Citation1982), recently described by Feser (Citation2013) as seminal in pioneering the use of control groups for evaluation approaches in regional science and policy analysis. For regional policy comparisons the authors proposed selecting ‘control’ regions on the basis of their similarity to ‘treated’ regions prior to the intervention. The underlying logic here rests on the idea that before the policy was implemented, these regions were similar so that any post-intervention differences may be attributed to the intervention itself.
Policy evaluations testing for differences in the outcome variable among treated and similar control regions thus seek at comparing ‘apples with apples’ rather than ‘apples with oranges’. Statistical inference in such settings is typically arranged as a ‘comparison of means’: for both groups the average value of the outcome variable is calculated. If the average value of the treated group is larger than the respective value of the control group, this hints that the intervention has had a positive effect on the outcome variable. Of course, in order to interpret this mean difference in statistical terms, the variability around the mean for both groups has to be assessed as well.
Thus, besides designing a proper control group, another important issue in quasi-experimental comparison is choosing the right estimator. Here, modern microeconometric analysis offers a wide toolkit ranging from regression-based techniques to matching approaches (Angrist & Pischke, Citation2010). The main difference between these multivariate tools and a simple t-test for mean differences is that microeconometric approaches can account for other regional characteristics that may affect the outcome variable besides the policy instrument, hence making causal identification more precise.
Focusing on matching estimation as a ‘weighted’ t-test for mean differences among treated and control regions, the matching approach can be either applied exactly to the set of regional characteristics at hand in order to weight sample observations or rely on a condensed information criterion – the so-called ‘propensity score’ (for technical details, see, for instance, Caliendo & Kopeinig, Citation2008). The idea of propensity score matching (PSM) can be best understood as finding a set of ‘statistical twins’, which are then compared with respect to their outcome differences.
Each region’s propensity score value – as a function of regional characteristics – is therefore used to find pairs of treated and control regions that are equal with respect to the latter, only differing in terms of intervention status, allowing the effect of intervention on a regional outcome variable to be evaluated. Where no such statistical twins can be found, the approach may yield imperfect matching results. In regional evaluation settings this is very challenging since – compared with micro-data with many individual observations – regional data are typically limited in sample size.
Empirical application to real and artificial regional policy instruments
An empirical example is used to highlight both the logic of a PSM approach and to spell out potential pitfalls associated with the use of spatially grouped regional data. Since a detailed description of the full matching approach would go beyond the scope of this article, the focus rests on highlighting the importance of defining an appropriate control group in the context of regional policy analysis. As mentioned above, the matching approach was originally designed to work in micro-econometric settings with many individual observations randomly assigned to interventions. The paper will check how far the approach can be adapted to analysing regional policies characterized by small sample size, non-random intervention assignment and specific spatial policy patterns.
The exercise is conducted based on a sample of 413 German NUTS-3 (Nomenclature des Unités Territoriales Statistiques) districts (Kreise). Firstly, a range of policy variables are selected typically focused on regional policy evaluations. These policy interventions include Germany’s largest regional policy scheme, the Gemeinschaftsaufgabe ‘Verbesserung der regionalen Wirtschaftsstruktur’ (GRW). It supports regional investment activity and infrastructure endowments in lagging regions (also covered by European Union Structural Funds). GRW funds are only allocated to specific German regions according to their regional development status and are strongly focused on East Germany. This produces a specific spatial pattern of policy support (Figure , upper left).
Figure 1. Spatial distribution of real and ‘artificial’ regional policy instruments: (a) GRW regional policy, (b) ERP small business, (c) artificial binary, (d) active labour market policy, (e) ERP innovation and (f) artificial continuous. Policy variables are defined as annual average regional funding volumes for 1995–2004 (for details, see Table
Table 1. Variable descriptions for policy interventions and control variables.
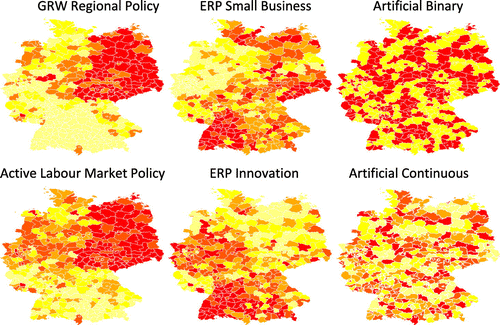
Other policy instruments covered in the empirical exercise are regional expenditure on active labour market policies as well as private-sector small business and innovation support grants within the European Recovery Programme (ERP), as shown in Figure . For evaluation purposes, both binary intervention indicators (if the regional variation in the data allows; Table ) as well as continuous intervention variables that capture regional differences in funding intensities are generated. Depending on the type of the intervention variable, either binary or generalized PSM will then be applied.
Secondly, as many regional covariates as possible are collected to estimate the propensity score in a first-step regression setup with the treatment variable as regressand and regional characteristics as regressors; this is to find an adequate control group. Covariates used in the regression exercise include (pre-funding) levels of labour productivity, employment growth, the employment-to-population ratio, human capital endowment, students-to-population ratio, net migration balance, average firm size, population density, the settlement structure and further regional dummies. A brief variable description including source information is given in Table .
Thirdly, matching estimation is applied to estimate mean differences between the two groups and to evaluate ex-post whether the PSM approach successfully balances differences in the covariates among the set of treated and control regions – that is, whether it is feasible to compare ‘apples with apples’ or not. Throughout the matching exercise, labour productivity growth is used as a general indicator for regional prosperity and thus as a key goal of the above policies. A cross-sectional setup is used where outcome differences for the average sample period 2005–08 are assumed to be caused by a policy treatment in the period 1995–2004.
Alongside this ‘real’ treatment analysis, the process is repeated with ‘artificially’ generated policy instruments that randomly allocate funding to some of the 413 German districts. Random selection into treatment is an important condition for matching estimation to work properly. Hence, by comparing the balancing properties for the ‘real’ and ‘artificial’ treatment cases, this allows the question to answered whether a distinct spatial structure in regional policy evaluation settings has any impact on the quality of the matching approach – in particular for the small sample setting of this exercise.
Figure illustrates the spatial structure of the intervention variables for the ‘real’ policy instruments as well as for the two ‘artificial’ intervention variables (one binary and one continuous for varying funding intensities). As the maps for the 413 German Kreise show, compared with the artificially allocated interventions, the ‘real’ policies have distinct spatial patterns that may complicate selecting an appropriate control group given that similar regions typically tend to cluster in macro-regions (e.g. the distinct German West–East pattern with respect to socio-economic characteristics).
In order to judge whether different spatial data settings influence the quality of the matching approach in terms of control group construction, a statistical criterion is needed: Caliendo & Kopeinig (Citation2008) list different methods to evaluate covariate balancing. All these approaches check whether systematic differences between treatment and control groups remain to be present even after conditioning on the propensity score. Only if balancing of the mean values for the covariates among the treated and control group works can then ‘apples with apples’ be compared.
The obtained results are quite striking: while balancing of covariates – and thus the construction of an appropriate control group approach – works for the artificial treatment cases, the empirical results for ‘real’ policy instruments are more disappointing. In most cases the balancing of covariates is rejected, indicating that statistical twins cannot be found. Treated and control regions are simply too different with respect to their underlying set of socio-economic characteristics to match them meaningfully based on the set of available regional economic variables. The empirical results for different policy variables are summarized in Table .
Table 2. Balancing of covariates in the different matching estimations for labour productivity growth among German regions.
The difference between the performance for ‘real’ and ‘artificial’ policy variables can also be seen if the estimated propensity score values for treated and control regions are compared graphically. As Figure shows, the distribution of regions along the range of values for the propensity score in the binary matching approach is very symmetrically in the case of two draws for the ‘artificial’ policy variable (upper part of Figure ). This hints at an overall good matching quality with similar comparison regions when controlling for the set of available covariates. In contrast, for the case of the ‘real’ policy instruments the two groups differ significantly with respect to their covariates and the construction of a robust counterfactual situation fails.
Figure 2. Propensity score values for treated and untreated regions: (a) ‘artificial’ treatment 1, (b) ‘artificial’ treatment 2, (c) GRW regional policy and (d) ERP innovation. To be more robust in terms of statistical inference for the ‘artificial’ treatment, the estimation routine is repeated 250 times with a newly generated random policy variables and the test result is averaged over the different regressions. Graphs (a) and (b) show two out of these 250 different random draws for the ‘artificial’ policy variable.
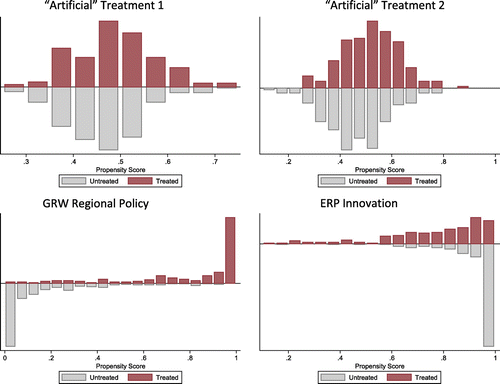
Finally, it should be clarified that this observed empirical result per se is not due to the limited number of regional units available for estimation (as sometimes argued against the use of matching estimation in small sample settings), but to the explicit spatial structure of the policy instruments in focus. Since for the ‘artificial’ intervention variables balancing of covariates works, the propensity score approach would be able to find statistical twins even among a limited set of 413 German districts to isolate the effect of the policy intervention on the set of regions. There is no general small sample bias but rather a spatial bias in the matching estimation.
Towards a research agenda for a more nuanced use of quasi-experimental methods in regional science
Given these findings, it might be asked how does one improve the quasi-experimental control group approach for use in regional science and policy analysis? Obviously, the approach is very convincing because of its didactical power and methodological clarity. One – freethinking – solution could be to advocate a strict random allocation of treatment to beneficiary regions for the sake of good policy evaluation. But obviously such a proposal is neither feasible nor conforms to the goal of most regional policies.
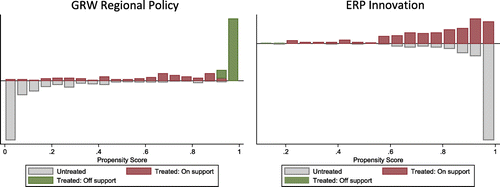
There are also other more realistic suggestions calling for future research efforts in the field. The first would be a technical issue, namely to tailor quasi-experimental tools as close as possible to evaluation settings’ needs in regional science. Given the high degree of regional heterogeneity, one aim should be to guarantee a strong overlap between treated and control regions with respect to their propensity scores, what the matching literature calls the ‘common support restriction’.
Applying this restriction to the binary matching approach for the GRW regional policy indeed enhances the quality of the matching approach in terms of balancing the set covariates among treated and control regions. However, the downside of this restriction is that 107 out of the 197 treated regions are thereby excluded from the analysis which limits the representativeness of the obtained results (see the left-hand-side of Figure ). The common support restriction is less strict for the case of ERP innovation support (see the right-hand-side of Figure ).
Figure 3. Propensity score values with common support restriction: (a) GRW regional policy and (b) ERP innovation. Compare the graphs with unrestricted matching estimations according to Figure .
An alternative suggestion would be to augment the matching approach by the strength(s) of regional research, namely explicitly to incorporate the spatial dimension in the analysis. Chagas, Toneto, & Azzoni (Citation2012) have done a first step towards this direction by using spatial regression techniques in the course of propensity score estimation. This may help to produce better matches of treated and control groups given the spatial pattern of many regional policy instruments.
Another promising step ahead would be to use micro-data to a greater extent in regional policy analysis. Alm & Bade (Citation2010) use firm-level information for the analysis of GRW effectiveness. The estimation of aggregate regional (net) effects can then be conducted in a complementary manner. Finally, solutions must also be found for the problem of simultaneous treatments at the regional level (e.g. the simultaneous funding from regional, national and supranational institutions).
In summary, quasi-experimental control group approaches are a powerful tool that can increase the quality of regional policy analyses with respect to the identification of causal impacts from the policy. However, future research efforts are required before regional researchers will be able to exploit fully the merits of these methodological advances.
Acknowledgements
The author thanks Paul Benneworth and Julie Porter for helpful comments and advice on earlier drafts of this manuscript.
Related Research Data
References
- Alm, B., & Bade, F.-J. (2010). Beschäftigungseffekte der regionalen Investitionsförderung Analyse der gewerblichen Subventionen der Bund-Länder-Gemeinschaftsaufgabe Verbesserung der regionalen Wirtschaftsstruktur im Zeitraum 1999 bis 2006. Manuscript. Dortmund: Technical University Dortmund.
- Angrist, J. D., & Pischke, J.-S. (2010). The credibility revolution in empirical economics: How better research design is taking the con out of econometrics. Journal of Economic Perspectives, 24(2), 3–30.
- Bartels, C. P. A. (1982). Measuring effects of regional policy: an introduction. Regional Science and Urban Economics, 12(1), 1–2.
- Bundesamt für Bauwesen und Raumordnung (BBSR) (2009). Laufende Raumbeobachtungen des Bundesinstitutes für Bau-, Stadt- und Raumforschung [various issues]. Bonn: BBSR.
- Berliant, M. (2010). Misbehavioral urban economics. Journal of Regional Science, 50(1), 93–101.
- Bia, M., & Mattei, A. (2008). A Stata package for the estimation of the dose–response function through adjustment for the generalized propensity score. Stata Journal, 8(3), 354–373.
- Caliendo, M., & Kopeinig, S. (2008). Some practical guidance for the implementation of propensity score matching. Journal of Economic Surveys, 22(1), 31–72.
- Chagas, A. L. S., Toneto, R., & Azzoni, C. R. (2012). A spatial propensity score matching evaluation of the social impacts of sugarcane growing on municipalities in Brazil. International Regional Science Review, 35(1), 48–69.
- Federal Employment Agency (2009). Arbeitsmarktstatistik der Bundesanstalt für Arbeit. Kreisdaten [various issues]. Retrieved from http://statistik.arbeitsagentur.de
- Feser, E. (2013). Isserman’s impact: quasi-experimental comparison group designs in regional research. International Regional Science Review, 36(1), 44–68.
- Frank, B. (2012). Laboratory evidence on face-to-face: why experimental economics is of interest to regional economists. International Regional Science Review, doi:10.1177/0160017612449017.
- Holmes, T. J. (2010). Structural, experimentalist, and descriptive approaches to empirical work in regional economics. Journal of Regional Science, 50(1), 5–22.
- Isserman, A. M., & Merrifield, J. (1982). The use of control groups in evaluating regional economic policy. Regional Science and Urban Economics, 12(1), 43–58.
- VGR der Länder (VGRdL) (2009). Volkswirtschaftliche Gesamtrechnungen der Bundesländer [various issues]. Retrieved from https://vgrdl.de