
ABSTRACT
In response to the outbreak of COVID-19, the Chinese government imposed stringent lockdown measures to minimize the spread of the disease. This paper shows that under these measures, the PM2.5 concentrations were lower in February 2020 than in February 2019. However, after the measures were removed, the PM2.5 concentration returned to the same level as in the previous year, thus implicating that the reduction was temporary.
KEYWORDS:
JEL CLASSIFICATIONS:
Atmospheric haze pollution has become a serious global environmental problem because of its impact on human health, the ecological environment and climate change. Atmospheric particulate matter with an aerodynamic diameter < 2.5 μm (PM2.5) is the main reason for frequent haze pollution in China. For example, in January 2013, a large-scale PM2.5 explosion event caused widespread nationwide concern. The daily average density of PM2.5 in the most polluted Beijing–Tianjin–Hebei region was as high as 500 μg/m3, and the main sources are coal combustion and vehicle emissions (Mu & Zhang, Citation2013).
The emergence of COVID-19 was first identified on 30 December 2019 in China, and the disease spread rapidly throughout the country during the following January. In response to the health crisis, the Chinese government imposed strict lockdown measures in Wuhan city on 23 January 2020, followed by restrictions for the whole of China. The measures imposed were ramped up from the isolation of symptomatic individuals to a ban on mass gatherings, mandatory closure of schools and even mandatory home confinement. The population’s confinement led to a decrease in energy use (Le Quéré et al., Citation2020), with expected associated impacts on PM2.5 emissions.
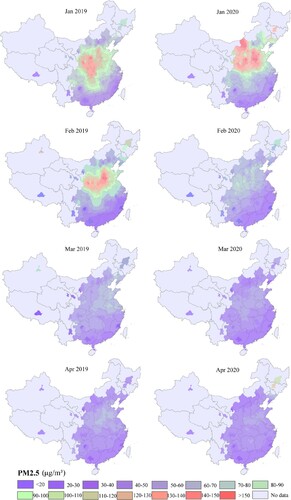
For this study, a Ministry of Ecology and Environment of China data set, containing monthly average PM2.5 density data covering 168 cities, was used to obtain regional PM2.5 concentration data via an inverse distance-weighted interpolation method. The spatial patterns of PM2.5 concentrations from January to April 2019 and in 2020 were then visualized using ArcGIS 10.4 and Adobe Illustrator CS6 software. As shows, generally the average concentration of PM2.5 is much higher in north China than in south China, and it is also much higher in winter than in spring. That warming temperatures reduce the need for heating is the one of the main reasons. In January 2020, the spatial distribution of PM2.5 concentrations was nearly the same as in January 2019. However, in February 2020, the PM2.5 concentration decreased sharply compared with February 2019, especially in north China. The PM2.5 concentration for most cities in north China was > 100 μg/m3 in 2019, but it decreased to < 80 μg/m3 in 2020, which suggests lockdown measures had a notable impact on PM2.5 emissions. In March 2020, the PM2.5 concentrations were slightly lower in 2020 than in 2019. However, in April 2020, the concentration was nearly the same as it was in 2019. By this month, lockdown measures had been removed due to a large decrease in positive COVID-19 cases in China, leading to PM2.5 emissions returning to near-normal levels.
Figure 1. Spatial distribution of PM2.5 concentrations in China, January–April 2019 versus 2020.
This visualization indicates that the lockdown effect on reducing PM2.5 concentrations may only be temporary. How to decrease PM2.5 concentrations remains a complicated problem, particularly after the COVID-19 pandemic and with economic recovery pressing. The Chinese government should focus on dealing with a possible rebound in PM2.5 concentrations followed by economic growth in order to make up for the economic losses incurred during the COVID-19 outbreak.
DISCLOSURE STATEMENT
No potential conflict of interest was reported by the author(s).
Additional information
Funding
REFERENCES
- Le Quéré, C., Jackson, R. B., Jones, M. W., Smith, A. J. P., Abernethy, S., Andrew, R. M., De-Gol, A. J., Willis, D. R., Shan, Y., Canadell, J. G., Friedlingstein, P., Creutzig, F., & Peters, G. P. (2020). Temporary reduction in daily global CO2 emissions during the COVID-19 forced confinement. Nature Climate Change, 10(7), 647–653. https://doi.org/https://doi.org/10.1038/s41558-020-0797-x
- Mu, Q., & Zhang, S. (2013). An evaluation of the economic loss due to the heavy haze during January 2013 in China. China Environmental Science, 33(11), 2087–2094. https://doi.org/https://doi.org/10.3969/j.issn.1000-6923.2013.11.025 (In Chinese)