
ABSTRACT
The COVID-19 pandemic hit the world hard. It has induced many abrupt changes, including lockdowns and business closures. Using changes in local public transit usage as proxies of mobility patterns in a typical high-density city where public transit carries ≥ 90% of passenger trips, this featured graphic geovisualizes to what degree human mobility patterns in Hong Kong were affected by the pandemic and related local and remote events such as the Wuhan lockdown and the Hong Kong government’s ‘work from home’ policy, where the patterns are affected the most, and possibly by/after which event(s). The visuals show that trips to and from business and commercial districts, low- to middle-income new towns, and station areas near the checking point serving cross-border visitors/residents might be most affected.
In past few decades, abrupt changes caused by economic and financial crises, social movements, terrorist attacks, and outbreak of pandemics/epidemics have become increasingly commonplace across countries and regions. Taking Hong Kong as an example, it has experienced, and is still experiencing, the impacts of the following: the 2003 SARS outbreak, the 2007/08 Asian Financial Crisis, the 2007–2010 Global Financial Crisis, the 2014 Umbrella Movement, the Anti-Extradition Unrests (2019–present), and the COVID-19 pandemic (2020–present). Of these events, the COVID-19 pandemic has resulted in particularly acute impacts owing to responses including lockdown and school/business closures alongside the health and well-being impacts of the virus itself. In face of the pandemic and its subsequent impacts, local institutions and individuals have undertaken many (unprecedented) countermeasures, which have profoundly affected their respective operations and modes of working.
Like other Asian metropolises such as Seoul, Tokyo and Singapore, Hong Kong is a typical high-density city where public transit carries a large share (≥ 90%) of passenger trips. The COVID-19 pandemic and related events’ impacts on human mobility patterns can be encapsulated by the changes in local public transit usage. By exploiting the ≥ 20 million local smartcard swipe records on four special days, we visualized the top 30 mass transit (metro) station pairs that produced the most passenger flows and corresponding stations with the most incoming/outgoing trips ().Footnote1 The four days are: 17 (Friday), 22 (Wednesday), 24 (Friday) and 29 January (Wednesday) 2020. We assume that comparing visuals of 17 and 24 January allows us to detect probable impacts of the 23 January Wuhan Lockdown event on the local metro usage, whereas comparing geovisuals of 22 and 29 January enables us to estimate the probable impacts of both the Wuhan Lockdown event and the Hong Kong government’s ‘work from home’ policy, which took effect on 28 January.
Figure 1. Travel pattern of the Mass Transit Railway (MTR). Hong Kong, on 17 January 2020.
Note: Station codes: 01, Central; 02, Wan Chai; 03, Causeway Bay; 04, Tim Sha Tsui; 05, Mong Kok; 06, Sham Shui Po; 07, Kowloon Bay; 08, Kwun Tong; 09, Sheung Shui; 10, Lo Wu; 11, Yuen Long; 12, Tin Shui Wai; 13, Siu Hong; 14, Tuen Mun; 15, Lok Ma Chau; 16, Prince Edward; 17, Kwai Fong; 18, Long Ping; 19, Tseun Wan West; 20, Tai Wai; 21, Po Lam; 22, Ma On Shan; and 23, Wu Kai Sha.
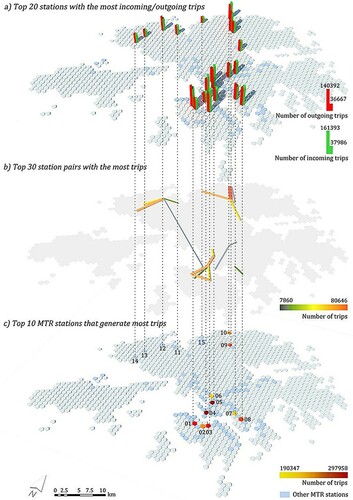
Figure 2. Travel pattern of the MTR on 24 January.
Note: For station codes, see .
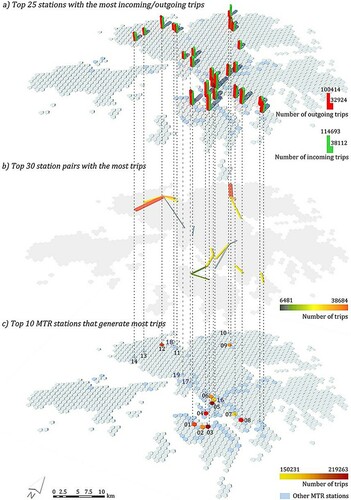
Figure 3. Travel pattern of the MTR on 22 January.
Note: For station codes, see .
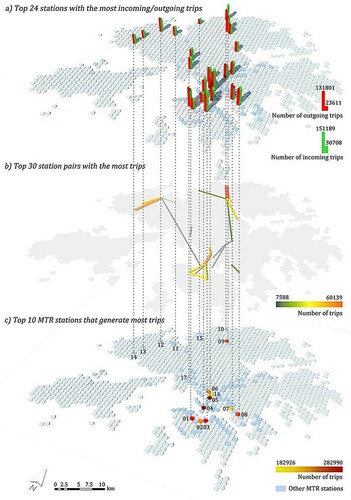
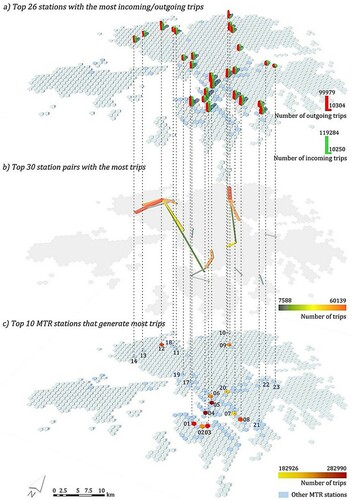
Figure 4. Travel pattern of the MTR on 29 January.
Note: For station codes, see .
Comparing and indicates that five more metro stations were involved in the top 30 metro station pairs that produced the most passenger flows on 24 January. This means that despite the Wuhan Lockdown event, riders still travelled widely within the portion of the local metro network that saw the most passenger flows. However, most of the stations therein saw at least 10% fewer incoming and outgoing trips and their respective rankings changed notably as compared with 17 January. In addition, the passenger flows between other station pairs in the local metro network also changed between 17 and 24 January. Most notably, Causeway Bay–Central–Tim Sha Tsui–Mong Kok, the most prominent business and commercial corridor in the city, experienced significant decline. By contrast, Tin Shui Wai, a new town with much low- to middle-income residents in the suburb, enjoyed more passenger flows between itself and several neighbouring metro stations such as Yuen Long, Tuen Mun and Siu Hong. Interestingly, between Lo Wu, a metro station serving the checking point between Mainland China and Hong Kong, and Sheung Shui, a neighbourhood nearest to Lo Wu with many commercial facilities and shops serving cross-border customers, the corridor remained the most heavily used on both 17 and 24 January.
After the local ‘work from home’ policy was introduced on 28 January, the metro stations that were involved in the top 30 metro station pairs that produced the most passenger flows changed quite significantly, especially in the south and east of the New Territories. Much fewer incoming and outgoing trips were observed on 29 January as compared with 17, 22 and 24 January, respectively. Some stations saw as much as a 50% decrease between 22 and 29 January. For those who still travelled by metro on 29 January, the spatial distribution of their trip origins, destinations and trajectories also changed quite significantly, if judged by the top stations and station pairs with the most passenger trips. Notably, Tin Shui Wai and several neighbouring metro stations carried more trips, whereas the Causeway Bay–Central–Tim Sha Tsui corridor experienced significant decline in passenger flows and were no longer among the top 10 busiest corridors.
Comparing the pre- and post-lockdown patterns reveals how COVID-19 significantly impacted human mobility patterns, where in this visualization we use top metro station pairs with the most passenger data as a proxy. The Hong Kong visuals show that trips to and from business and commercial districts, low- to middle-income new towns, and station areas near the checking point serving cross-border visitors/residents might be affected the most.
DISCLOSURE STATEMENT
No potential conflict of interest was reported by the authors.
Additional information
Funding
Notes
1 We chose the top 30 pairs of stations because they saw more pronounced differences in incoming and outgoing trips before and after the two special events: the Wuhan lockdown (the remote event) and the ‘work from home’ mandate (the local event) that others.