
 ?Mathematical formulae have been encoded as MathML and are displayed in this HTML version using MathJax in order to improve their display. Uncheck the box to turn MathJax off. This feature requires Javascript. Click on a formula to zoom.
ABSTRACT
Comparative research on youth employment has mostly focused on differences between countries or regimes of youth transitions. The territorial differentiation below country level has been less explored, notwithstanding the potential impact on youth-life chances and the territorial cohesion of the European Union. This paper aims at deepening into the investigation of regional variations in patterns of youth labour market chances. To do this, we build on a composite indicator measuring regional youth labour market integration (YLMI) as a comprehensive measure of contextual fragilities (or strengths) of regional youth labour markets. We provide both comparative and longitudinal views over 15 years (2004–18). Furthermore, we explore the impact of contextual factors related to economic conditions, labour market and demographic trends on the regional patterns of youth integration in the labour market.
INTRODUCTION
School-to-work transitions have a strong impact on the subsequent working career and life chances of young people. Lack of labour market accessibility worsens youth opportunities and might also fuel political discontent (Scandurra et al., Citation2020), thus representing a crucial challenge both for European Union (EU) territorial cohesion and political sustainability. This is especially relevant in the wake of the Covid-19 pandemic, since economic downturns tend to disproportionately affect young people (Pastore, Citation2015), as confirmed by research on youth employment in the aftermath of the Great Recession of 2008 (O’Higgins, Citation2010).
Recent debate on youth employment and territorial disparities highlights the importance of exploring subnational variation in the research agenda on youth (Iammarino et al., Citation2018). Comparative research has mostly considered differences in youth transitions between countries or regimes (Raffe, Citation2014), or has started exploring the territorial issue by focusing on single indicators, that do not account for the multiple dimensions of youth labour market integration (Scandurra et al., Citation2020). This might impinge on the effectiveness of European-wide place-neutral policies, which may be ineffective in addressing problems of territorially uneven youth labour market integration.
This contribution aims at more deeply analysing regional variations in labour market chances for young people in Europe. Which patterns of youth labour market integration can be identified across European regions and what is the impact of the socio-economic regional context on these patterns? To answer our research questions, we build on a composite indicator for measuring regional youth labour market integration (YLMI), looking at three dimensions: access, duration of transition and exclusion.
We interpret the YLMI index as a comprehensive measure of contextual fragilities (or strengths) of regional youth labour markets. First, we provide both a comparative view and a longitudinal evolution over a timespan of 15 years (2004–18), a critical period encompassing the Great Recession and its immediate aftermath. Second, we explore the effect of contextual factors related to the economy, the structure of the labour market, and demographic and mobility trends, on the regional patterns of youth integration in the labour market.
Our results show persisting paths of differentiation across groups of regions and evidence of untapped potential due to the lack of opportunities for youth labour market integration. This article provides valuable information for policymakers because it helps to identify dynamic and lagging regions in Europe, as well as contextual conditions to be considered in the design of policies addressing youth employment and social integration.
DETERMINANTS AND TERRITORIAL VARIATIONS OF YOUTH EMPLOYMENT
The transition from school to work is a crucial moment in individuals’ working lives, as spells of unemployment or precarious employment may have scarring effects on future employment and earnings prospects (O’Higgins, Citation2010). Youth employment has been diagnosed as the result of multiple factors (O’Reilly et al., Citation2015), such as individual motivations or the impact of socio-economic conditions and institutions governing school-to-work transitions (Brzinsky-Fay, Citation2017).
In this article, we restrict our focus on socio-economic contextual factors, related to (1) macroeconomic and labour market conditions (De Lange et al., Citation2014); and (2) demographic trends, such as the dynamics of youth mobility (King & Williams, Citation2019). The economic cycle and the labour market structure are major factors impacting youth employment; economic downturns strongly affect young people, as outsiders with scarce work experience and networks (Pastore, Citation2015). As for demographic trends, the size of the youth population defines the potential labour supply of a country or region. Inflows or outflows of migration and youth mobilities also contribute to shaping the characteristics of regional and national youth labour markets (O’Reilly et al., Citation2015). Increases in the labour force, driven by a growing share of the population that enters working age or by labour migration, may lead to high competition for jobs in certain countries. In countries or regions of out-flowing migration, a declining share of youth may also bring reduced competition for labour market access, and thus to lower levels of unemployment (Scandurra et al., Citation2021). However, emigration risks exacerbating brain-drain dynamics, possibly leading to labour and skill shortages in the long term.
We address two main limitations of comparative literature on youth labour market integration: (1) the limited comparative evidence at the regional level, overlooking the significant territorial disparities; and (2) the limited conceptualization and empirical measures of previous comparative explorative studies at regional level, which restrict the focus on specific dimensions of youth integration.
Starting with the first point outlined, comparative research on school-to-work transitions and youth employment has relied more on cross-country, cross-sectional comparison, while the territorial pattern of differentiation of youth labour markets has been less explored (Raffe, Citation2014). This is partially due to the limited availability of Europe-wide comparable data on youth labour market at the subnational level (Pop et al., Citation2019). Recent contributions show significant regional and territorial differences in youth unemployment patterns (Bruno et al., Citation2014; Möller, Citation2017), paving the way for further exploration. However, coming to the second point, these studies provide valuable comparative evidence on single indicators, for instance youth unemployment or not in employment, education or training (NEET) rates, but they do not account for the multifaceted complexity of youth labour market integration (O’Reilly et al., Citation2015; Scandurra et al., Citation2020).
To address the previously mentioned limitations, in the following sections we employ a multilevel growth curve model to identify patterns of variation across groups of regions and to explore the effects of socio-economic contextual conditions on youth chances on the labour market, using a composite indicator that encompasses several dimensions of youth integration.
METHODOLOGY AND DATA
Our analysis builds on the YLMI index, a recently developed composite indicator measuring youth labour market integration (Cefalo et al., Citation2020).
First, the scope of the analysis goes beyond the country level to account for territorial variations. Second, the YLMI index encompasses several aspects of youth integration as it considers employment rates, differentiated according to educational qualifications, together with exclusion measures. The data used to construct the indicator were extracted from the European Union Labour Force Survey (EU-LFS), for 271 NUTS-2 regions in Europe, which pertain to the EU-27, Switzerland and Norway. The timespan considered is 2004–18, which is a period of radical change for the EU in terms of its enlargement and macro- and socio-economic changes, including the Great Recession of 2008 and its aftermath.
The YLMI combines three underlying dimensions, based on previous research and conceptualization on school-to-work transitions and youth (un)employment (Cefalo et al., Citation2020; De Lange et al., Citation2014; Quintini et al., Citation2007):
Access to employment by educational qualifications, classified according to the International Standard Classification of Education (ISCED 2011), using the following sub-indicators: share of employed aged 20–34 with ISCED 3–4 (upper-secondary education) and 5–8 (tertiary education). This dimension captures the match between educational qualifications and employment.
Duration of transition between leaving education and job access, measured through the employment rate of young people aged 20–34, three years after having attained upper-secondary or tertiary education (ISCED 3–4 and 5–8). This dimension refers to the time needed for youth to transition into employment.
Exclusion, measured by the NEET rate 15–24, an indicator of inactivity and ‘joblessness’ that includes young people not employed nor in formal education or training, and the unemployment ratio 18–24, calculated as the share of unemployed youth as a percentage of the total population of the same age.Footnote1 This dimension covers different degrees of youth labour market exclusion.
The selected variables on the first two dimensions cover the group aged 20–34, starting at 20 to limit the impact of variations in educational programmes. The variables on the third dimension include a younger age range to account, at least partially, for the results of early exclusion dynamics.
In order to build the index, confirmatory factor analysis was performed to explore the factor structure of the above-mentioned dimensions: the first factor accounts for 85% of the overall variance of the observed items, showing the high accuracy in summarizing the information provided by underlying variables composing the index. Factor loading of each observed item exceeds 0.787. This shows that all the sub-indicators significantly contribute to the composition of the index.Footnote2 Finally, the items were aggregated through geometric mean index numbers using benefit-of-the-doubt weighting (Van Puyenbroeck & Rogge, Citation2017). The YLMI ranges between 0 and 1. It can be interpreted as the territorial capacity of absorption of the youth labour supply and therefore as a measure of regional labour market chances for young people.
EMPIRICS
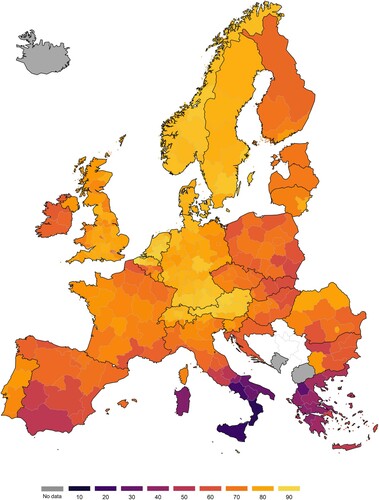
shows the geometric mean of YLMI over the period. The map reveals a combination of cross-country and cross-regional variations, with pronounced internal differentiations especially in Italy and Spain, but also, for instance, in Belgium, the UK, France and Poland. The highest values of YLMI are reported in Northern and Central Europe, in the NUTS-2 regions of Brussels, Upper Austria, Oslo and all regions of the Netherlands. On the other hand, the darker areas in the map show the lowest values of YLMI, which are located in the Mezzogiorno of Italy (especially in Sicily and Campania), in most Greek regions, and in the Spanish regions of Andalusia and Extremadura.
Figure 1. Youth labour market integration (YLMI) scores: geometric mean by NUTS-2, 2004–18, in centiles.
Further, we estimate a multilevel growth curve model (Jones et al., Citation1992) to explore the effects of contextual conditions related to the economy, the labour market and migration flows on the pattern of regional changes in youth labour market integration. Our approach considers inter-regional differences in intra-regional change over time by modelling variance and covariance. We fit an overall change function for the whole sample, splitting the regions according to gross domestic product (GDP) quintiles. The model can be written as follows:
where YLMIij is the YLMI of region i in time j; β1jtij is the yearly rate of change of YLMI; β2jt2ij is the yearly rate of change of YLMI squared, to capture non-linear rate of change; β3GDPQ1j + β4GDPQ2j + β5GDPQ4j + β6GDPQ5j are dummies groups according to regional GDP quintiles* – the third GDP quintile is the reference group; β8tijGDPQ1j + β9tijGDPQ2j + β10tijGDPQ4j + β11tijGDPQ5j are interaction terms between GDP quintile and rate of change in the YLMI; β12MIGij is the regional crude migration rate plus adjustment* of region i in time j; β13HSij is the share of active population of region i employed in science and technology sectors* in time t; β14TERij is the share of the population in region i aged 25–64 years with tertiary education attainment* in time t; and u0j∼N (0, σ2u0) is a regional-specific random effect capturing the effects on the dependent variable YLMI of unmeasured regional characteristics with values that are fixed over time.
reports the results from the multilevel growth model. The combination of the coefficients of year and year squared shows a negative non-linear year trend of YLMI over the period. This means that the decrease of YLMI is particularly evident during the Great Recession and its aftermath, while there is a slow recovery starting from 2013 onwards. We also find a positive and significant relationship between the level of GDP and YLMI. However, the estimates show heterogeneous effects across GDP quintiles, which are particularly strong and negative for the poorest regions (with GDP < 60% of the EU average), compared with regions with GDP between 93% and 106% of the EU average (which is set as the reference group). Further, when examining the different trajectories of growth according to the GDP quintile (the interaction between year and regional GDP quintile), the estimates show heterogeneous rates of change, that is, differentiated trajectories among groups of regions in the last 15 years. In detail, the coefficients are significant and positive for regions with GDP < 60% of the EU average and, slightly, for regions with GDP > 137% of the EU average. This suggests a slow catching-up of poorest regions to the average, but also a slightly higher rate of change in the richest regions, compared with the average. Among the control variables, we found that the migration rateFootnote3 and the shares employed in science and technology have a significant positive effect on YLMI, while the share of tertiary educated population has a negative effect.
Table 1. Multilevel growth model of Youth Labour Market Integration (YLMI).
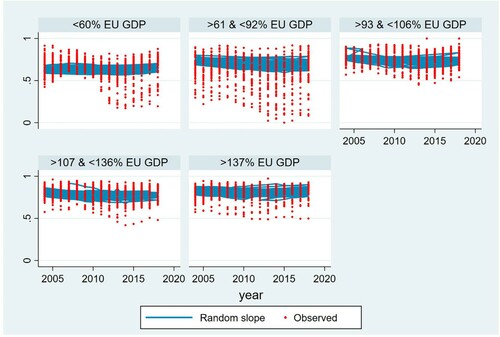
To examine the results of the model visually, plots the expected YLMI score by GDP quintiles over the period, showing the regional patterns of evolution of YLMI. demonstrates that the first and, particularly, the second quintile GDP regions (with GDP between 61% and 92% of the EU average) show a higher spread in YLMI scores and, consequently, diverse growth across the period. However, while a trajectory of improvement is detectable for the first quintile (poorest regions), this is not true for the second quintile, as the interaction of this group with the year in is not significant. This second group includes Italian, Greek and Spanish regions which have very low YLMI scores, have suffered the most during the Great Recession and its aftermath, but that are not among the EU poorest regions. These estimates are consistent with alternative specifications using fixed effect models reported in Table A1 in Appendix A in the supplemental data online.
Figure 2. Youth labour market integration (YLMI) simulated curve by gross domestic product (GDP) quintile, 2004–18.
DISCUSSION
The evidence presented on youth labour market integration allows us to detect and observe specific patterns within countries and across groups of regions. Our results confirm that homogeneity below the national level should not be taken for granted (Scandurra et al., Citation2020), notwithstanding the influence of national institutions and transition regimes (Pastore, Citation2015).
The YLMI index can be interpreted as a measure of regional labour market chances for young people. Its trajectories of change also reveal the relative strength and resilience of European territories in responding to and coping with the economic cycle. This was relevant in the aftermath of the Great Recession and it is specifically important in the post-Covid-19 economy, since young people are usually more highly affected by economic downturns. The longitudinal trend of YLMI confirms these observations, as the index shows a marked decline after 2008 and a slow rise after 2013. Looking at the macro-determinants on YLMI values, we find that regional economic conditions had a strong effect on youth labour market integration over the past decade, supporting previous evidence on the determinants of youth unemployment at national level (De Lange et al., Citation2014). Regions with low GDP also show a lower YLMI. Conversely, regions with higher GDP, regions that attract internal and international migration flows and with dynamic labour markets seem to provide far better and more stable conditions for youth labour market integration.
Our findings allow us to go further than these general observations, distinguishing groups of regions, according to GDP quintiles, with differentiated patterns of youth labour market integration. Over the period, we observed only a slight convergence of YLMI across groups of regions, starting from highly differentiated socio-economic levels. The poorest group in 2004 (< 60% of the EU average GDP) showed an improving trend, especially in the most recent years in the period studied. This group includes several regions from Eastern Europe that benefited from the process of European integration both in terms of economic and youth labour market conditions. Further, the wealthiest group (> 137% of the EU average GDP), mainly composed of German, Dutch and Northern European regions, displayed slight improvements in the levels of YLMI. The other groups did not exhibit significant changes in the trajectory over the last 15 years. Among them, we point out that the group with GDP between 60% and 92% of the EU average, composed of several regions from the South of Europe that were severely affected by the crisis, did not show any significant sign of improvement and catch-up with better-off regions. These regions seem to have not significantly benefited from EU enlargement-related positive spillovers (as was the case for partially catching-up Eastern European regions) and large-scale policies, such as the Youth Employment Initiative. Conversely, they have been negatively affected by the Great Recession of 2008 and they risk being severely hit by the consequences of the Covid-19 pandemic, due to a combination of pre-existing scarce labour market chances and cumulative contextual disadvantages.
The multilevel growth model also suggests that demand for dynamic and highly qualified workers has a positive effect on life chances. Highly technologically specialized regions seem to enable labour market integration of young people. This does not hold true for the supply of work, as the negative effect of the share of tertiary educated population seems to point out to a sort of mismatch or displacement effect in regions with young people with higher education attainment. Demand-side factors seem to be more relevant than human capital. This finding suggests that a higher supply of tertiary-educated graduates may have limited or even slightly negative effects on regional job accessibility for young people, if disconnected from the contextual characteristics of the local economy and labour market. Moreover, we found a positive association between migration and YLMI, which could point to pull-factors and brain-drain dynamics, so that more educated young people are attracted to areas with higher GDP and dynamic labour markets. These findings should be further explored because they could result from specific regional traits that combine to increase mismatches or displacement for qualified young people in certain clusters of regions. More studies are needed to clarify these relationships from a comparative and cross-regional perspective. For these reasons, we stress the importance of up-to-date and more detailed evidence at a subnational level for informed policies for young people.
CONCLUSIONS
In this paper we investigated patterns and contextual determinants of regional variations in youth labour market chances. To achieve these objectives, we built on the YLMI index, which provides a comparative and longitudinal measure of youth labour market integration for 271 NUTS-2 regions in Europe, over the period 2004–18. We found relevant variations in patterns of youth labour market integration below the country level and across groups of European regions, clustered according to economic conditions. Our results also show a positive effect of employment in science and technology and in-flows of migration on YLMI, and a negative effect of the share of tertiary educated youth.
Limitations of our research relate to the availability of more detailed, homogenized and EU-wide regional data on youth employment. Alternative measures not exclusively based on employment accessibility but looking, for instance, at under-employment, part-time, temporary work and wages are needed to further unpack the variation in youth life chances. Moreover, we focused on the role of contextual socio-economic conditions. Further research should also investigate the role of individual characteristics and institutional determinants on youth labour market integration at a regional level. Given the sensitivity of youth employment to economic cycles and downturns, research should urgently examine the effects of the Covid-19 pandemic crisis on the various dimensions of youth employment and its subnational impacts.
This article raises important implications for European employment and Cohesion Policies. Our analysis helps to identify dynamic and lagging regions, as well as contextual conditions to be evaluated in the design and implementation of policies addressing young people, a group which represents, to a large extent, the future of Europe. The evidence provided challenges the concept of Europe as a converging machine (Ridao-Cano & Bodewig, Citation2018). Moreover, it could warn against the risk of focusing exclusively on supply-side policies targeting qualifications, overlooking the connection between skill formation and contextual characteristic of the economy and labour market. Place-sensitive policies aimed at fostering the economic ecosystems of deprived regions, without damaging the competitive drive of most developed regions, are therefore to be recommended.
By looking at youth labour markets, the analysis confirms the persistence of profound regional divides across EU territories, as previous research on territorial disparities also identified (Iammarino et al., Citation2018). In the context of this paper, the pronounced spatial differences mirror the traits of a potential geography of young people with diverging life chances and employment accessibility. The persistent lack of employment opportunities might undermine socio-economic convergence, especially for peripheral areas in the South of Europe, and fuel the discontent of young people with weak labour market prospects trapped in lagging regions, referred to as ‘places that don’t matter’ (Rodriguez-Pose, Citation2018). This might significantly affect cohesion and future economic and political outcomes in the EU.
Appendix Table A1
Download Rich Text Format File (188.6 KB)DISCLOSURE STATEMENT
No potential conflict of interest was reported by the authors.
Additional information
Funding
Notes
1 Both sub-indicators are calculated on the total youth population: this is an advantage compared with the youth unemployment rate, which is more influenced by cross-national differences in the organization of education systems (Tamesberger, Citation2017).
2 Additionally, the Cronbach alpha test (0.927) revealed that the observed items form an internally reliable scale, thus allowing a coherent interpretation of the direction and meaning of the indicator.
3 The crude rate of net migration plus adjustment is defined as the ratio of net migration (including statistical adjustment) during the year to the average population in that year. The value is expressed per 1000 persons.
Related Research Data
REFERENCES
- Bruno, G. S. F., Marelli, E., & Signorelli, M. (2014). The rise of NEET and youth unemployment in EU regions after the crisis. Comparative Economic Studies, 56(4), 592–615. https://doi.org/https://doi.org/10.1057/ces.2014.27
- Brzinsky-Fay, C. (2017). The interplay of educational and labour market institutions and links to relative youth unemployment. Journal of European Social Policy, 27(4), 346–359. https://doi.org/https://doi.org/10.1177/0958928717719198
- Cefalo, R., Scandurra, R., & Kazepov, Y. (2020). Youth labor market integration in European regions. Sustainability, 12(9), 3813. https://doi.org/https://doi.org/10.3390/su12093813
- De Lange, M., Gesthuizen, M., & Wolbers, M. H. J. (2014). Youth labour market integration across Europe. European Societies, 16(2), 194–212. https://doi.org/https://doi.org/10.1080/14616696.2013.821621
- Iammarino, S., Rodriguez-Pose, A., & Storper, M. (2018). Regional inequality in Europe: Evidence, theory and policy implications. Journal of Economic Geography, 53(2), 898–924. https://doi.org/https://doi.org/10.1093/jeg/lby021
- Jones, K., Johnston, R. J., & Pattie, C. (1992). People, places and regions: Exploring the use of multi-level modelling in the analysis of electoral data. British Journal of Political Science, 22(3), 343–380. https://doi.org/https://doi.org/10.1017/S0007123400006426
- King, R., & Williams, A. M. (2019). Editorial introduction: New European youth mobilities. Population, Space and Place, 24(1), 1–9. https://doi.org/https://doi.org/10.1002/psp.2121
- Möller, J. (2017). Youth unemployment in Europe from a regional perspective. CESifo Forum, 18(2), 11–18.
- O’Higgins, N. (2010). The impact of the economic and financial crisis on youth employment. ILO.
- O’Reilly, J., Eichhorst, W., Gábos, A., Hadjivassiliou, K., Lain, D., Leschke, J., McGuinness, S., Kureková, L. M., Nazio, T., Ortlieb, R., & Russell, H. (2015). Five characteristics of youth unemployment in Europe: Flexibility, education, migration, family legacies, and EU policy. Sage Open, 5(1), 1–19.
- Pastore, F. (2015). The youth experience gap: Explaining national differences in the school-to-work transition. Springer. https://doi.org/https://doi.org/10.1177/2158244015574962
- Pop, A., Kotzamanis, B., Muller, E., McGrath, J.C., Walsh, K., Peters, M., Girejko, R., & Dietrich, C. (2019). YUTRENDS – Youth unemployment: Territorial trends and regional resilience. ESPON.
- Quintini, G., Martin, J. P., & Sébastien, M. (2007). The changing nature of the school-to-work transition process in OECD countries. IZA Discussion Paper 2582, IZA.
- Raffe, D. (2014). Explaining national differences in education–work transitions: Twenty years of research on transition systems. European Societies, 16(2), 175–193. https://doi.org/https://doi.org/10.1080/14616696.2013.821619
- Ridao-Cano, C., & Bodewig, C. (2018). Growing united: Upgrading Europe’s convergence machine: Overview. World Bank Group.
- Rodriguez-Pose, A. (2018). The revenge of the places that don’t matter (and what to do about it). Cambridge Journal of Regions, Economy and Society, 11(1), 189–209. https://doi.org/https://doi.org/10.1093/cjres/rsx024
- Scandurra, R., Cefalo, R., & Kazepov, Y. (2020). School to work outcomes during the Great Recession, is the regional scale relevant for young people’s life chances? Journal of Youth Studies, 1–25. https://doi.org/https://doi.org/10.1080/13676261.2020.1742299
- Scandurra, R., Cefalo, R., & Kazepov, Y. (2021). Drivers of youth labour market integration across European regions. Social Indicators Research, 154(3), 835–856. https://doi.org/https://doi.org/10.1007/s11205-020-02549-8
- Tamesberger, D. (2017). Can welfare and labour market regimes explain cross-country differences in the unemployment of young people? International Labour Review, 156(3–4), 443–464. https://doi.org/https://doi.org/10.1111/ilr.12040
- Van Puyenbroeck, T., & Rogge, N. (2017). Geometric mean quantity index numbers with benefit-of-the-doubt weights. European Journal of Operational Research, 256(3), 1004–1014. https://doi.org/https://doi.org/10.1016/j.ejor.2016.07.038