
ABSTRACT
This paper empirically visualizes the spatial patterns of the inter-provincial electricity flows in relation to the distribution of gross domestic product (GDP) per capita using spatial geographical information system (GIS) and cartograms. It highlights how developed provinces in eastern China are net importers of electricity from western and central China, which creates a west–east power transmission pattern and helps deepen the regional economy disparity.
The distribution of energy resources exerts a powerful effect in regional development, conditioned through social, political, environmental, economic, and technological structure and relations (Bridge, Citation2018; Bridge et al., Citation2013).
As the world’s largest electricity producer and consumer, China faces a significant spatial mismatch in electricity supply and demand. Most of its electricity resources are in the western provinces, while the load centres are clustered in the east (Chen et al., Citation2010).
Based on the statistic book of the Chinese electricity industry (Chinese Electricity Council, Citation2020), offers a cartographic representation of the level of electricity self-sufficiency rate related to the distribution of gross domestic product (GDP) per capita and interprovincial electricity flows between 31 provinces on the Chinese mainland. Here the self-sufficiency rate of electricity is shown as the ratio of production to consumption. The size of the nodes and width of lines denote the size of the electricity flow of the corresponding province and the pair line, respectively.
Figure 1. Inter-provincial electricity flow in mainland China in 2019 on an equal gross domestic product (GDP) per capita.
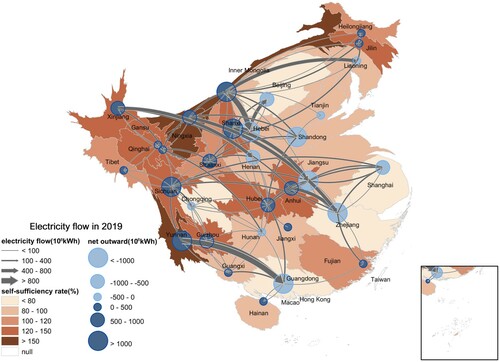
We found that most provinces in eastern China only have capacity to meet no more than 80% of their electricity consumption by itself compared with its high level of GDP per capita. In contrast, provinces in western China are the main exporters of electricity, with a low level of GDP. Most of the interprovincial electricity flows are structured from west and central China to the east of the country.
Energy networks in China are significant components of the green energy transition agenda as well as the proliferation of regional disparities. Through inter-provincial power transmissions, greener energy production through the likes of hydro, wind and solar power technologies further mitigates the reliance on thermal power and responds to the pressing global need to reduce CO2 emissions. However, the risk in such a transition is that it serves to strengthen the industrial lock-in of western provinces and their associated industries which could facilitate the widening of the west–east gap in China.
ACKNOWLEDGEMENTS
The authors would like to thank the reviewer and editors for suggestions and edits.
DISCLOSURE STATEMENT
No potential conflict of interest was reported by the authors.
Additional information
Funding
REFERENCES
- Bridge, G. (2018). The map is not the territory: A sympathetic critique of energy research’s spatial turn. Energy Research & Social Science, 36, 11–20. https://doi.org/https://doi.org/10.1016/j.erss.2017.09.033
- Bridge, G., Bouzarovski, S., Bradshaw, M., & Eyre, N. (2013). Geographies of energy transition: Space, place and the low-carbon economy. Energy Policy, 53, 331–340. https://doi.org/https://doi.org/10.1016/j.enpol.2012.10.066
- Chen, W., Li, H., & Wu, Z. (2010). Western China energy development and west to east energy transfer: Application of the Western China sustainable energy development model. Energy Policy, 38(11), 7106–7120. https://doi.org/https://doi.org/10.1016/j.enpol.2010.07.029
- China Electricity Council. (2020). Compilation of statistics of China's power industry in 2019. Beijing: China Electricity Statistic and Data Center.