
ABSTRACT
Knowledge is an essential ingredient for economic development, growth and gaining a competitive advantage. In order to produce novel and valuable knowledge, it is advantageous, perhaps vital, to rely on insights gained from prior research efforts. Those knowledge spillovers (KS) provide the rationale for sustained economic growth and produce unique place-based knowledge spaces. Due to the spatial embeddedness and stickiness of knowledge, most investigations mainly pay attention to the localized nature of KS, but what about those spillovers from other jurisdictions, or perhaps even from across the globe? To analyse the role played by international KS, the present study investigates to what extent international KS shape the evolution of the UK science and technology space. The first step involves creating knowledge spaces following the methodology outlined by Kogler et al. (2013; 2017) for the period 2006–15. Subsequently, we are following the paper trail of publications and patents developed by UK authors and inventors to depict to what degree international KS in specific science and technology domains have contributed to the production of novel knowledge in the UK. The results indicate that four out of five citations made in publications and patents in the UK are the works of authors and inventors residing elsewhere. This has important policy implications considering recent tendencies to curtail trade and the free movement of labour, all of which contribute to the diffusion of knowledge.
KNOWLEDGE SPILLOVERS: CONTEXT AND THE KNOWLEDGE SPACE
Knowledge and learning that subsequently translate into scientific advances, and novel goods and processes is key for economic development and the competitiveness of firms, regions and nations (Feldman & Kogler, Citation2010). Essentially, the innovative performance of an economy is determined by the existing stock of knowledge, the rate of knowledge production, and the extent of knowledge spillovers (KS) (Caballero & Jaffe, Citation1993). KS are of particular importance in this context as they provide the rationale for sustained economic growth (Romer, Citation1990).Footnote1 They are the results from research and development activities undertaken in one sector that are appropriated by other parts of the same or different sector, and where these may serve as a valuable input in the knowledge-creation process (Griliches, Citation1979). Thus, most novel knowledge is the product of recombination activities where various existing knowledge domains are combined in a previously undiscovered way (Schumpeter, Citation1942). While the public good aspects of knowledge, that is, the non-rivalry and non-excludability characteristics (Arrow, Citation1962), perhaps indicate that knowledge should be circulating freely in space, this is of course not the case and there is ample evidence that in terms of access not only location matters (Marshall, Citation1890) but also that KS are geographically localized (Jaffe et al., Citation1993).
Based on these insights, relevant studies have predominantly paid attention to the local and regional scale of KS, frequently ignoring the international dimension of the total stock of knowledge that exists in the world. Given that a significant amount of knowledge is tacit in nature and thus embedded in individuals rather than available in codified form that enables diffusion to take place more easily, this might not come as a surprise (Gertler, Citation2003). Nevertheless, a real research gap seems to exist, which in turn leads to the following research question: To what extent to international KS contribute to the evolution of place-based knowledge spaces?
To answer this, we rely on evolutionary economic geography principles (Kogler, Citation2016) and the knowledge space methodology developed by Kogler et al. (Citation2013), which later has also been used in a number of regional analyses on various topics (i.e., Feldman et al., Citation2015; Kogler et al., Citation2017, Citation2021; Buarque et al., Citation2020, among others). The starting point are data that contain information on distinct knowledge domains, for example, scientific fields or patent classification codes, which then enable us to determine the frequency of co-occurrence (recombination) between these. Essentially, we trust in the principle of relatedness that has been outlined and tested in a variety of settings (Hidalgo et al., Citation2018; Whittle & Kogler, Citation2020). In terms of spatial allocation, the address of an author or inventor is used to determine the place of knowledge origin.Footnote2 Further, these data also contain citations to previous works and prior art, which then enables us to follow the paper trail of resulting KS. In summary, the knowledge space represents a network where the nodes are distinct knowledge domains, the size of the node indicates the frequency of use, and the relative distance between nodes shows how frequently particular domains are combined in a single publication or invention. Associated with these nodes are citations to prior works and inventions that have been used in the development of the novel knowledge and which were developed by authors/inventors either residing in the same jurisdiction or elsewhere.
DOMESTIC AND INTERNATIONAL KNOWLEDGE SPILLOVERS IN THE PRODUCTION OF UK SCIENCE AND TECHNOLOGY
In the present investigation we take the UK as a case study and use data derived from the Web of Science database (publications) and European Patent Office (EPO) records (inventions) published and applied for in the period 2006–15.Footnote3 The final sample contains almost 80,000 patent documents that cover 608 distinct patent classification codes, and about 1.37 million publication records that span 144 science subjects.Footnote4 The count of citations regardless of their place of origin for these two data sets is 600,000 and over 6 million, respectively.
illustrates the UK science and technology space along with corresponding global map of UK international knowledge sourcing intensity, respectively. To depict to what extent intra- and international KS have contributed to the evolution of the UK knowledge spaces, we devise a colour scheme. The colour ramp ranges from dark blue (0) to white (0.5) to red (1). For a more effective visualization, and because the distribution of KS is highly skewed, we applied a log-transformation and then normalized the data by the maximum value, which, in turn, gives a range between 0 and 1, where 1 is red and indicates the maximum value of intra-UK KS. Essentially, on the low spectrum (blue) a significant amount of KS, prior art in patents or citations made in scientific publications, would have been sourced from outside the UK. In other words, UK patents and publications in domains that display a darker shade of blue in the UK science and technology space were developed by relying on knowledge that was previously developed by inventors and authors who have a non-UK residence or affiliation.
Figure 1. UK (a) science and (b) technology spaces, including global distribution of knowledge flows into the UK.
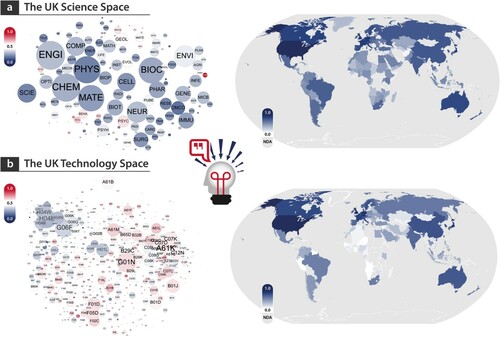
First, examine the UK science space illustrated at top-left in (a). Upon visual inspection it is evident that many of the larger scientific domains also have a relatively higher share of international KS compared with some of the smaller nodes. On the contrary, at the bottom and just centre-left of the science space one can find several nodes that display various shades of red, which in turn indicates a relatively high share of domestic KS that feed into the evolution of these science subjects. The domains that cluster include: behavioural sciences; healthcare sciences and services; education and educational research; as well as government and law, amongst others. The clustering of these domains reveals that these scientific fields are frequently combined in single publications, while the node size shows the frequency of their outputs. For example, behavioural sciences, which is the largest node in that cluster, produces many more publications (4100) than education and educational research (1300) that is just to the bottom left of it. For details on the abbreviations used in the science space as well as relative figures and shares of publications and domestic citation ratios in each of the science domains, see Tables A1 and A2 in Appendix A.
In the UK technology space that is illustrated at the bottom-left of (b) we observe one giant cluster of technology classes that benefit to a larger extent from domestic KS, as indicated by the red shades in the top right-hand corner. This cluster of knowledge domains is centred around Cooperative Patent Classification (CPC) subclass ‘A61K’ which refers to ‘Preparations for medical, dental, or toilet purposes’, a technological class important for the pharmaceutical sector, among others. Further CPC subclasses located in that quadrant of the UK technological knowledge space refers to knowledge section C of the CPC scheme, that is, ‘Chemistry; metallurgy’. Looking at the top left-hand corner, we observe the opposite pattern, that is, a cluster of technological knowledge domains that are used to produce a significant amount of patents (indicated by node size) and which are frequently combined in single innovations (the clustering of the nodes in space), but that rely heavily on non-UK prior knowledge in their development. These CPC subclasses mainly belong to knowledge sections G and H of the CPC scheme, that is, ‘Physics’ and ‘Electricity’.
Nevertheless, non-standardized results indicate that on average four out of five citations made in UK publications and patents are to works of authors and inventors residing elsewhere; for detailed non-standardized results as well as full labels for the abbreviations displayed in the science space, see Tables A1 and A2 in Appendix A.
also shows two maps, each associated with either the science (a) or technology space (b), in order to illustrate the source of international KS. It is mainly other advanced economies, for example, the United States, Germany, Japan, etc., providing knowledge inputs that are subsequently used for advancing the UK science and technology space. The colours used in the two maps follow the same scheme as shown previously in the knowledge space illustrations, and again we apply a log-transformation and then normalized the data by the maximum value due to the highly skewed distribution of global KS. In both instances, most international KS derive from the United States followed by larger shares from European counties and eventually smaller shares from the rest of the world. We certainly also observe a significant North/South divide in terms of from where KS for UK inventions and publications are sourced.
While the present investigation is mainly descriptive in nature, it certainly warrants further analysis. Nevertheless, the insights so far point to important policy implications considering recent tendencies to curtail trade and the free movement of labour, all of which contribute to the diffusion of knowledge and, if hindered, probably will decrease the absorptive capacity (Cohen & Levinthal, Citation1990) to recognize what kind of knowledge might be important for scientific and technological advancements. Given that on average four out of five patents as well as publication citations are made in non-domestic sources, this could have a disastrous impact on the evolution and competitiveness of the UK knowledge space going forward.
DISCLOSURE STATEMENT
No potential conflict of interest was reported by the author(s).
Additional information
Funding
Notes
1 Knowledge spillovers are also commonly referred to as knowledge externalities in the relevant literature.
2 Patent documents contain the detailed addresses information, or at least the name of the resident locality, for each inventor listed. This in turn allows us to place inventors in space; in the present analysis this was rather easy as each patent that had at least one UK-based inventor listed could be selected. We apply fractional counting for patents that are developed by inventors in various locations (see Kogler et al., Citation2017, for further details). Publication data derived from the Web of Science provide authors’ names and their affiliation/address. That information enables us to determine if it is a UK author, that is, an individual who lists an institution, firm or organization with an UK address. With multiple authors we follow the same fractional counting method as with inventors on patent documents.
3 The present analysis is based on data retrieved from the following: Web of Science bibliographic databases: ‘1980–2017 – Annual Science Citation Index Expanded and Proceedings-Science Combined’ and the EPO PATSTAT database.
4 For a detailed overview of individual science fields and patent classes as well as the derived UK citation ratio and total counts, Tables A1 and A2 in Appendix A. For a detailed overview of the applied patent classification scheme, that is, the Cooperative Patent Classification (CPC), and the exact definition of each CPC class, see the table provided by the standard setting organization at https://www.cooperativepatentclassification.org/cpcSchemeAndDefinitions/table.
REFERENCES
- Arrow, K. (1962). Economic welfare and the allocation of resources for inventions. In R. R. Nelson (Ed.), The rate and direction of inventive activity: Economic and social factors (pp. 609–629). Princeton University Press for the National Bureau of Economic Research (NBER).
- Buarque, B., Davies, D., Hynes, R., & Kogler, D. F. (2020). OK computer: The creation and integration of AI in Europe. Cambridge Journal of Regions, Economy and Society, 13(1), 175–192. https://doi.org/https://doi.org/10.1093/cjres/rsz023
- Caballero, R. J., & Jaffe, A. B. (1993). How high are the giants’ shoulders: An empirical assessment of knowledge spillovers and creative destruction in a model of economic growth. NBER Macroeconomics Annual, 8, 15–74. https://doi.org/https://doi.org/10.1086/654207
- Cohen, W. M., & Levinthal, D. A. (1990). Absorptive capacity: A new perspective on learning and innovation. Administrative Science Quarterly, 35(1), 128–152. https://doi.org/https://doi.org/10.2307/2393553
- Feldman, M., Kogler, D. F., & Rigby, D. (2015). Rknowledge: The spatial diffusion and adoption of rDNA methods. Regional Studies, 49(5), 798–817. https://doi.org/https://doi.org/10.1080/00343404.2014.980799
- Feldman, M. P., & Kogler, D. F. (2010). Stylized facts in the geography of innovation. In B. Hall & N. Rosenberg (Eds.), Handbook of the economics of innovation (pp. 381–410). Elsevier.
- Gertler, M. S. (2003). Tacit knowledge and the economic geography of context, or the undefinable tacitness of being (there). Journal of Economic Geography, 3(1), 75–99. https://doi.org/https://doi.org/10.1093/jeg/3.1.75
- Griliches, Z. (1979). Issues in assessing the contribution of R&D to productivity growth. The Bell Journal of Economics, 10(1), 92–116. https://doi.org/https://doi.org/10.2307/3003321
- Hidalgo, C., Balland, P.-A., Boschma, R., Delgado, M., Feldman, M. P., Frenken, K., Glaeser, E., He, C., Kogler, D. F., Morrison, A., Neffke, F., Rigby, D., Stern, S., Zheng, S., & Zhu, S. (2018). The principle of relatedness. In A. Morales, C. Gershenson, D. Braha, A. Minai, & Y. Bar-Yam (Eds.), Unifying themes in complex systems IX. ICCS 2018. Springer proceedings in complexity (pp. 451–457). Springer. https://doi.org/https://doi.org/10.1007/978-3-319-96661-8_46
- Jaffe, A. B., Trajtenberg, M., & Henderson, R. (1993). Geographic localization of knowledge spillovers as evidenced by patent citations. The Quarterly Journal of Economics, 108(3), 577–598. https://doi.org/https://doi.org/10.2307/2118401
- Kogler, D. F. (Ed.). (2016). Evolutionary economic geography: Theoretical and empirical progress. Routledge.
- Kogler, D. F., Essletzbichler, J., & Rigby, D. (2017). The evolution of specialization in the eu15 knowledge space. Journal of Economic Geography, 17(2), 345–373. https://doi.org/https://doi.org/10.1093/jeg/lbw024
- Kogler, D. F., Rigby, D., & Tucker, I. (2013). Mapping knowledge space and technological relatedness in us cities. European Planning Studies, 21(9), 1374–1391. https://doi.org/https://doi.org/10.1080/09654313.2012.755832
- Kogler, D. F., Whittle, A., & Buarque, B. (2021). The science space of artificial intelligence knowledge production: Global and regional patterns, 1990–2016. In H. Kurz, M. Schütz, R. Strohmaier, & S. Zilian (Eds.), Handbook of smart technologies. Routledge.
- Marshall, A. (1890). Principles of economics. Macmillan.
- Romer, P. (1990). Endogenous technological change. Journal of Political Economy, 64, 1002–1037.
- Schumpeter, J. (1942). Capitalism, socialism and democracy. Harper.
- Whittle, A., & Kogler, D. F. (2020). Related to what? Reviewing the literature on technological relatedness: Where we are now and where can we go? Papers in Regional Science, 99(1), 97–113. https://doi.org/https://doi.org/10.1111/pirs.12481
A
Table A1. UK technology space: present Cooperative Patent Classification (CPC) codes, and their associated UK citation ratio as well as the count of patents using the CPC listed.
Table A2. UK science space: present science subjects and their associated UK domestic citation ratio as well as the count of publications that list a specific science subject.