
ABSTRACT
Complex ecosystems characterize the Arctic Region, which experiences rapid environmental changes due to climate change. These changes are happening spatially as much as temporally. Spatiotemporal interactive three-dimensional visualization of environmental phenomena is eye-catching, while creating the foundations for the rapid understanding of Arctic complexity. The Arctic is a circumpolar region; cylinders seem suitable visual media for related data. In this case study, the visualization of anomalies of the sea ice illustrates abnormal changes, helping the viewer/user to focus on that filtered information rather than becoming lost in a multitude of information. A holistic view of dynamic environmental changes in a stand-alone visual could impact the quick understanding, response and policymaking regarding the visualized phenomena.
JEL CLASSIFICATIONS:
INTRODUCTION
This research explores and develops a stand-alone spatiotemporal three-dimensional (3D) visualization to represent the extreme anomalies of Arctic sea ice. The visualization of spatiotemporal phenomena had been proposed in the early 1970s by Hagerstrand who placed the fundamentals of representation of time and space into a single visual in cubic form (Bach et al., Citation2014; Lenntorp Citation1999). Since then, data cubes have been proposed for regional or global geographical data visualization (Mahecha et al., Citation2020). The Arctic Region is defined as a circular region; therefore, a cubical shape seems unsuitable.
The Arctic has been described in the relevant literature as a region of unique, isolated and fragile ecosystems (Kinnard et al., Citation2011). The sea ice in the Polar Regions influences global climate due to its bright surface (Qu & Hall, Citation2007). Furthermore, it is expected that higher temperatures can cause anomalies in vegetation production, both greening and browning (Miles & Esau, Citation2016). Additionally, interannual changes in sea ice concentration are likely to be linked to temperature and terrestrial vegetation changes (Bhatt et al., Citation2010). Therefore, it is essential to understand the complexity of the Arctic environment by taking individual environmental phenomena one at a time; in this study, the sea ice.
The context of the ‘data-cylinders’ includes the visualization of changes in climatic and physical phenomena in the form of time series. ‘Space’ in this scenario is placed across cycles, while ‘time’ is given along the height of the cylinder. The ability of such interactive 3D visuals to rapidly relay complex monthly information over many years aims to support awareness of the viewer/user regarding interannual changes to the sea ice.
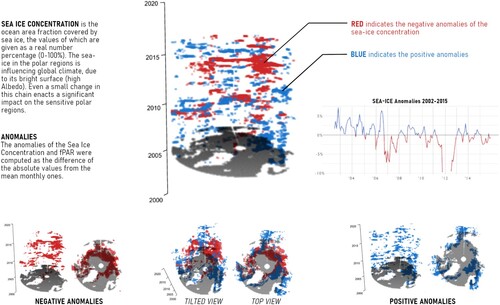
In the Arctic data cylinder (), red represents negative anomalies in sea ice concentration; blue represents the positive anomalies. At the bottom of the cylinder is a map of the Arctic Region coloured in grey. Additionally, at the side of the cylinder there is a timeline that indicates the approximate period on the cylinder along the time axis.
Figure 1. Arctic sea-ice cylinder.
Source: Author.
DATA
Sea ice concentration is the fraction of the ocean area covered by sea ice, the values of which are presented as a real percentage (0–100%). The data used for sea ice processing and analysis are derived from the European Space Agency (ESA) archives: Sea Ice Concentration (SIC) (Toudal Pedersen et al., Citation2017). Level 4 processed data are derived from a medium-resolution passive microwave satellite data source from the Advanced Microwave Scanning Radiometer series (AMSR-E and AMSR-2).
METHODS AND DEVELOPMENT
First, the data were collected and processed in R; the 168 raster layers were formed into a raster brick. Subsequently, a time-series analysis was completed, followed by a calculation of the anomalies. Anomalies were computed as a difference of the absolute values from the mean monthly ones. Following the preparation and processing of data, the next step was the development of data cylinders. The main package used was the ‘RGL’, a package of 3D real-time rendering systems for R, providing functions for 3D interactive graphics.
To allow the data to be readable for the required function, they are converted into a data frame. The extreme anomalies were then extracted into separated data frames for the positive and negative anomalies. To implement the ‘plot3D’ function in the creation of data cylinders, the dimensions used were latitude, longitude and time. The choice of the colours was made with the help of the ‘colorbrewer’ application (Brewer & Harrower, Citation2021), and the colour pallets used are colour-blind friendly.
CONCLUSIONS
The concept of the Polar data cylinders is proposed as an alternative spatiotemporal 3D interactive visual that has allowances beyond data cubes and fits perfectly in the circumpolar Arctic Region. The innovative shape of time–space visualization serves as an eye-catching map-like visual and builds a deeper understanding due to its regional focus. The ability to present complex polar spatial phenomena, such as sea ice over a long period, in a stand-alone visual is a challenge that appears to be addressed by the Polar data cylinders. Furthermore, a holistic representation of such environmental phenomena through time and space allows for quick responses and decision-making.
Supplemental Material
Download PDF (171.1 KB)ACKNOWLEDGEMENTS
The author is grateful for the constructive comments and support offered by JProf. Dr Matthias Forkel (Technical University of Dresden) and Dr Paulo Raposo (University of Twente). This paper is based on Kontou (Citation2020).
DISCLOSURE STATEMENT
No potential conflict of interest was reported by the author.
Additional information
Funding
REFERENCES
- Bach, B., Dragicevic, P., Archambault, D., Hurter, C., & Carpendale, S. (2014). A review of temporal data visualizations based on space–time cube operations. 20.
- Bhatt, U. S., Walker, D. A., Raynolds, M. K., Comiso, J. C., Epstein, H. E., Jia, G., Gens, R., Pinzon, J. E., Tucker, C. J., Tweedie, C. E., & Webber, P. J. (2010). Circumpolar Arctic tundra vegetation change is linked to sea ice decline. Earth Interactions, 14(8), 1–20. https://doi.org/10.1175/2010EI315.1
- Brewer, C., & Harrower, M. (2021). ‘ColorBrewer: Color Advice for Maps’. 2021. https://colorbrewer2.org.
- Kinnard, C., Zdanowicz, C. M., Fisher, D. A., Isaksson, E., de Vernal, A., & Thompson, L. G. (2011). Reconstructed changes in Arctic sea ice over the past 1450 years. Nature, 479(7374), 509–512. https://doi.org/10.1038/nature10581
- Kontou, D.-M. 2020. ‘Developing data cylinders to map changes and feedbacks between Arctic sea ice and vegetation’. Master's thesis, Thesis, Dresden: Technical University of Munich, Technical University of Dresden. https://cartographymaster.eu/wp-content/theses/2020_Kontou_Thesis.pdf
- Lenntorp, B. 1999. ‘Time-geography - at the end of its beginning.’ GeoJournal, 48(3), 155–58. http://www.jstor.org/stable/41147366.
- Mahecha, M. D., Gans, F., Brandt, G., Christiansen, R., Cornell, S. E., Fomferra, N., Kraemer, G., Peters, J., Bodesheim, P., Camps-Valls, G., Donges, J. F., Dorigo, W., Estupinan-Suarez, L. M., Gutierrez-Velez, V. H., Gutwin, M., Jung, M., Londoño, M. C., Miralles, D.G., Papastefanou, P., & Reichstein, M. (2020). Earth system data cubes unravel global multivariate dynamics. Earth System Dynamics, 11(1), 201–234. https://doi.org/10.5194/esd-11-201-2020
- Miles, V. V., & Esau, I. (2016). Spatial heterogeneity of greening and browning between and within bioclimatic zones in Northern West Siberia. Environmental Research Letters, 11(11), 115002. https://doi.org/10.1088/1748-9326/11/11/115002
- Qu, X., & Hall, A. (2007). What controls the strength of snow-albedo feedback? Journal of Climate, 20 (15), 3971–3981. https://doi.org/10.1175/JCLI4186.1
- Toudal Pedersen, L., Dybkjær, G., Eastwood, S., Heygster, G., Ivanova, N., Kern, S., Lavergne, T., et al. (2017). ESA Sea Ice Climate change initiative (Sea_Ice_cci): Sea Ice concentration Climate data record from the AMSR-E and AMSR-2 instruments at 25 km grid spacing, version 2.1. Application/xml. Centre for Environmental Data Analysis (CEDA, https://doi.org/10.5285/F17F146A31B14DFD960CDE0874236EE5