
 ?Mathematical formulae have been encoded as MathML and are displayed in this HTML version using MathJax in order to improve their display. Uncheck the box to turn MathJax off. This feature requires Javascript. Click on a formula to zoom.
ABSTRACT
China's population and development land have changed dramatically over the last decade. Yet, our understanding of the spatial distribution patterns of the population and built-up areas remains limited. To fill this gap, we employ China's Population Census and GlobeLand30 remote sensing data from 2010 to 2020 at the county level to geovisualize the evolution of the population and built-up area. We find an increasing correlation between built-up areas and population as a result of the urbanization of rural areas, but the rapid expansion of built-up areas has not fundamentally changed concentration of China's population over the period 2010–20.
We use demographic (China Population Census) and remote sensing data (GlobeLand30) to geovisualize the spatial distribution and temporal fluctuations of population and built-up areas in China from 2010 to 2020.
Unlike previous studies that typically focus on the provincial or prefectural city level, this regional graphic considers the patterns of change in population and built-up areas at a micro-spatial scale by covering 2666 countiesFootnote1 (Dong et al., Citation2022) in mainland China. We develop a population cartogram to plot the spatial distribution of built-up areas, where the area is proportional to the population and the colour demonstrates the amount of built-up areas in each county. As demonstrates, the spatial distribution of built-up areas, as expected, is significantly uneven: the coastal megacities and provincial capitals have the largest number of built-up areas, while the central regions and north-eastern region also consume a great amount of construction land. These findings indicate that built-up areas are used not only for accommodating property development but also for industry and previous homelands for migrants, largely from villages. Furthermore, we observe that the linear fitting indictor of population and built-up areas rose from 0.439 to 0.493 from 2010 to 2020, indicating the relationship between the two was enhanced by the rural urbanization.
Figure 1. Cartogram of the built-up area of the population of Chinese counties and the linear fitting graph between the built-up area and the population in 2010 and 2020.
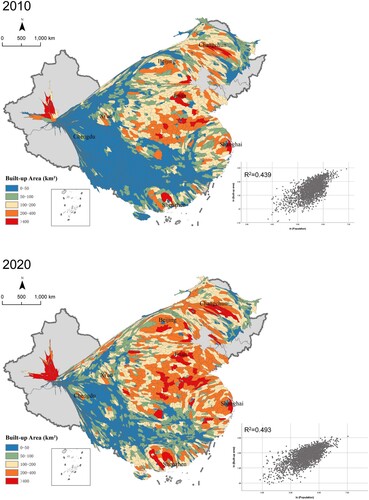
Comparing the spatial concentration of built-up areas from 2010 to 2020 using the Gini coefficientFootnote2 reveals a decrease in spatial concentration from 0.575 to 0.504, while the coefficient for population increased from 0.409 to 0.443. This suggests an aligned expansion of built-up areas in counties beyond traditional nodes of growth, such as mega-cities and provincial capitals; however, the distribution of population has concentrated more in mega-cities and provincial capitals. This finding raises notable questions around the sustainability of land use in China and the potential challenges of concentrating populations on dispersing land exploitation. Correcting this misallocation should be an urgent task for the Chinese government in planning for future urbanization.
DISCLOSURE STATEMENT
No potential conflict of interest was reported by the authors.
Additional information
Funding
Notes
1 Due to availability data, this study excludes the data from Hong Kong, Macau and Taiwan. As the county-level data of Xinjiang province is still unavailable, we only use the prefectural-level data of Xinjiang in the maps.
2 The Gini coefficient is one of the most commonly used methods to measure inequality among values of a frequency distribution. In our analysis, the Gini coefficients calculated as:
where
is the population of city i.
REFERENCE
- Dong, L., Du, R., & Liu, Y. (2022). Mapping evolving population geography in China. arXiv, preprint, https://doi.org/10.48550/arXiv.2203.02130.