
ABSTRACT
Between 2019 and 2021, the Autonomous Region of Sardinia and the Eni Enrico Mattei Foundation (FEEM) developed and applied a sustainability assessment model of the investments within the regional operational programmes (ROPs), with specific reference to the United Nations’ 2030 Agenda and its 17 Sustainable Development Goals (SDGs). That same methodology is used here for the assessment of the sustainability of the ROPs co-financed by the European Union with specific reference to Italy’s National Sustainable Development Strategy (NSDS). In particular, the analysis is done by looking at the contribution of the 182 intervention fields to the NSDS’ strategic goals. Throughout the paper the importance of defining implementation strategies of the NSDS’ National strategic goals through the integration of the indicators, goals and choices of the national strategy into local or regional development plans is emphasized. Finally, the work suggests this methodology as a reference point to ensure careful monitoring of the sustainability of the investments of various European Union policies, in consideration of the importance that the strategy assumes for both Italy and the Italian regions.
1. INTRODUCTION
The Autonomous Region of Sardinia is a large Italian island located in the Mediterranean Sea. As demonstrated by the European Commission’s (EC) regional competitiveness index (European Commission, Citation2019a), Sardinia, due to its isolated and peripheral position, is subject, like most island regions of the Mediterranean, to various constraints that have hampered its full economic development and which results in poor competitiveness and therefore higher costs for both businesses and citizens. In fact, Sardinia reported lower values in terms of business sophistication, infrastructural innovation and higher education levels compared with the national average (European Commission, Citation2019a). In addition, the particular environmental vulnerability of the territory makes the sustainable management of resources one of the biggest challenges that it faces.
Between 2019 and 2021, the Autonomous Region of Sardinia and the Eni Enrico Mattei Foundation (FEEM) developed an assessment model to evaluate the sustainability of local investments with reference to the United Nations’ 17 Sustainable Development Goals (SDGs) of the 2030 Agenda. In particular, the model investigated the contribution of Sardinia’s regional operational programmes (ROPs) – co-financed by the European Union’s (EU) Cohesion Policy’s structural and investment (ESI) funds – to the tackling of the SDGs. This was done first by looking at the existing interconnections between the 169 SDGs targets and the intervention fields proposed by the EC for the monitoring of the 2021–27 programming period of the ESI funds, and then through the creation of matrices to analyse the type, orientation and magnitude of the intervention fields’ contribution to the SDG targets (Cavalli et al., Citation2020, Citation2021b, Citation2022).
However, as already supported by Cavalli (Citation2018), it is crucial to take a local approach to sustainability – in other words, to assess the sustainability of local public spending it is necessary to consider not only global agendas for sustainable development (i.e., the 2030 Agenda) but also more local ones (i.e., national sustainable development strategies). For this reason, the research group composed of FEEM researchers and local administrators of the Sardinia Region has decided to enhance the methodology proposed by Cavalli et al. (Citation2020) and to apply it to Italy’s National Sustainable Development Strategy (NSDS). In this way, the sustainability assessment of local investments would no longer be carried out against an international (and somewhat unrepresentative) set of goals, but in terms of those objectives that the country set for itself and its regions.
The remainder of the paper is structured as follows. The next section deals with sustainability assessment models considering both a global perspective (through the 2030 Agenda) and a more local view (through Italy’s NSDS), with particular reference to regional public investments co-financed by the European structural investment funds. The third section describes the model, its structure and the foundations on which it was developed, as well as the main results emerging from it. In the final section the pilot applications of the model to the European Regional Development Fund (ERDF) ROP 2014–20 and to the European Social Fund (ESF) ROP 2014–20 of the Autonomous Region of Sardinia are reported, and the implications of the findings are critically discussed.
2. SUSTAINABILITY ASSESSMENT: FROM THE 2030 AGENDA TO THE NATIONAL SUSTAINABLE DEVELOPMENT STRATEGY (NSDS)
The 2030 Global Agenda for Sustainable Development, elaborated by the United Nations and signed in 2015 by 193 member states, identifies 17 SDGs and 169 targets that concern all the dimensions of human life and the planet, from health and well-being to quality education, from decent work and economic growth to the fight against climate change (United Nations, Citation2015).
At the European Union level, the goals of the structural funds for the 2021–27 programming period have been inspired by the 2030 Agenda, as also demonstrated by the approval of the Green Deal, the EU’s roadmap towards sustainability. However, despite this commitment to sustainability, the EC does not report on or monitor how the EU budget and policies contribute to sustainable development and to the achievement of the SDGs (European Court of Auditors, Citation2019). Consequently, the EC is investigating the viability of establishing a framework to track EU budget spending on SDGs (European Commission, Citation2020).
2.1. Existing approaches for sustainability assessment
In this context, models and tools for sustainability assessment are critical. Aly et al. (Citation2022) conducted a literature review on the modelling practices related to SDGs, considering 101 publications between 2015 and 2021. They discovered several techniques that are consistently used to address SDG-related issues,Footnote1 and that these are mainly focused on either SDGs’ interconnections assessments – that is, the existing synergies and trade-offs between different goals (for specific reviews on methods considering this topic, see Bennich et al., Citation2020; and Horvath et al., Citation2022) – or on policy transformations needed to achieve the SDGs.
However, the research suggests that the majority of the publications analysed only a single SDG and that only a few considered the topic of the sustainability of investments (e.g., Mason-D’Croz et al., Citation2019; McCollum et al., Citation2018).
In particular, there is the SDG policy mapping tool that shows how EU policies address SDGs by mapping policy documents with the goals and targets through specific keywords using text-mining and natural language-processing techniques (European Commission, Citation2022b). In addition, the EC maps the models that it uses for each SDG to assist policymakers in determining the most appropriate ones for evaluating specific policy options (European Commission, Citation2022a). More precisely, it shows which targets the models address and whether they can track progress through indicators towards the achievement of the SDGs. Nevertheless, none of these tools evaluates the contribution of the investments contained in the ROPs within the Cohesion Policy to the 2030 Agenda SDGs. When used in conjunction with an SDG indicators framework, a supplemental financial tracking tool as the one presented by Cavalli et al. (Citation2020, Citation2021b, Citation2022) can determine ex ante how much of total expenditure will go towards achieving SDG targets and allow for ex post monitoring of the highest impact per unit of finance in a world of restricted resources (Pipa et al., Citation2021).
The uniqueness of such a tool resides in its capacity to check if present funding streams contribute to the 2030 Agenda in terms of funds spent as well as potential impact both at national and local levels. This data are especially useful for policymakers as it allows them to direct or reallocate public spending towards programmes that have a greater impact on the SDGs.
2.2. From global targets to local priorities
Given its global nature, the implementation of the 2030 Agenda requires a comprehensive analysis of the local dynamics and the identification of local sustainable development paths, considering not only the environmental, social and economics interrelations, but also the local communities’ identities.
Italy has its own NSDS, which identifies a structured set of national strategic choices and goals based on five areas, also referred to as the 5Ps of sustainable development: peace, people, planet, prosperity and partnership. In addition, a system of sustainability vectors defines the areas of transversal actions and fundamental leverages to start, guide, manage and monitor the integration of sustainability in policies, in national projects and plans.
Italy’s NSDS is currently undergoing a review process, partly as a necessary response to address the new challenges raised by the post-pandemic context, and partly in reference to the definition of a strengthened framework for the assessment of public policies and investments based on sustainability. This path aims to reinforce the reference framework of the strategy, with the idea of achieving coherence with other national policies.
At the same time, the NSDS provides the reference framework for the definition of the regional sustainable development strategies which, in accordance with Art. 34 c. 4 of the Legislative Decree 152/2006 (Environmental Code), must indicate, ‘together with the Region’s contribution to national goals, the equipment, the priorities, and the actions that they intend to undertake’. Therefore, since 2018, the Sardinia Region is committed to designing its regional sustainable development strategy, as a local specification of the NSDS and with reference to the 2030 Agenda, ensuring the necessary unity of the regional planning, integrating the key points of the regional development programme, and being in connection with the process of drawing up of the funds of the Cohesion Policy.
The importance of considering the cohesion funds, in particular the European Regional Development Fund (ERDF) and the European Social Fund (ESF), as instrumental for the pursuit of environmental, social and economic sustainability, has also been confirmed by Cavalli et al. (Citation2020), who have proven how approximately 70% of the operations financed by these funds in Sardinia contribute directly or indirectly to the achievement, at the regional level, of the overall goals of the 2030 Agenda. The connection between the strategic elaboration and the programming of community funds has made it possible to give substance to the reasoning and to deepen the identification of tools and policies necessary for a more sustainable and monitorable transition. Since the regions have the mandate to implement the NSDS, the integrated use of the cohesion funds is certainly an important tool for its implementation which makes the application of the model to Italy’s NSDS a useful and concrete contribution.
3. MAIN FEATURES OF THE COHESION POLICY, 2021–27
Before going into the details of the model developed on the NSDS, it is worthwhile to outline the main features of the Cohesion Policy for the programming period 2021–27, as described in the recently approved regulations (EU) (European Parliament and European Council, Citation2021a, Citation2021b, Citation2021c, Citation2021d, Citation2021e), which constitutes the foundation for the setting of the proposed model.
Cohesion Policy is the regional European policy aimed at strengthening the economic, social and territorial cohesion in all regions and cities of the EU and it seeks to correct the development gaps between countries and regions thereof. It supports sustainable competitiveness, research and innovation, the digital transition, the goals of the European Green Deal, and the promotion of the European pillar of social rights and stands as ‘one of the most transversal and cross-cutting policies, which contributes to most, if not all 17 SDGs’ (European Commission, Citation2019b). With changes in the regulatory framework, the EU prioritized support to national health systems, and the valorization of cultural and touristic potential, as these sectors have been the most affected by the crisis sparked by the COVID-19 pandemic, as well as measures to support workers and to fight youth unemployment and child poverty. The new legislation introduces more flexibility by establishing a mechanism to deal with future crises so that the member states and regions can mobilize EU resources more quickly in response to unforeseen challenges. The Cohesion Policy 2021–27 allocates its resources to pursue five strategic goals: (1) a more competitive and smarter Europe; (2) a greener, low–carbon transitioning towards a net zero carbon economy and resilient Europe; (3) a more connected Europe; (4) a more social and inclusive Europe; and (5) a Europe closer to its citizens.
The ERDF and the European Social Fund Plus (ESF+) – the two funds considered in this study – can count on a total of €226 billion and €99.3 billion (at current prices), respectively. Most of the investments of the ERDF are focused on the first two objectives, ‘a more competitive and smarter Europe’ and ‘a greener, low carbon transitioning towards a net zero carbon economy and resilient Europe’, while those of the ESF+ are entirely centred on the fourth strategic goal, ‘a more social and inclusive Europe’.
These five strategic objectives are then set out for the ERDF and the ESF+ in further specific goals, 23 for the ERDF and 13 for the ESF+, which are to be achieved through investments in 182 intervention fields. Among these, each member state and region will accurately choose the ones that best match local priorities, connecting strategic choices to specific goals, starting from the country-specific recommendations and from the challenges identified within the framework of the integrated national energy and climate plans, considering the European pillar of social rights and the (recent) national recovery and resilience programmes: everything should be pursued promoting sustainable development, taking into account the 2030 Agenda, the Paris Agreement and the ‘do no significant harm’ principle.
4. MAIN FEATURES OF THE NSDS
The National Sustainable Development Strategy (NSDS), presented to the Council of Ministers on 2 October 2017 and approved by the Inter-ministerial Committee for Economic Planning (CIPE) on 22 December 2017, is the document that ‘design[s] a vision of the future and development focused on sustainability, as a shared and essential value to address the global challenges of our country’ (Ministry of the Environment and Land and Sea Protection, Citation2017). The main objective of the NSDS is to specify the principles and goals of the 2030 Agenda at the national level. This has required intense technical work that has been carried out thanks to a participatory path that has involved all the actors who take an active part in sustainable development: central and local administrations, civil society, the academic and research world. In particular, the strategy has been shaped by three principal elements:
The assessment of the Italian ‘positioning’ with reference to the 17 goals and the 169 targets of 2030 Agenda (Ministry of the Environment and Land and Sea Protection (MATTM), Citation2017).
The identification of the strengths and weaknesses on which to build the goals to be pursued specifically for Italy, starting with the placement analysis.
The organization of the national strategic goals around the 5Ps of sustainable development.
In summary, through the analysis of a selection of national indicators produced by the Italian National Statistical Institute (ISTAT), it has been possible to identify the ‘Italian positioning with reference to the 17 SDGs’ that, in turn, has made it possible to recognize the main opportunities and challenges and, subsequently, the identification of 52 national strategic goals.Footnote2 Specifically, as mentioned above, the structure of the NSDS identifies five areas, the 5Ps, that capture the various dimension of sustainable development: people, planet, prosperity, peace and partnership. Each area consists of a system of strategic choices (ordered by roman numerals) specified in national strategic goals (ordered by Arab numerals), specific for Italy.
5. THE IMPACT ASSESSMENT MODEL
From an operational point of view, the methodology first proposed by Cavalli et al. (Citation2020) is applied here to assess the impacts of Cohesion Policy on the NSDS.
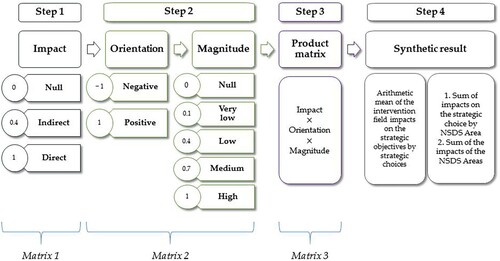
Therefore, the impact of each intervention field of Cohesion Policy on every strategic objective of the NSDS has to be assessed systematically. To do this, an expert evaluation approach is conducted in collaboration with the FEEM research group and the team of local administrators of the Sardinia Region. Several steps are involved: first, the creation of a matrix that is populated according to whether each intervention field (on the horizontal axis) impacts the strategic objectives of the NSDS (on the vertical axis). The impact can be classified as none, indirect or direct and can be either positive or negative according to whether the investment contribute or impede the achievement of the strategic objective. For example, investments in solar energy would contribute directly to the Strategic Objective IV.1 of the Prosperity Area ‘Increase energy efficiency and renewable energy production by avoiding or reducing impacts on cultural heritage and the landscape’, whereas research and development (R&D) investments would only give an indirect contribution.
A second matrix is then constructed taking into account the magnitude of those impacts; the magnitude can be null, very low, low, medium or high, according to the characteristics the investments have in that specific context. For example, interventions in the protection of natural sites are considered to contribute with a high magnitude to the Strategic Objective II.1 of the Planet Area ‘Maintain the vitality of the seas and prevent impacts on the marine and coastal environment’ due to the insular nature of the Sardinia Region. The impact and magnitude matrices are then multiplied together to create a final weighted matrix to capture every dimension of the impact.
Finally, three useful types of synthetic measures are computed: the first is the average impact of a specific intervention field on a specific strategic choice of NSDS; the second is the sum of strategic choices’ impacts and represents the overall impact of a specific intervention field on a specific area of the NSDS; and the third is the sum of areas’ impacts and represents instead the overall impact of a specific intervention field on the NSDS. summarizes all the steps of the model-building process.
Figure 1. Model-building process.
5.1. Key findings
In this section the first results of the conceptual model developed on the NSDS are presented and discussed. The results refer to a matrix built vertically by the strategic choices of the NSDS, and horizontally by the 182 intervention fields of Cohesion Policy as approved by Regulation (EU) 2021/2060 on 24 June 2021.
In the contribution of the intervention fields (on the horizontal axis) to the different strategic choices of the NSDS (on the vertical axis) is represented in a heatmap. A first vertical analysis addresses the intervention fields aimed, to a greater or a lesser extent, to the achievement of the strategic choices. Subsequently, a horizontal analysis looks at the strategic choices that are more or less impacted by the Cohesion Policy.
Figure 2. Heatmap of the final coefficients.
Note: In the heatmap of final impacts, yellow areas correspond to stronger impacts, dark blue areas correspond to negative ones.
Source: Authors’ elaboration.
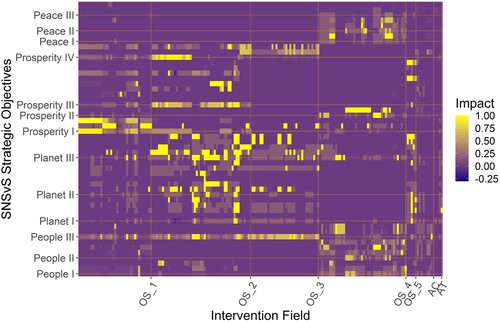
It can be seen that particular intervention fields – grouped in the relative strategic goals (OS in the graph) – contribute to particular strategic choices of the NSDS. For example, the intervention fields belonging to OS 2, ‘a greener, low carbon transitioning towards a net zero carbon economy and resilient Europe’, are the most impacting ones on average, with the largest contribution coming from investments in green and blue infrastructures, nature and biodiversity protection, and other measures to reduce greenhouse gas emissions to the planet area of the NSDS. On the other hand, intervention fields related to technical assistance (AT in the graph) are the least impacting ones, as these are aimed at strengthening the public administration, the communication strategy of the ROP ERDF and ROP ESF, and cross-border cooperation, which are not addressed by the NSDS.
At the same time, it can be seen that some strategic choices of the NSDS are horizontally more (or less) impacted by the various intervention fields: the more impacted ones are Choice III, ‘Create resilient communities and territories, protect landscapes and cultural heritage’, of the planet area, then Choice I, ‘Fund and promote sustainable research and innovation’, of the prosperity area, followed by Choice III, ‘Promote health and wellbeing’, of the people area and Choice IV, ‘Decarbonize the economy’, of the prosperity area. On the other hand, the least impacted ones are Choice III, ‘Ensure legality and justice’, followed by Choice I, ‘Promote a non-violent and inclusive society’, and Choice II, ‘End discrimination in all its forms’, of the peace area, as these are all issues that are not directly included in specific fields/goals of Cohesion Policy (for complete data, see the supplemental data online).Footnote3
In short, the analysis of these coefficients allows us to reach an important conclusion: the EU’s Cohesion Policy does not allow one to contribute to the achievement of all the strategic goals of the NSDS. This is expected given the nature and the institutional purposes that the Cohesion Policy pursues, which are related only to a subset of the extensive scope of the NSDS.
6. PILOT APPLICATIONS OF THE COHESION POLICY AND NSDS MODEL TO BOTH THE ROP SARDINIA ERDF 2014–20 AND ROP SARDINIA ESF 2014–20
As already mentioned, the proposed model has been applied to both the ROP Sardinia ERDF 2014–20 and ROP Sardinia ESF 2014–20. For the application, the official data, updated on 31 December 2019 and 31 December 2020 (as reported in the related annual implementation report), from the monitoring and control information system in use at the managing authorities of the programme have been considered.
6.1. Assessment of the contribution of the ROP Sardinia ERDF 2014–20 to the strategic choices of the NSDS with 2019 and 2020 data
Through its ROP ERDF 2014–20, approved in 2015, the Sardinia Region intended to address major challenges towards sustainable development, investing around €930 million in the following eight priority axes: (1) scientific research, technological development, and innovation, (2) digital agenda, (3) competitiveness of the production system, (4) sustainable energy and quality of life, (5) protection of the environment and risk prevention, (6) effective use of resources, valorization of natural, cultural, and touristic attractors, (7) promotion of social inclusion, fight against poverty and any form of discrimination, and (8) technical assistance.
After the first three years of implementation, at the end of December 2019 more than 90% of the available resources of the ROP had already been mobilized for interventions distributed throughout the region, which have ensured the achievement of the targets set (ARS, Citation2020). Throughout 2020, the implementation of the programme was inevitably conditioned by the outbreak of the pandemic. Under the new regulatory regime – launched by the EU to enable a prompt response to the health emergencyFootnote4 – throughout 2020 the managing authority was able to progressively reorientate the investments to support actions against the crisis, redirecting the resources towards the most affected sectors.
Through the financial remodelling of the budget assigned to the ROP’s axes and in compliance with the regulatory constraints of 4% of the total budget of the ROP, a total of €34.9 million of electronic and digital health intervention as well as the purchase of medical devices and facilities in hospitals have been made eligible for the ROP. Furthermore, an emergency fund dedicated to the liquidity of businesses (Fondo Emergenza Imprese) was established. Such investments have made it possible to mobilize resources for over €100 million, entirely attributable to axes III and IV of the ROP. The mobilization and reorientation of considerable resources of the programme towards measures to combat the health and social crisis are to be seen in the context of a wider process of reorientation of the original strategies of the programme. Therefore, only at the end of this reprogramming process will it be possible to carry out a more accurate assessment of the effects of these changes.
However, the application of the model to the data updated on 31 December 2020 and the comparison with the information contained in the annual implementation reports allows some important trends to be highlighted. It should first be noted that as of 31 December, 2456 operations were selected and resources worth more than €1 billion were mobilized. Compared with the initial financial allocation of €930 million, highlights a programming overbooking, which is largely to be attributed to the reorientation of resources of the programme towards measures to combat the health and economic crisis sparked by the COVID-19 pandemic (Autonomous Region of Sardinia, 2021). In order to assess the expected effects of the implementation of these operations on the areas of the NSDS, it is appropriate to refer to the total eligible cost of the selected operations, in order to capture their effect over time in relation to their progressive advancement level. The application of the model to 2019 and 2020 data provides an overview that is summarized in the following figures.
Table 1. Financial information at priority axis and programme level of the ROP ERDF 2014–20.
immediately highlights the impact of the reorientation of resources made during 2020 (summarised in the annual implementation report of 2020) on the implementation and overall strategy of the programme, namely:
Axis II ‘Digital Agenda’ has accelerated due to information and communication technology (ICT) initiatives undertaken in healthcare as a response to the COVID-19 pandemic.
Axis III ‘Competitiveness of the production system’ shows the impacts generated by the creation of the Businesses’ Emergency Fund, which is intended to grant loans to enterprises, in accordance with the conditions laid down by the ‘Temporary framework for State aid measures to support the economy in the current Covid-19 emergency’ (temporary framework), in order to address the social and economic crisis caused by the pandemic.Footnote5
Axis VII ‘Promotion of Social Inclusion, Fight against Poverty and any form Discrimination’ is reoriented to finance health expenditures such as the purchase of personal protective equipment (PPE) and health equipment and the upgrading works of health companies and hospitals, which is equal to 95% of the current availability of resources. As of 31 December 2020, the axis recorded a value of the eligible cost equal to almost €106 ds to 174% of the allocated budget.
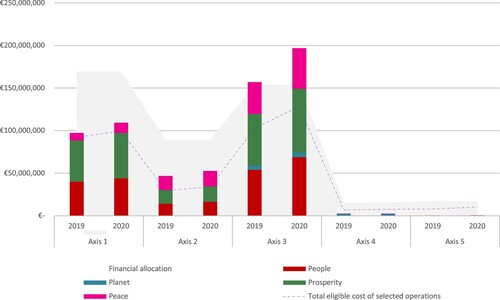
Figure 3. Contribution of the priority axes of the ROP Sardinia ERDF 2014–20 to the NSDS at 31 December 2019 and 31 December 2020.
Source: Authors’ elaboration on ARS’ data.
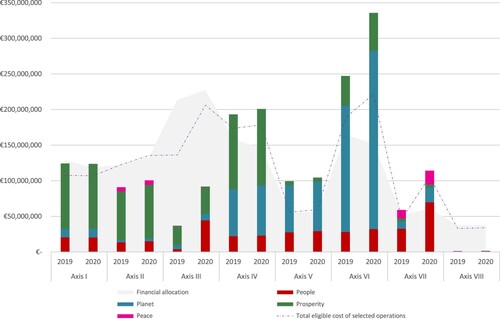
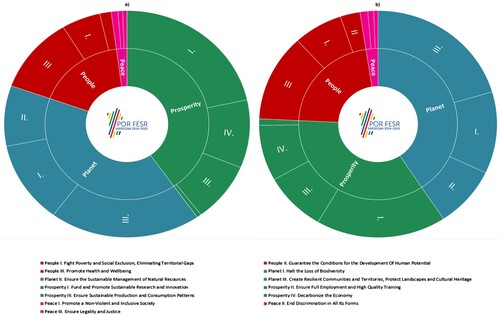
By looking at the entire programme, in both 2019 and 2020 the ROP ERDF constantly shows its propensity to support the prosperity and planet fields, with a constant trend, as is evident in . In particular, the programme is more directed towards the strategic Choice I, ‘Fund and promote sustainable research and innovation’, of the prosperity area and Choice III, ‘Create communities and resilient territories, preserve landscapes and cultural heritage’, of the planet area. This result is partly consistent with the results of the application of the model to the SDGs in Cavalli et al. (Citation2020) where the most relevant goals were Goal 9: Industry, innovation, and infrastructure, Goal 7: Affordable and clean energy, and Goal 13: Climate action.
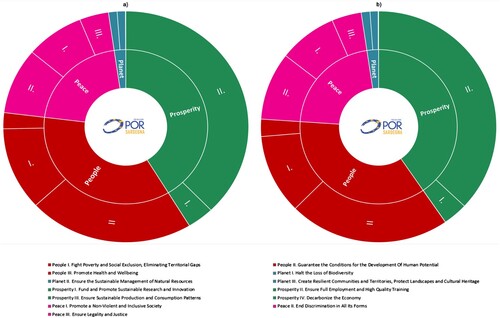
Figure 4. Contribution of the ROP Sardinia ERDF 2014–20 to the NSDS.
Source: Authors’ elaboration on ARS’ data.
6.2. Assessment of the contribution of the regional operational programme ESF Sardinia 2014–20 to the strategic choices of the NSDS with 2019 and 2020 data
The ROP ESF Sardinia 2014–20, with its budget of over €440 million, is firmly anchored in the European Strategy 2020, which aims at a smart (investment in education, research and innovation), sustainable (interventions in favour of a low CO2 economy and industry competitiveness), and inclusive (job creation and poverty reduction) growth.
In particular, the ROP ESF Sardinia 2014–20 invested in the following five main areas of interest, which coincide with the relevant priority axes: (1) employment, (2) social inclusion and the fight against poverty, (3) education and training, (4) institutional and administrative capacity, and (5) technical assistance.
As of 31 December 2020, the advancement of the programme saw a cumulative eligible cost equal to €279.4 million (approximately 63% of the budget), with a particularly important contribution in the areas of education and training. In fact, it is precisely Axis 3, which addresses these areas, that records the best performance: the incidence of eligible cost records a share slightly over 83% of the overall budget of the axis (). For 2020, the implementation of the ROP Sardinia ESF was strongly conditioned by the pandemic, which pushed the Sardinia Region to initiate a reprogramming process of the interventions in order to counter the effects of the health crisis on the territory. This implied a financial reorientation of over €86 million, resulting from the introduction of actions and specific goals closely related to the COVID-19 emergency, which particularly affected support for employment. However, given the timing of implementation of these interventions, their effects in terms of the trend of expenditure have not yet been fully captured. Therefore, only after the full deployment of these effects and the outcome of the further necessary adjustment processes of the programme, as is the case for the ROP ERDF, a more complete analysis of the contribution of the ROP ESF to the NSDS will be possible.
Table 2. Financial information at priority axis and programme level of the ROP ESF 2014–20.
However, by limiting the analysis to the currently available data and to the trend of expenditure during 2019 and 2020, it is possible to make preliminary assessments of the contribution of the ROP ESF to the NSDS and, where possible, drawing preliminary insights on the basis of the recorded budget deviation between 2019 and 2020.
The trend in reflects the results of the 2019 and 2020 annual implementation reports, in which Axis 3 continues to ensure the best spending performance and, more specifically, the highest amount of eligible costs. As mentioned above, the effects of the pandemic are not yet fully captured, although there is a notable increase in Axis 1 (employment), which has mobilized the largest amount of resources in support of the pandemic crisis, and a significant one in Axis 3 (education and training). In both 2019 and 2020 the ESF consistently shows its propensity to support the prosperity and people areas.
Figure 5. Contribution of the priority axes of the ROP Sardinia ESF 2014–20 to the NSDS at 31 December 2019 and 31 December 2020.
Source: Authors’ elaboration on ARS’ data.
Therefore, despite the effects of the pandemic not yet being fully captured by the model, the latter nevertheless reports outcomes consistent with the vocation of the fund, which represents the main instrument of the EU in support of people, and which contributes to increasing prosperity.
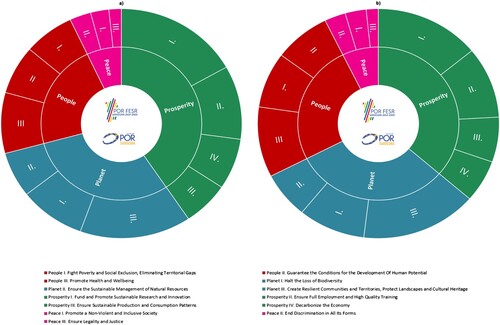
A comparative analysis of confirms the observations made so far. In fact, a substantial unchanged balance in the hierarchy of priorities is highlighted: the ESF strongly contributes to prosperity and people areas, makes a significant contribution to the peace area, while the contribution to the planet area is residual.
Figure 6. Contribution of the ROP Sardinia ESF 2014–20 to the NSDS.
Source: Authors’ elaboration on ARS’ data.
6.3. Combined assessment
The joint application of the model to the ESF and ERDF data, in order to assess the overall contribution of the two programmes to the NSDS, is driven by the investment priorities of the ERDF, which is characterized by a financial allocation that prevails over the ESF.
If both the ESF and the ERDF make a significant contribution to prosperity, the ERDF makes an even greater contribution to planet, followed by people, which is the second priority for the ESF. Therefore, the contribution of the two funds will primarily be oriented towards prosperity, followed by a further significant contribution towards planet, by a relevant contribution towards people and, finally, by a more limited contribution towards peace. In the transition from 2019 to 2020, as shown by a joint analysis of , the balances and hierarchies of the contribution remain substantially unchanged.
Figure 7. Relative contribution of the ROPs Sardinia ERDF and ESF 2014–20 to the NSDS.
Source: Authors’ elaboration on ARS’ data.
The results of the application of the model, and, in particular, the contribution of the ESF and ERDF Sardinia ROPs 2014–20, appear consistent with the results of Cavalli et al. (Citation2020). In that case, the main contribution of the programmes was directed towards Goal 9 of the 2030 Agenda, dedicated to industry, innovation, and infrastructure. In the model under discussion, the main contribution is directed towards prosperity and, in particular, towards Choice I, ‘Fund and promote sustainable research and innovation’. Overall, the joint application of the model returns a mitigated and rebalanced picture, which captures the specific vocations of the two funds and a harmonious contribution of the Sardinia Region to the NSDS.
7. CONCLUSIONS
We have illustrated the main results of our analysis regarding the impact of European Cohesion Policy on the NSDS. The methodology proposed, consistent with the methodology developed with reference to the 2030 Agenda (Cavalli et al., Citation2020), consisted of the construction of a synthetic sustainability index (in terms of strategic choices of the NSDS) of the ROPs of the Autonomous Region of Sardinia. This entailed the attribution of specific scores (using coefficients relating to the type, orientation and magnitude of the impact) to the support provided by investments of the ROPs to the strategic choices of the NSDS. Of course, the attribution of scores serves as an approximation of the actual impact as it is not based on econometric estimations but rather on the team’s qualitative assessment. Nevertheless, potential biases are mitigated by having different expertise within the team that carried out the attribution and we believe that such an approach is the only one that allows such a detailed analysis.
The study confirms that the EU’s Cohesion Policy, by its very nature and the institutional purposes it pursues, does not allow, on its own, the achievement of all the strategic choices of the NSDS. At the same time, a comprehensive overview of the contribution of Sardinia’s policies to the national strategy would require the application of the model to the whole set of plans and programmes supported by the regional budget, aimed at calculating a synthetic sustainable index of the entire regional investment policy. Nevertheless, our analysis allowed us to infer that the contribution of the two ROPs to the NSDS is consistent with their respective objectives: on the one hand, the ERDF ROP invests more in the planet and prosperity areas, and, on the other, the ERF ROP mainly contributes to the two areas of prosperity and people. Despite this, it is worth mentioning that, for example, the Strategic Choice IV, ‘Decarbonisation of the economy’, of the prosperity area is the fourth least impacted one, whereas in Cavalli et al. (Citation2020) Goal 7 of the 2030 Agenda (‘Affordable and clean energy’) was the third most impacted one. This surely depends on the fact that the strategic objectives of this specific choice are much more specific in their scope as they focus on specific sectors (e.g., mobility, agriculture, small industries, etc.), whereas Goal 7 has a more general scope which was reflected in a more transversal impact effect in our previous study.
According to the authors, the methodology proposed, although designed and tailored for the Sardinia Region, is potentially already suitable to be used in other contexts. For example, the same methodology has been used to assess the impact that the investment measures identified by the Italian National Resilience and Recovery Plan (NRPP) could have on the SDGs (Cavalli et al., Citation2021a). The application in that context was relatively straightforward as investments under both the EU Structural Funds and the Next Generation EU are classified through the same taxonomy (i.e., intervention fields). Hereby, the analysis showed that the Italian NRRP mostly impacts SDGs 9, 13 and 7, exhibiting consistency with its purposes of economic growth, digital transition as well as decarbonization and energy transition. The fact that the same methodology can be used to study analytically both the EU Structural Funds and the Next Generation EU shows that it can indeed be a useful tool, especially in the programming and management phases, to identify policy areas in which it is necessary to intervene with a more significant contribution towards sustainability objectives.
In fact, its greatest merit is to allow policymakers to track and align spending to support sustainability objectives by providing a solid baseline that can guide public authorities during future budget processes and allocations.
Supplemental Material
Download MS Word (95.8 KB)DISCLOSURE STATEMENT
No potential conflict of interest was reported by the authors.
Notes
1 Modelling techniques identified in the study include system dynamics, agent-based modelling, Bayesian networks, econometric models, economic models, integrated models, knowledge-based models, network models and mathematical quantitative models.
2 The NSDS also identifies a system of sustainability vectors, defined as ‘cross-sectoral field of action and fundamental leverages for starting, guiding, managing, and monitoring the integration of sustainability into national policies, plans, and projects’.
3 However, the goal of fighting discrimination is at the basis of Cohesion Policy, and there are specific rules to prevent any discriminations based on sex, race or ethnicity, religion or personal beliefs, disability, age or sexual orientation.
4 Reference is made to the legislative packages known as Coronavirus Response Investment Initiative.
5 The first announcement was published in September 2020 with a budget of €60 million, the applications submitted were over 3000 of which 767 were declared eligible, for a number of requests about five times higher than the capping of the instrument.
REFERENCES
- Aly, E., Elsawah, S., & Ryan, M. J. (March 2022). A review and catalogue to the use of models in enabling the achievement of sustainable development goals (SDG). Journal of Cleaner Production, 340, 130803. https://doi.org/10.1016/j.jclepro.2022.130803
- Autonomous Region of Sardinia (ARS). (2020). Strategia Regionale per lo Sviluppo Sostenibile. Adozione documento preliminare. Resolution N. 64/46 18.12.2020 https://delibere.regione.sardegna.it/protected/53852/0/def/ref/DBR53564/.
- Bennich, T., Weitz, N., & Carlsen, H. (2020). Deciphering the scientific literature on SDG interactions: A review and Reading guide. Science of The Total Environment, 728, 138405. https://doi.org/10.1016/j.scitotenv.2020.138405
- Cavalli, L. (2018). Agenda 2030 – da globale a locale. FEEM Report, Fondazione Eni Enrico Mattei (FEEM), Milan https://www.feem.it/m/publications_pages/2018-cavalli-agenda2030.pdf.
- Cavalli, L., Alibegovic, M., Cruickshank, E., Farnia, L., Romani, I. G., & Sanna, S. (2021a). Il contributo degli investimenti del PNRR all’Agenda 2030 alla luce della valutazione della Commissione europea. Fondazione Eni Enrico Mattei (FEEM) Brief N. 2021.03, Milan.
- Cavalli, L., Sanna, S., Alibegovic, M., Arras, F., Boe, S., Cocco, G., Cruickshank, E., Farnia, L., Manca, E., Mulas, L. F., Onnis, M., Ortu, S., Romani, I. G., & Testa, M. (2022). Localizing the 2030 agenda at the regional level through the European Cohesion Policy: An application to the region of Sardinia. Environmental Sciences Proceedings, 2022(15), 51. https://doi.org/10.3390/environsciproc2022015051
- Cavalli, L., Sanna, S., Alibegovic, M., Arras, F., Cocco, G., Farnia, L., Manca, E., Mulas, L. F., Onnis, M., Ortu, S., Romani, I. G., & Testa, M. (2020). The contribution of the European Cohesion Policy to the 2030 agenda: An application to the autonomous region of Sardinia. FEEM Working Paper, Fondazione Eni Enrico Mattei (FEEM), Milan. https://www.feem.it/en/publications/feem-working-papers-note-di-lavoro-series/the-contribution-of-the-european-cohesion-policy-to-the-2030-agenda-an-application-to-the-autonomous-region-of-sardinia/.
- Cavalli, L., Sanna, S., Alibegovic, M., Arras, F., Cocco, G., Farnia, L., Manca, E., Mulas, L. F., Onnis, M., Ortu, S., Romani, I. G., & Testa, M. (2021b). Sustainable development goals and the European Cohesion Policy: An application to the autonomous region of Sardinia. Journal of Urban Ecology, 7(1), juab038. https://doi.org/10.1093/jue/juab038
- European Commission. (2019a). The EU Regional Competitiveness Index 2019. https://ec.europa.eu/regional_policy/sources/docgener/work/2019_03_rci2019.pdf.
- European Commission. (2019b). Reflection Paper Towards a Sustainable Europe By 2030 (COM(2019) 22 final). https://ec.europa.eu/info/publications/reflection-paper-towards-sustainable-europe-2030_it.
- European Commission. (2020). Delivering on the UN’s Sustainable Development Goals – A Comprehensive Approach – Staff Working Document. SWD(2020) 400 final; European Commission: Brussels, Belgium, 2020.
- European Commission. (2022a). Models for SDGs. https://knowsdgs.jrc.ec.europa.eu/intro-models. Accessed on 19 May 2022.
- European Commission. (2022b). SDG policy mapping. https://knowsdgs.jrc.ec.europa.eu/intro-policy-mapping. Accessed on 19 May 2022.
- European Court of Auditors. (2019). Rapid case review. In Reporting on sustainability: A stocktake of EU institutions and agencies. European Court of Auditors.
- European Parliament, Council of the European Union. (2021a). Regulation (EU) 2021/1056 of the European Parliament and of the Council of 24 June 2021 establishing the Just Transition Fund. https://eur-lex.europa.eu/legal-content/IT/TXT/PDF/?uri=OJ:L:2021:231:FULL&from=IT.
- European Parliament, Council of the European Union. (2021b). Regulation (EU) 2021/1057 of the European Parliament and of the Council of 24 June 2021 establishing the European Social Fund Plus (ESF+) and repealing Regulation (EU) No 1296/2013. https://eur-lex.europa.eu/legal-content/IT/TXT/PDF/?uri=OJ:L:2021:231:FULL&from=IT.
- European Parliament, Council of the European Union. (2021c). Regulation (EU) 2021/1058 of the European Parliament and of the Council of 24 June 2021 on the European Regional Development Fund and on the Cohesion Fund. https://eur-lex.europa.eu/legal-content/IT/TXT/PDF/?uri=OJ:L:2021:231:FULL&from=IT.
- European Parliament, Council of the European Union. (2021d). Regulation (EU) 2021/1059 of the European Parliament and of the Council of 24 June 2021 on specific provisions for the European territorial cooperation goal (Interreg) supported by the European Regional Development Fund and external financing instruments. https://eur-lex.europa.eu/legal-content/IT/TXT/PDF/?uri=OJ:L:2021:231:FULL&from=IT.
- European Parliament, Council of the European Union. (2021e). Regulation (EU) 2021/1060 of the European Parliament and of the Council of 24 June 2021 laying down common provisions on the European Regional Development Fund, the European Social Fund Plus, the Cohesion Fund, the Just Transition Fund and the European Maritime, Fisheries and Aquaculture Fund and financial rules for those and for the Asylum, Migration and Integration Fund, the Internal Security Fund and the Instrument for Financial Support for Border Management and Visa Policy. https://eur-lex.europa.eu/legal-content/IT/TXT/PDF/?uri=OJ:L:2021:231:FULL&from=IT.
- Horvath, S., Muhr, M. M., Kirchner, M., Toth, W., Germann, V., Hundscheid, L., Vacik, H., Scherz, M., Kreiner, H., Fehr, F., Borgwardt, F., Gühnemann, A., Becsi, B., Schneeberger, A., & Gratzer, G. (2022). Handling a complex agenda: A review and assessment of methods to analyse SDG entity interactions. Environmental Science & Policy, 131, 160–176. https://doi.org/10.1016/j.envsci.2022.01.021
- Mason-D’Croz, D., Sulser, T. B., Wiebe, K., Rosegrant, M. W., Lowder, S. K., Nin-Pratt, A., Willenbockel, D., Robinson, S., Zhu, T., Cenacchi, N., Dunston, S., & Robertson, R. D. (2019). Agricultural investments and hunger in Africa modeling potential contributions to SDG2 – Zero hunger. World Development, 116, 38–53. https://doi.org/10.1016/j.worlddev.2018.12.006
- McCollum, D. L., Zhou, W., Bertram, C., De Boer, H. S., Bosetti, V., Busch, S., … Riahi, K. (2018). Energy investment needs for fulfilling the Paris agreement and achieving the sustainable development goals. Nature Energy, 3(7), 589–599. https://doi.org/10.1038/s41560-018-0179-z
- Ministry of the Environment and Land and Sea Protection (MATTM). (2017 October). Strategia Nazionale per lo Sviluppo Sostenibile. https://www.mite.gov.it/sites/default/files/archivio_immagini/Galletti/Comunicati/snsvs_ottobre2017.pdf.
- Pipa, T., Alibegovic, M., Arras, F., Cavalli, L., Cocco, G., Cruickshank, E., Dooley, M., Farnia, L., Kharas, H., Manca, E., Mulas, L. F., Onnis, M., Ortu, S., Romani, I. G., Sanna, S., & Testa, M. (2021 September). Aligning COVID-19 recovery efforts with the SDGs – Toolbox and principles. Task force 5: 2030 agenda and development cooperation, Think20 (T20) Policy Brief. https://www.t20italy.org/wp-content/uploads/2021/09/TF5_PB03_LM02.pdf.
- United Nations. (2015). Transforming our world: The 2030 agenda for sustainable development. A/RES/70/1. https://www.un.org/ga/search/view_doc.asp?symbol=A/RES/70/1&Lang=E.