
 ?Mathematical formulae have been encoded as MathML and are displayed in this HTML version using MathJax in order to improve their display. Uncheck the box to turn MathJax off. This feature requires Javascript. Click on a formula to zoom.
ABSTRACT
European Territorial Cooperation programmes (also known as Interreg) are designed to promote integration by encouraging organizations in multiple regions to work together on projects to address shared challenges. While some key aspects of these programmes have been studied (territorial scope, thematic areas, types of initiatives), research into participant organizations and their logic within partnerships (groups of organizations working together on projects) and the reasons for their participation in multiple projects, individually or in clusters, has been less thorough. This article presents a quantitative analysis of programmes under Interreg B and C, investigating the variables that influence organizations’ involvement in partnerships and the logic behind repeated collaborations. The aim is to supplement existing research, complementing it and supporting providing a better understanding of this framework to programme planners, enabling them to make more informed decisions when aiming to maximize the impact of their programmes when considering partners and partnerships.
1. INTRODUCTION
European Union (EU) cross-border cooperation has been fostered since the inception of the European integration process. European Territorial Cooperation (ETC) programmes (also known as InterregFootnote1) have been a major contributor to promoting interregional collaboration, alongside other instruments such as the European Grouping for Territorial Cooperation (EGTC) (Caesar, Citation2017; Klatt & Herrmann, Citation2011).
Trans-state European cooperation increased significantly in the 1990s, as an essential element of the EU’s regional policy. Nonetheless, the first Interreg programme was introduced for the period 1989–93, and the specific objectives of each programming period have changed over time (Medeiros, Citation2018; Reitel et al., Citation2018). However, the main goal, as defined by Heredero and Olmedillas (Citation2009), has always been increasing the exchange of information between institutions from different regions and member states, promoting the development of institutional networks to support long-term collaborations. The 1994–99 operational programme was used to undertake multi-regional initiatives, under specific territorial programmes and projects, to reduce administrative barriers between them (Baños & Iglesias, Citation1995). The period 2000–06 was intended to reinforce the role of the EU regions in policy design and to promote cohesion among them (Plaza, Citation2002). The period 2007–13 reinforced this role, while encouraging further joint initiatives connected to policy design and implementation, which continued in the period 2014–20, which this work focuses on.
Organizations collaborating together is fundamental in this context. The composition and creation of networks play a large role in the success and impact of projects. Authors have analysed the role of networks in leading discussion forums, which facilitates the creation of new ideas, opportunities and projects, increasing the knowledge transmission and the positive externalities it generates (Davis & Greve, Citation1997), particularly when there are common goals and shared standards (Holcomb & Hitt, Citation2007; Hult et al., Citation2007). However, the literature mainly focuses on private firms; for instance, Gulati (Citation1998) discussed the key factors in firms’ alliances; Dyer and Singh (Citation1998) incorporated relational capacity as a relevant factor in firms’ competitive advantage; and Koka and Prescott (Citation2002) and Krause et al. (Citation2007) outlined how networking influences firms’ social capital. Additionally, Galaskiewicz and Wasserman (Citation1989) highlighted how important networks are for public or private non-profit organizations. These points can be extrapolated to the ETC context. Several factors motivate organizations to join Interreg initiatives, which, along with their institutional characteristics, can lead to major differences between partnerships (groupings of organizations jointly designing and implementing projects) and, consequently, the impact of their collaboration.
Interreg programmes/projects have been analysed from both geographical and thematic perspectives. For example, Esparza-Masana (Citation2020) analysed the case of Spain, Nilsson et al. (Citation2010) studied them in the Baltic Sea Region, Prokkola (Citation2011) examined the Finish–Swedish border, Medeiros (Citation2014, Citation2017) looked at Scandinavia, and Martín-Uceda and Castañer (Citation2018) and Feliu et al. (Citation2018) analysed the cross-border areas of Spain/Portugal and Spain/France. Van den Broek et al. (Citation2020) studied the implications for small and medium-sized enterprises (SMEs). However, the role of the partnerships composition in such initiatives has not been deeply explored, especially in a quantitative way, even though it is one of the two core components of Interreg (the other being the topics covered by programmes and projects). Given that a major goal of the ETC is to maximize cross-border networks and collaborations, it is essential to understand the logic behind partnerships and their sustainability over time.
When discussing partnerships, several dimensions need to be considered, such as the type of participating organizations (e.g., public administrations, research and development (R&D) providers, or firms), the funding obtained, or the intensity of collaboration in specific territories. An often less noticed but equally relevant variable is repetition. It can be analysed from two perspectives: repeating partners (i.e., organizations that participate in two or more projects) and repeated partnerships (RPs) (i.e., groups of partners who jointly participate in more than one project). Whether or not these repetitions are desirable depends on the goals of each programme. Joint Secretariats of Interreg programmes have thus emphasized the importance of engaging in different partnership compositions when creating a new project (unless, of course, the repetition is well-justified). Hence, a quantitative analysis of the logic behind these repetitions is appropriate.
The present work seeks to contribute to the analysis of this framework, placing partners and partnerships at the forefront, and introducing a quantitative analysis that can supplement more qualitative or descriptive approaches already present in the literature. Thus, the main objective of this article is to integrate a quantitative approach to the logic of partnership-building in Interreg programmes, which provides an additional contribution to the analyses conducted by other authors on specific territories or programmes. Such existing and future research, in combination with the present contribution, may lead to broader research conclusions, with potential policy implications.
To undertake the present analysis, we used the keep.eu repository (complemented with other sources) as our main raw data. We constructed a database including all interregional and transnational Interreg projects and their partners for the period 2014–20. In section 2, we examine the logic of repetition within the ETC framework. Later, we discuss the scope of our study and its structure. We then present and analyse the results of our analysis; first for repeating partners (organizations participating in more than one Interreg project) and then for RPs (a number of organizations jointly participating in several projects). We conclude our work with a discussion on the main findings and their implications.
2. ETC B AND C FRAMEWORK AND THE LOGIC OF REPETITION
Current ETC/Interreg programmes aim at promoting European cohesion and integration by enabling the collaboration of organizations in various EU regions that wish to work together in order to address a shared challenge or project concept (Dühr et al., Citation2007). Policy transfer is essential in contexts of economic integration and globalization (Stone, Citation1999), and Interreg projects are crafted according to key concepts such as the exchange of experiences and good practices benchmarking (Vettoretto, Citation2009), where participant organizations learn from each other and apply the gained knowledge to their own contexts, adapting it from its origin to its destination context, (sometimes) building joint innovative initiatives (Cooke et al., Citation2000).
ETC projects are co-financed by the European Regional Development Fund (ERDF), with an average rate of 75–85% of the project budget. These programmes align to the same thematic objectives (TOs) as those defined under ERDF, covering investment priorities from economic competitiveness to more social ones, including climate change and environment. The most addressed TOs in ETC are those related to innovation, SMEs’ competitiveness, environment and sustainability, and energy efficiency. Projects are implemented by partnerships (coordinated by a lead partner) in a specific territorial area. Interreg A programmes cover cross-border territorial areas, while Interreg B programmes cover transnational macro-regions, such as the Mediterranean area (including regions that have the Mediterranean Sea as one of their borders – or are close to it). Interreg C programmes cover the entire EU. In addition, certain programmes can involve third countries from outside the EU, such as Norway and Switzerland, or from the Instrument of Pre-Accession Assistance (IPA) (Albania, Bosnia and Herzegovina, Kosovo, Montenegro, North Macedonia, Serbia, and Turkey).
Interreg A projects tend to be more specific in addressing cross-border challenges within a much smaller geographical area (with fewer potential organizations to participate in them) compared with Interregs B and C, which are more related to broader macro-regional or EU-wide challenges. Given the complexity of comparing across the different programmes, analysing all the Interregs A–C would present a large complexity, especially given the particular features of each Interreg A programme (since each cross-border territory may be affected by vastly different challenges, which are considered in each specific programme). Therefore, this work only studies Interregs B and one under C, which include much larger territories and address, in general, more horizontal domains. Future research could be developed to analyse Interreg A (especially at an individual basis, and then comparing across them).
lists the included programmes (B and C). The geographical area for each can be visualized at the European Commission’s official site.Footnote2 We have only included Interreg Europe for type C, since the other three programmes (European Observation Network for Territorial Development and Cohesion (ESPON), INTERACT and URBACT) are specialized programmes that differ significantly in their structure and objectives from other programmes, which would bias our analysis. For B programmes, we have excluded three programmes (Indian Ocean Area, Caribbean Area and Amazonia) which have specific rules for overseas territories that drastically alter the scope of projects. The analysed programmes cover an aggregated budget of over €3.1 billion. lists these programmes, as well as their budget for the period 2014–20 and the aggregated population of the regions that can participate in each of them. Non-EU territories have been excluded from the analysis since they may be subject to different dynamics that cannot be controlled.
Table 1. General indicators from Interreg programmes included in the analysis, 2014–20.
Projects are designed and implemented under the umbrella of the different Interreg programmes, each managed by a joint secretariat, composed of technical and financial staff responsible for executing the programme, including the management of the various calls for proposals. In each of these calls, a group of organizations (partnership) presents project ideas which they aim at implementing, led by a lead partner who acts as the main responsible and coordinator of the project. A monitoring committee composed of experts/representatives from each member state in the programme’s geographical area decides which projects should receive funding and, once granted, these projects are executed (typically for two to three years).
One common aspect in all programmes is the fact that partnerships can use past joint experience to enhance their current and future joint endeavours, since they have become accustomed to each other and therefore can establish better coordination and collaboration mechanisms (Holloway & Parmigiani, Citation2016). The ongoing success of this collaboration is dependent on the roles taken on by partners (Heide & Wathne, Citation2006), and the level of coordination between them (Frohlich & Westbrook, Citation2001). It is also argued that coordination is improved when sustained cooperation leads to joint routines or procedures (Gil & Marion, Citation2013; Nelson & Winter, Citation1982; Zollo et al., Citation2002), as well as increased and better communication among organizations and long-term shared learning (Tunisi & Zanfei, Citation1998). Since a significant goal of Interreg projects is to address shared challenges in a coordinated manner, it is clear that having prior experience (individual and/or collective) in how to collaborate with other organizations in tackling these common challenges is relevant, as limited understanding of the potential partners in other territories may restrict cooperation possibilities (Leick, Citation2012). In this framework, we build our analysis.
3. SCOPE OF THE ANALYSIS
Several authors agree that in Interreg projects, collaboration structures among partners are essential and, unless relationships among them are fluent, project results are likely to be suboptimal. Therefore, it is important for partners to get to know each other and create relationships based on effective communication (Wink, Citation2010). Different authors have studied the importance of partnerships in various geographical areas; for instance, Pedrazzini (Citation2005) analysed Southern Europe, Neubauer et al. (Citation2007) studied Scandinavia, and Medeiros (Citation2010) did so for Portugal/Spain and Norway/Sweden.
As introduced in the previous section, when a call for proposals is open, organizations interact to build a partnership, and this partnership presents a project proposal which, would it be granted funding, is implemented. An organization can only participate in calls from programmes that cover its geographical areas. There are no formal constraints regarding the number of projects in which an organization can participate; however, there are some rules when building partnerships, some that are mandatory and included as requirements in the programmes, and some that are tacit, that is, not announced but de facto implicit. lists the main implicit and explicit rules. As shown, official ones require some general objective conditions, while tacit constraints relate to those that must be considered by project designers when building the partnership. These tacit constraints list comes from interviews with officers of different programmes in the scope of previous academic projects.
Table 2. Main official and tacit constraints when building partnerships.a
A special mention must be made regarding lead partners, which are the organizations that serve as the project coordinator. A lead partner is expected to have sound experience to exert this role and may be subject to additional requirements specified by each programme (e.g., being a public entity or having previously participated as a standard partner). Even if an organization meets these requirements, it may not be willing to take on the role of lead partner due to, for instance, the additional workload that this role entails, which may not always be adequately compensated with a larger share of the budget.
Organizations build partnerships and opt for funding under the projects they design, taking into consideration the constraints outlined in . They also consider some other implicit variables, such as familiarity with the organizations they are targeting to work with, the organizations’ experience, relevance to the project, and other subjective implications. On the other hand, individual organizations evaluate the proposal to determine whether it is aligned with their scope of activities, whether they feel comfortable in the partnership, whether the potential budget is attractive enough for the tasks they will have to undertake, and other both objective and subjective factors.
Organizations’ decisions to form partnerships are regulated by the aforementioned rules and, as noted, having multiple institutions work together on a number of projects comes with both pros and cons. On the plus side, as Casper (Citation2007) noted when analysing the private industry scope, firm partnerships can be established from existing contacts, which makes collaboration and knowledge transfer smoother, although borders can create gaps in the process (Glückler, Citation2007). In this scenario, policies could reduce cooperation barriers, leading to more integrated cross-border initiatives (Tödtling & Trippl, Citation2005). Moreover, as discussed in the preceding section, project outputs/results can be maximized if there is effective collaboration within the partnership.
Entities that continuously collaborate often face certain weaknesses. For example, not all partners may strive to achieve the best joint results, but may become opportunistic or free-riders once they become familiar with their counterparts’ behaviour, working methodology and values (Anderson & Jap, Citation2005; Wuyts & Geyskens, Citation2005). Additionally, these repeating partnerships can exclude external partners that could significantly improve the results, due to the costs of finding better performing organizations, the familiarity of working with current partners, or the fear of generating hostile behaviour within the current project when excluding certain partners in future collaborations (Ernst & Bamford, Citation2005; Uzzi, Citation1997).
Taking these factors into account and within the limitations of the programmes’ regulations, organizations decide whether to potentially participate in more than one project and whether to do so with other institutions that might be repeating. Thus, these variables lead some partners to end up participating in multiple projects – and some participating only once – as well as some partnerships (groups of organizations) that have participated in a single project to end up participating in more than one (as an entire partnership or a number of partners within it), or not. The aim of this article is to analyse and understand the logic behind these criteria from a quantitative perspective, supplementing the works that analyse and discuss more qualitative and/or descriptive domains. To this end, all informed projects in the selected programmes are taken into account in the analysis (i.e., the study includes all projects that have been informed in the database that has been used).
As previously mentioned, the database was initially extracted from the aggregated dataset of Interreg Programmes, keep.eu (funded by the INTERACT Programme), and cross-checked with datasets from the Interreg B and C programmes. There were some minor differences between the datasets, which were corrected using individual data from each programme as the reference. For the Baltic Sea Programme, data from keep.eu was considerably limited and data was obtained and processed directly from the Programme’s own datasets. The microdata were then treated to remove all duplicates and identify and fix any errors, such as wrong specified NUTS or repeated organizations with different names. Approximately 4% of the data required manual modifications. The organizations were then reviewed on an individual basis to assign the repeating institutions to their own code, as they often declare their names differently when participating in several projects (for instance, they can participate as University of Ljubljana or Faculty of Business – U. Ljubljana). This process resulted in a homogenous database of 6421 organizations (5874 from EU), with individual information on all the projects in which they have participated (from any programme). The maximum number of projects participated in is 29, belonging to the University of Ljubljana.
Before discussing the analysis framework, it is important to clarify the terminology that will be used. By partner, the article refers to each individual organization that participate in one or more programmes (depending on its geographical location) and one or more projects within the same or different programmes. A participation refers to each time one organization participates in one project. That is, if an organization joins three different partnerships (three projects), that will be counted as three participations for that organization. Each project has as many participations as the number of partners that make up its partnership.
When analysing the results, we will refer only to EU-based organizations (EU-28, including Britain, a full member country during the analysed period). As some programmes allow third country institutions to participate, they do so with different funds and, often, under different rules, which could bias the study; therefore, when studying any variable, we will refer exclusively to organizations within the EU, which make up the majority of partners. Moreover, only full partner organizations have been included (i.e., excluding any type of participation mechanism such as advisory or associated partners, which do not receive funding from the programme).
The analysis will consider (1) all programmes at once or (2) programme by programme. When addressing domains that are common in all programmes, the results will be presented in an aggregated way; however, differences regarding some aspects between programmes require that some of them are examined individually.
4. REPEATING PARTNERS
Of the 5874 partners included in our data set, 2009 (34.2%) are repeating partners, meaning they participate in more than one project. This suggests that they find value in joining Interreg projects. These partners represent over one-third of the participant institutions in the programmes. However, if we consider the total number of participations, of the 11,847 analysed, 7982 (67.4%) belong to repeating partners. This means that while only about one in three organizations participate in more than one project, those doing so account for over two-thirds of the total number of participations.
To assess the intensity of repeating partners in each region, a repetition index was built, as expressed in (1), which weights the average number of participations per partner by its potential participations. We aggregated NUTS-3 data into bigger regions, NUTS-2, since regional policy in the EU normally considers NUTS-2 as the analysis dimension. In the equation measuring the index of the intensity in repetition (IR), i represents NUTS-2 regions, and j refers to NUTS-3 (where Ji is the total number of NUTS-3 in a given NUTS-2). By average number of participations per partner we refer to this figure in a specific NUTS-3 within the NUTS-2 where it belongs (since some programmes only accept the participation of organizations in specific NUTS-3, instead of NUTS-2). Finally, potential projects refers to the maximum number of projects a given partner could participate in (which depends on the NUTS-3 where it is geographically located); the ratio is multiplied by 100 to facilitate the reading of the results, within the interval of 0–2. The index allows one to make the weight of each case relative to the actual possibilities of participation they have, so we can compare them in relative terms, for the absolute value limits the potential for comparison:
(1)
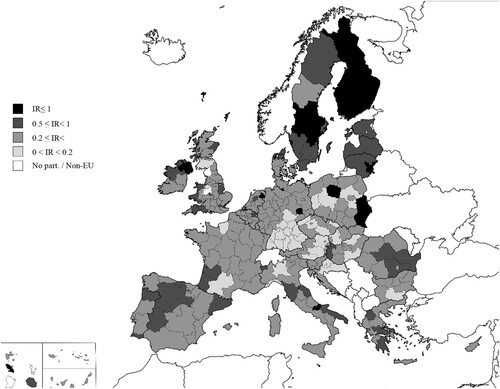
(1) presents an overview of the repetition intensity in NUTS-2 regions (where for each NUTS-2, we calculate the average of the NUTS-3 within – if any), measured by the aforementioned index. As shown, there is no specific pattern, except for the case of Finland and – to a lesser extent – Sweden, which show a larger intensity than the average; the Baltic States also present an intensity above the average. Conversely, many NUTS-2 in Central Europe have lower intensity rates. also serves to demonstrate that almost (99%) all EU regions are represented, which links to the objective of ensuring that ETC projects include partners from all possible territories, favouring geographical distribution, therefore meeting one of the goals of the programmes.
Figure 1. Value of the intensity of repetition (IR) index (as described in function 1) by EU-28 NUTS-2 regions.
Note: Descriptive statistics: mean(IR) = 0.414, median(IR) = 0.371, std(IR) = 0.190, min(IR) = 0.1418 and max(IR) = 1.667.
Source: Authors’ own elaboration.
presents treated data on relevant variables for each considered programme. Directly related to their budget (), there is the number of projects and the correlated number of organizations that take part in each, as well as their aggregated number of participations. Considering the presented relative values, it is possible to observe that there are significant differences in some cases; for instance, partners tend to participate in more than two projects on average in the Northern Periphery and Arctic programme, whereas this figure drops to 1.26 for the North-West programme. The composition of partnerships also varies greatly, from programmes such as the Alpine Space, which have an average of almost 12 partners per project, to others such as South-West, where the average number of partners is below five. In terms of the ratio of public to private organizations, this does not vary significantly across most programmes, with the exception of North-West, which has more than 50% of its partners made up of private entities. Additionally, there are considerable differences in the average budget per partner, ranging from less than €150,000 (in the Balkan–Mediterranean and Northern Periphery and Arctic programmes) to over €600,000 in the North-West. While part of these differences can be attributed to the disparities in wages and other costs, this does not always explain the phenomenon (e.g., the Northern Periphery and Arctic region consists of regions with, on average, a high GDP per capita). To determine whether these differences stem from a rationale, it would be necessary to analyse the workload per partner in each programme, but this information is not available.
Table 3. Projects and partner organizations per programme.
In this framework, specific variables are now considered. In a comparison of public versus private partner organizations, of 5187 analysed entities (all programmes except Baltic Sea) 3516 (67.8%) are public and 1671 (32.2%) are private. However, when studying participations, public entities have a larger share. The average amount of projects each public organization participates in is 2.4, while private ones participate in an average of 1.3 projects. This means that 42.8% of the public partners are involved in more than one project, compared with 17.7% of private ones. This translates to 8478 (79.6%) of participations belonging to public entities, and 2169 (20.4%) belonging to private ones. It is important to acknowledge that programmes tend to favour public organizations over private ones (e.g., by only allowing private–non-profit ones to join and granting them a lower share of co-financing).
shows the percentage of repeating partners per programme, as well as the percentage of lead partners of that programme’s projects which repeat, that is, organizations participating in more than one project. When all programmes are taken into account, 78.5% of projects are led by repeating partners. Looking at it from another perspective, non-repeating partners only lead 7.6% of the single projects they are part of, whereas repeating partners lead 13.4% of the projects in which they participate. This aligns with the logic behind the role of lead partners; they are usually expected to have prior experience, and to have a larger network of organizations that can become part of the partnership.
Table 4. Percentage of repeating partners and leadership by repeating partners by programme, 2014–20.
There is a slight positive correlation coefficient (= 0.04) between the number of participations and the percentage of leadership taken by repeating partners. shows the number of projects these repeating partners are leading for each of their participations from 1 to 13 (where 1 is the first chronological participation and 13 is the 13th). For example, the first numerical column indicates that for the first project a repeating partner participates in, they are the lead partner in 13.8% of the cases (284 out of 2065). Generally, as the number of participations increases, the presence of the partner as a lead partner also increases. In fact, for those partners who have reached their thirteenth project, they are leading half of the projects in which they are involved. This could be seen as a result of learning and experience, where these organizations become better equipped and more confident in their ability to lead when they participate in more projects.
Table 5. Percentage of projects led by repeating partners in chronological order (from the first they participate in to the 13tha).
Still on leadership, when comparing the roles of public and private organizations leading projects, it can be seen that 82.2% of projects are led by public institutions (taking into account the constraints described in section 2). Regarding their participation, public organizations lead 12.2% of the projects in which they take part, while private entities only lead 5.7%. This indicates that public entities have a much larger role in leadership over private organizations. This is in line with the logic of most Interreg programmes, which usually involve a public entity taking the lead role.
4.1. Territorial approach
After this introductory analysis, the study of specific variables regarding the logic of partners’ (reiterated) participations is now presented. We observe that territories with lower populations tend to be overrepresented in terms of their participation in the study. This suggests that population size may be a key factor in understanding the logic of partners’ repeated participations. compares the correlation coefficients between the population of NUTS-3 territories (since not all NUTS-3 in a NUTS-2 can participate in a given programme, the analysis must be undertaken on NUTS-3) and the number of participations per capita, as well as the correlation coefficient between the population and the number of partners per capita, for each programme. As shown, except for one programme, the correlation is negative, that is, NUTS-3 with fewer inhabitants have, on average, more partners and participations per capita. There are two main plausible explanations for this: there is less competition among organizations in areas with fewer inhabitants (which can be used as a proxy for the number of institutions in that territory); and the fact that ETC programmes usually favour geographical distribution, aiming at encouraging participation from as many regions as possible, leading to partnerships that include organizations from smaller NUTS-3 almost as much as from larger ones, confirming the geographical tacit constraints outlined in .
Table 6. Correlation coefficients of NUTS-3 territories population versus participations per capita and partners per capita.
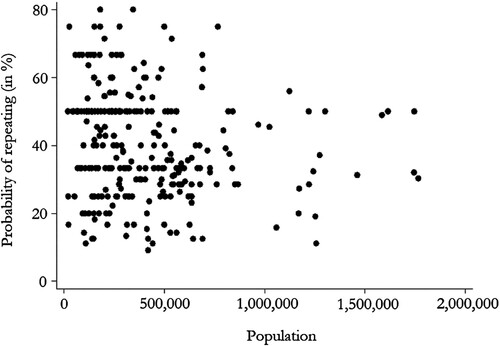
Geographical aspects have an impact on the rate of repetition. illustrates the relationship between the population of NUTS-3 territories (10 NUTS-3 regions with more than 2 million inhabitants were not included for improved visualization, but were taken into account in the analysis) and the probability of any partner in that territory being a repeating one, which is measured as the ratio of repeating partners to the total number of partners in each NUTS-3. Although the relationship in is not very clear, there is a gentle downward trend (correlation coefficient = −0.154). This suggests that there is a lower chance of having repeating organizations in territories with larger populations (and, consequently, more organizations). This again underlines the importance of geographical distribution, as organizations in more densely populated areas are surrounded by a greater number of other entities (potential candidates for participation), leading to an increased indirect competition to join projects.
Figure 2. Relationship between the NUTS-3 population and probability of repeating partners.
Source: Authors’ own elaboration.
4.2. Economic and budgetary aspects
The next examination is to assess the relationship between participations and partners per capita in relation to the GDP per capita of the NUTS-3 territories where they are based. shows that the correlation coefficients for both the participations and the partners present much weaker relationships than those in the population analysis. This suggests that partners tend to be represented evenly in richer and poorer regions. This confirms the existence of a tacit constraint (), showing that Interreg follows the logic of the Cohesion Policy by ensuring participation is proportionately spread across territories with different levels of economic development. The Adriatic–Ionian, South-West and Mediterranean programmes have larger negative correlations (organizations in richer NUTS-3 regions participate less) while the Balkan–Mediterranean programme has a larger positive correlation (an opposite relationship). A probability analysis was also undertaken, similar to that done for the population (); however, the results were not significant and are not depicted. In general, and aligned to the described participation tacit constraints, the analysis of the GDP per capita across regions with different economic development levels confirms a homogeneous distribution.
Table 7. Correlation coefficients of NUTS-3 territories’ gross domestic product (GDP) per capita versus participations per capita and partners per capita.
The analysis considers now budgetary implications, aiming at assessing whether it (i.e., the money that organizations receive to implement the projects in which they participate) has implications when considering participating in more than one project. When an organization takes part in a project, it receives a budget to be spent on project activities; of course, the more budget, the more likely it is that the organization will be interested in participating, which could lead to more involvement, as well as more possibilities to learn or to develop project-related activities within the organization. We can expect that many partners would welcome a larger budget (assuming a similar workload); we can also assume that those partners that participate in multiple projects (or at least more than one) gain experience from the previous ones and, as a result, may obtain a larger share of the partnership budget, particularly if they expand their role thanks to the acquired expertise.
The first part of this study explores whether repeating partners tend to obtain, on average, larger shares of the budget in the projects in which they participate. For this analysis, the Baltic Sea Programme was excluded, as we could not access microdata on the budget. Lead partners were also excluded because that they usually receive a larger budget to cover the extra costs associated with leading the project, which would distort the analysis. To analyse this, the budget received by partners compared with the average for each project was compared. When contrasting both types of organizations (those repeating and those not repeating), the conclusion is that, on average, repeating partners have a budget that is 3.6% above the project average, while non-repeating partners have, on average, −1.7% compared with the project average. These differences are statistically significant, leading us to ponder whether repeating partners gain knowledge from participating in multiple projects, thus resulting in a larger relative budget.
The following analysis looks at the evolution of the consecutive budgets of repeating partners. Specifically, we want to see if participating in more projects leads to a relative larger share of the budget of the consecutive projects over time. The correlation between the average growth of this share and the number of participations presents a weak positive value of 0.042, indicating that organizations joining more projects do not benefit in this regard.
An interesting aspect linked to the budget is the difference between this amount and the GDP per capita, which is used as a proxy for the incurred costs. For instance, if two partners, one from Finland and one from Bulgaria, receive the same budget, the Bulgarian organization would be able to implement more tasks or ‘save more money’ due to the large differences in costs, such as salaries for their employees. Therefore, different methods have been used to determine whether partners that receive more budget relative to their costs tend to participate more. However, all contrasts led to weak results, implying that there is no correlation between ‘gaining from the budget’ and the number of participations.
5. REPEATED PARTNERSHIPS
In the previous section, the analysis focused on factors that could explain why individual organizations would decide to participate in multiple projects, that is, become repeating partners. However, organizations do not participate in projects autonomously – they require a partnership. This leads to pools of organizations that, for various reasons, decide to work together in multiple projects and become RPs. presents figures on the total number of RPs in the analysed programmes for the period 2014–20; columns show the number of partners within the partnership, and rows indicate the number of times that those partnerships have repeated their collaboration under different projects; in parentheses, the number of RPs that have participated in projects from at least two different programmes is provided, while the rest have just repeated within the same programme.
Table 8. Number of all repeated partnerships (and those repeating in more than one programme).
As shown, more than 54% of them are type 2 × 2, that is, two partners together in two projects. This relates to the fact that, on average, RPs are formed by 2.5 partners jointly participating in 2.3 projects. A total of 365 (25.9%) RPs participate in more than one programme, that is, a vast majority of them takes place within the same programme (RPs participate, on average, in 1.3 programmes). Additionally, 79.8% of the partners in the RPs are public, which is similar to the figure for all partnerships.
If we look at any given RP, considering the partners within it, on average, 78% of them are already involved in another RP, which suggests that most partners participating in RPs join more than one RP. From an individual partner perspective, of 5874 analysed partners, 1231 participate in RPs. Each joins, on average, 2.6 RPs; however, only 558 of them participate in more than one of these, which shows that these set strongly enlarge the average figure, evidencing a large degree of concentration in a number of organizations.
presents a different analysis unit. In previous sections, the comparison was between those partners that participate in more than one project and those that do not. Now, we will cross these two groups with another classification. Considering the partners that do repeat (non-repeating ones cannot be part of an RP), a differentiation is included between those doing so in RPs (referred to as RP partners) and those that do not (non-RP partners). The analysis includes the 2009 repeating partners, except when discussing public versus private, where the Baltic Sea programme (no data available) is excluded and only the rest (1801 observations) is included.
Table 9. Profile of repeating partners within and outside repeated partnerships.
5.1. Thematic objectives (TOs)
When discussing individual partners, the logic of the TO cannot be applied, as they relate to projects and partnerships. Nevertheless, TOs are still relevant when it comes to ETC because project topics are at the core of the cooperation. On average, the RPs participate in 1.5 TOs, and 49.5% of the RPs participate in projects belonging to more than one TO. shows the number and share of projects devoted to each objective, the intensity of RPs in those, and how loyal they are, that is, whether or not they only jointly participate in one TO (i.e., the RP participates in more than one TO).
Table 10. Thematic objectives in repeated partnerships (RPs).
Following , it is evident that TO1 (research and innovation) and TO6 (environment and resources) are the two domains that contain the majority of the projects. However, the number of projects is not indicative of the relative intensity of RPs; TO7 (sustainable transport) is the most intensive in terms of both RPs per project and percentage of projects including RPs. On the other hand, TO3 (SME competitiveness) and TO11 (institutional capacity) are the least intensive in terms of RPs. TO5 (climate change) has a peculiar characteristic: the percentage of projects with RPs is relatively low, while the figure of RPs per project is quite high, indicating that there is a concentration of RPs in a few specific projects.
There are some deviations, however, when analysing how loyal RPs are to TOs: TO1 is the one for which RPs are the most loyal, meaning that when participating in more than one project, they tend to stick with this TO instead of switching to other ones. Once more, TO11 and TO3 are, respectively, those for which RPs tend to be less consistent; therefore, those in these TOs tend to be few and with a weak interest in working within that domain in more than one project. Nevertheless, in general terms, no TO has a fidelity rate over 40%. This suggests that a larger share of organizations is versatile when participating in Interreg programmes; however, we must take into consideration that, in numerous cases, the boundaries between TOs are not completely rigid, particularly when comparing between programmes.
5.2. Intensity of the partnership repetitions
To conclude the analysis on RPs, this study now focuses on the intensity of each programme in terms of these. Three variables are considered: the number of partners involved in each RP, the number of projects in which each RP participates, and the total number of projects in the programme (as a relative measure). To focus on the within-programme perspective, the repetitions that took place in other programmes are excluded from this analysis. For each RP, only the repetitions within a given programme are included.
To measure the intensity, we follow the index presented below, named repeated partnerships intensity index (RPII), and which follows this logic: to an RP of two partners and participating in two projects, the formula assigns the weight of 1; if the same RP participates in three projects, then it assigns a weight equal to of 2, and so on (to the highest weight of 15 for 11 partners in seven projects). Following the same logic, if the RP participates in just two projects but it clusters three partners, then the formula assigns the weight of 2; would the RP have five partners in two projects, the weight would be four. Then the index aggregates the individual weights to state the programme’s RP intensity. In the index (per programme) expressed in (2), N represents the number of RPs, i refers to the programme, j is the number of partners in the partnership, k is the number projects in which each RP participates, and Pi is the number of projects in programme i:
(2)
(2) To validate the index values, robustness checks were conducted using other formulas and weights. In each case, the programmes kept the same ordinal position in the ranking, with similar distances between them. The results, presented in and (which uses programme numbers in ), show that Alpine Space is the most intense programme in terms of RPs, and South-West Europe has the lowest intensity. illustrates the relationship between the number of projects per programme and the number of RPs, with the diameter of each circle representing the magnitude of the index. We can see a positive and close-to-1 relationship between the values in both axes, which follows the direct logic of more RPs when there are more projects. However, the magnitude of the index does not appear to be directly linked to the figures in the axes.
Figure 3. Intensity in repeated partnerships per thematic objective.
Note: Numbers refer to the numeration in .
Source: Authors’ own elaboration.
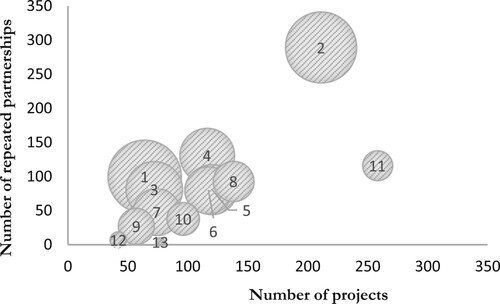
Table 11. Intensity of repeated partnerships per programme.
6. DISCUSSION
It can be expected that the success and impact of ETC projects depend – to a large extent – on the composition of the partnerships. The characteristics of the partners that make up these partnerships and their interaction is a key factor. In the preceding sections, the article has quantitatively analysed and defined in detail the dimensions of the organizations participating in various projects, whether they do so individually or in collaboration with other institutions. To undertake this analysis, raw data bases were mainly treated, cross-checked with other sources and analysed from multiple perspectives, including territorial, financial and thematic.
Regarding these dimensions, relevant findings have been made and hypotheses have been tested. In summary, it can be confirmed that, in absolute terms, there is an even geographical distribution of participation across regions, regardless of the level of economic development or demography. Thus, the less populated territories tend to have a higher degree of participation in relative terms, and organizations in these regions are more likely to join more than one project. It can also be concluded that public organizations tend to participate, repeat and lead more. Repeating entities tend to lead more projects, both in absolute and relative terms (especially for partners in RPs), and this trend is even more pronounced the more projects they join. They also receive more relative budget compared with the average of each project, which is also more intense for entities in RPs, with this extra relative budget increasing the more projects they participate in. We have found that there is a concentration when it comes to participation in research projects, with less than a quarter of organizations accounting for most of the participations in RPs. All RPs also tend to concentrate in some TOs, particularly in sustainable transport.
While the analysed variables have led to the presented conclusions, the available data has some limitations which restrict the number of features that can be studied. For instance, information on more subjective participation constraints could be relevant, analysing, for example, how bureaucratic procedures can disincentive the participation of some organizations, even though the European Commission has worked to simplify the bureaucratic procedures of ETC programmes and intends to continue doing so (Delecosse, Citation2020). Microdata on the number of employees and/or financial statements of participant organizations could also help to better understand the participation possibilities.
Even though these variables cannot be considered due to the lack of available data, the presented results cover a variety of relevant topics and provide objective information that programme planners can use to prioritize certain aspects or objectives related to partnerships. The results of the study can provide useful information for programme planners when making decisions about the composition of partnerships, as well as the logic behind repeat participations of organizations. Such decisions may involve making changes to existing rules or creating new rules, depending on the programme.
However, it is important to note that these findings should be seen as a complement to other studies and findings from other authors, particularly those that use a more qualitative approach, since Interreg is not a neutral domain, and all different approaches must be taken into account to reach sound conclusions. The results of this quantitative study add to the findings of other authors concerning various aspects of the logic of the ETC and its outcomes, providing more relevant implications for policymaking. On its own, this analysis offers some deductions about partnerships; when considered in combination with the existing literature, it can help programme planners make more informed decisions based on their goals and desired impact. This information can also be taken into account by the European Commission when designing the ETC policy as a whole.
Moreover, the conclusions reached by this and the aforementioned complementary works should be put in perspective with further work on the analysis of Interreg’s impact. This represents a significant challenge, as stated by Medeiros et al. (Citation2022), due to the lack of data to study some different aspects. For instance, Hachmann (Citation2011) discussed the impact of Interreg B in fostering policymaking coherence under the concept of ‘Europeanization’ and highlighted the challenge of achieving tangible results; or Gómez (Citation2016) discussed the impact of Interreg on fostering the use of solar energy in the Mediterranean macro-region. The authors of the ESPON (Citation2020) report also discussed the logic of impact analysis for Interreg programmes, stating the requirements for it to provide sound conclusions – following a number of statistical methods. However, they acknowledged the large existing barriers in that regard, especially due to the lack of data that allows for comprehensive studies.
In conclusion, the present work is a step forward in the analysis of Interreg programmes, considering the role of organizations and partnerships from a quantitative perspective to add value to the existing qualitative literature. While conclusions can be drawn from it, there is still a need to measure the logic of these programmes and their actual impact in a comprehensive manner. The European Commission, together with the programmes’ managing bodies and expert researchers, could invest additional efforts to devise ways to achieve these impact measurement objectives. This would enable the drawing of decisive final conclusions that demonstrate the relevance of Interreg in promoting European cohesion.
DISCLOSURE STATEMENT
No potential conflict of interest was reported by the authors.
Notes
1 Since its introduction in 1989, the name of the programmes was Interreg. While for the period 2007–13 it took the name of European Territorial Cooperation, the Commission, and the public in general, continued referring to those programmes as Interreg, which for the period 2021–27 was reintroduced as the official name. In the present article, including different periods, ETC and Interreg are used as synonyms.
REFERENCES
- Anderson, E., & Jap, S. D. (2005). The dark side of close relationships. MIT Sloan Management Review, 46(3), 75–82. https://sloanreview.mit.edu/article/the-dark-side-of-close-relationships/
- Baños, J., & Iglesias, A. (1995). La política regional europea y la cooperación transfronteriza. Estudios Regionales, 42, 181–212. http://www.revistaestudiosregionales.com/documentos/articulos/pdf465.pdf
- Caesar, B. (2017). European groupings of territorial cooperation: A means to harden spatially dispersed cooperation? Regional Studies, Regional Science, 3(1), 247–254. https://doi.org/10.1080/21681376.2017.1394216
- Casper, S. (2007). How do technology clusters emerge and become sustainable? Social network formation and inter-firm mobility within the San Diego biotechnology cluster. Research Policy, 36(4), 438–455. https://doi.org/10.1016/j.respol.2007.02.018
- Cooke, P., Boekholt, P., & Todtling, F. (2000). The governance of innovation in Europe. CengageBrain.
- Davis, G., & Greve, H. (1997). Corporate elite networks and governance changes in the 1980s. American Journal of Sociology, 103(1), 1–37. https://doi.org/10.1086/231170
- Delecosse, É. (2020). Politique de cohésion: La simplification à l’épreuve de la complexité d’Interreg. Reflets et perspectives de la vie économique, 58(1), 65–78. https://doi.org/10.3917/rpve.591.0065
- Dühr, S., Stead, D., & Zonneveld, W. (2007). The Europeanization of spatial planning through territorial cooperation. Planning Practice and Research, 22(3), 291–307. https://doi.org/10.1080/02697450701688245
- Dyer, J., & Singh, H. (1998). The relational view: Cooperative strategy and sources of interorganizational competitive advantage. Academy of Management Review, 23(4), 660–679. https://doi.org/10.2307/259056
- Ernst, D., & Bamford, J. (2005). Your alliances are too stable. Harvard Business Review, 83(6), 133–141. https://hbr.org/2005/06/your-alliances-are-too-stable
- Esparza-Masana, R. (2020). Analysis of European interregional cooperation under Interreg programmes. The Case of Spain. Journal of Regional Research, 47, 5–28. https://doi.org/10.38191/iirr-jorr.20.008.
- European Observation Network for Territorial Development and Cohesion (ESPON). (2020). Net impact of Interreg. Luxembourg (LU): ESPON EGTC. https://www.espon.eu/sites/default/files/attachments/Net%20impact%20of%20INTERREG.pdf.
- Feliu, J., Berzi, M., Martín-Uceda, J., Pastor, R., & Castañer, M. (2018). Cuatro fronteras europeas bajo la lupa: Una metodología para el análisis de los proyectos de cooperación transfronteriza (Interreg). Geographicalia, 63–64, 75–93. https://doi.org/10.5565/rev/dag.532
- Frohlich, M. T., & Westbrook, R. (2001). Arcs of integration: An international study of supply chain strategies. Journal of Operations Management, 19(2), 185–200. https://doi.org/10.1016/S0272-6963(00)00055-3
- Galaskiewicz, J., & Wasserman, S. (1989). Mimetic processes within an interorganizational field: An empirical test. Administrative Science Quarterly, 34(Sep.), 454–479. https://doi.org/10.2307/2393153
- Gil, R., & Marion, J. (2013). Self-enforcing agreements and relational contracting: Evidence from California highway procurement. Journal of Law, Economics & Organization, 29(2), 239–277. https://doi.org/10.1093/jleo/ewr026
- Glückler, J. (2007). Economic geography and the evolution of networks. Journal of Economic Geography, 7(5), 1360–1380. https://doi.org/10.1093/jeg/lbm023
- Gómez, J. (2016). Impact of European Territorial Cooperation (ETC) on the promotion and use of solar energy in the Mediterranean. Regional Studies, Regional Science, 3(1), 185–192. https://doi.org/10.1080/21681376.2016.1150198
- Gulati, R. (1998). Alliances and networks. Strategic Management Journal, SI 19(4), 293–317. https://doi.org/10.1002/(SICI)1097-0266(199804)19:4<293::AID-SMJ982>3.0.CO;2-M
- Hachmann, V. (2011). From mutual learning to joint working: Europeanization processes in the Interreg B programmes. European Planning Studies, 19(8), 1537–1555. https://doi.org/10.1080/09654313.2011.594667
- Heide, J. B., & Wathne, K. H. (2006). Friends, businesspeople, and relationship roles: A conceptual framework and a research agenda. Journal of Marketing, 70(3), 90–103. https://doi.org/10.1509/jmkg.70.3.090
- Heredero, M. I., & Olmedillas, B. (2009). Las fronteras españolas en Europa: de Interreg a la cooperación territorial europea. Investigaciones Regionales, 16, 191–215. https://investigacionesregionales.org/es/article/las-fronteras-espanolas-en-europa-de-interreg-a-la-cooperacion-territorial-europea/
- Holcomb, T. R., & Hitt, M. A. (2007). Toward a model of strategic outsourcing. Journal of Operations Management, 25(2), 464–481. https://doi.org/10.1016/j.jom.2006.05.003
- Holloway, S., & Parmigiani, A. (2016). Friends and profits don’t mix: The performance implications of repeated partnerships. Academy of Management Journal, 59(2), 460–478. https://doi.org/10.5465/amj.2013.0581
- Hult, G. T. M., Ketchen, D. J., & Arrfelt, M. (2007). Strategic supply chain management: Improving performance through a culture of competitiveness and knowledge development. Strategic Management Journal, 28(10), 1035–1052. https://doi.org/10.1002/smj.627
- Klatt, M., & Herrmann, H. (2011). Half empty or half full? Over 30 years of regional cross-border cooperation within the EU: Experiences at the Dutch–German and Danish–German border. Journal of Borderland Studies, 26(1), 1055–1066. https://doi.org/10.1080/08865655.2011.590289
- Koka, B., & Prescott, J. (2002). Strategic alliances as social capital: A multidimensional view. Strategic Management Journal, 23(9), 795–816. https://doi.org/10.1002/smj.252
- Krause, D. R., Handfield, R. B., & Tyler, B. B. (2007). The relationships between supplier development, commitment, social capital accumulation and performance improvement. Journal of Operations Management, 25(2), 528–545. https://doi.org/10.1016/j.jom.2006.05.007
- Leick, B. (2012). Business networks in cross-border regions of the enlarged EU: What do we know in the post-enlargement era? Journal of Borderlands Studies, 27(3), 299–314. https://doi.org/10.1080/08865655.2012.750952
- Martín-Uceda, J., & Castañer, M. (2018). Actores y proyectos transfronterizos en las fronteras ibéricas: Análisis comparativo de Interreg IV-A. Boletín de la Asociación de Geógrafos Españoles, 78(78), 154–179. https://doi.org/10.21138/bage.2432
- Medeiros, E. (2010). Old versus recent cross-border cooperation: Portugal–Spain and Norway–Sweden. Area, 42(4), 434–443. https://doi.org/10.1111/j.1475-4762.2010.00940.x
- Medeiros, E. (2014). Territorial cohesion trends in inner Scandinavia: The role of cross-border cooperation – Interreg A 1994–2010. Norwegian Journal of Geography, 68(5), 310–317. https://doi.org/10.1080/00291951.2014.960949
- Medeiros, E. (2017). Cross-border cooperation in inner Scandinavia: A territorial impact assessment. Environmental Impact Assessment Review, 62, 147–157. https://doi.org/10.1016/j.eiar.2016.09.003
- Medeiros, E. (2018). Should EU cross-border cooperation programmes focus mainly on reducing border obstacles? Documents d’Anàlisi Geogràfica, 64(3), 467–491. https://doi.org/10.5565/rev/dag.517
- Medeiros, E., Zaucha, J., & Ciołek, D. (2022). Measuring territorial cohesion trends in Europe: A correlation with EU Cohesion Policy. European Planning Studies, (published online).
- Nelson, R. R., & Winter, S. G. (1982). An evolutionary theory of economic change. Belknap Press of Harvard University Press.
- Neubauer, J., Dubois, A., Hanell, T., Lähteenmäki-Smith, K., Pettersson, K., Roto, J., & Steineke, J. M. (2007). Regional development in the Nordic countries. Nordregio.
- Nilsson, J. H., Eskilsson, L., & Ek, R. (2010). Creating cross-border destinations: Interreg programs and regionalisation in the Baltic Sea Area. Scandinavian Journal of Hospitality and Tourism, 10(2), 153–172. https://doi.org/10.1080/15022250903561978
- Pedrazzini, L. (2005). Applying the ESDP through Interreg IIIB: A southern perspective. European Planning Studies, 13(2), 297–317. https://doi.org/10.1080/0965431042000321848
- Plaza, J. I. (2002). Orientaciones, conceptos e incertidumbres de la política regional europea para el siglo XXI. Revista de Estudios Regionales, 64, 43–63. http://www.revistaestudiosregionales.com/documentos/articulos/pdf724.pdf
- Prokkola, E. K. (2011). Cross-border regionalization, the INTERREG III A initiative, and local cooperation at the Finnish–Swedish border. Environment and Planning A, 43(5), 1190–1208. https://doi.org/10.1068/a43433
- Reitel, B., Wassenberg, B., & Peyrony, J. (2018). The Interreg experience in bridging European territories. A 30-year summary. In E. Medeiros (Ed.), European territorial cooperation. The urban book series (pp. 7–23). Springer.
- Stone, D. (1999). Learning lessons and transferring policy across time, space and disciplines. Politics, 19(1), 51–59. https://doi.org/10.1111/1467-9256.00086
- Tödtling, F., & Trippl, M. (2005). One size fits all? Research Policy, 34(8), 1203–1219. https://doi.org/10.1016/j.respol.2005.01.018
- Tunisi, A., & Zanfei, A. (1998). Exploiting and creating knowledge through costumer–supplier relationships: Lessons from a case study. R&D Management, 28(2), 111–118. https://doi.org/10.1111/1467-9310.00087
- Uzzi, B. (1997). Social structure and competition in interfirm networks: The paradox of embeddedness. Administrative Science Quarterly, 42(1), 35–67. https://doi.org/10.2307/2393808
- Van den Broek, J., Rutten, R., & Benneworth, P. (2020). Innovation and SMEs in Interreg policy: Too early to move beyond bike lanes? Policy Studies, 41(1), 1–22. https://doi.org/10.1080/01442872.2018.1539225
- Vettoretto, L. (2009). A preliminary critique of the best and good practices approach in European spatial planning and policy-making. European Planning Studies, 17(7), 1067–1083. https://doi.org/10.1080/09654310902949620
- Wink, R. (2010). Transregional institutional learning in Europe: Prerequisites, actors and limitations. Regional Studies, 44(4), 499–511. https://doi.org/10.1080/00343400802331304
- Wuyts, S., & Geyskens, I. (2005). The formation of buyer–supplier relationships: Detailed contract drafting and close partner selection. Journal of Marketing, 69(4), 103–117. https://doi.org/10.1509/jmkg.2005.69.4.103
- Zollo, M., Reuer, J. J., & Singh, H. (2002). Interorganizational routines and performance in strategic alliances. Organization Science, 13(6), 701–713. https://doi.org/10.1287/orsc.13.6.701.503