
 ?Mathematical formulae have been encoded as MathML and are displayed in this HTML version using MathJax in order to improve their display. Uncheck the box to turn MathJax off. This feature requires Javascript. Click on a formula to zoom.
ABSTRACT
Although house prices and airports are influenced by distinct factors that shape their evolutions, they are also intrinsically connected through the natural and built environment. Standard theory suggests that air-traffic noise and proximity to key economic hubs such as airports are of prime importance to house prices and the housing market. This study contributes to understanding the link between the housing market, airport location proximity and air traffic. The research investigates this association across four key urban areas within New Zealand proximal to an international airport: Auckland, Wellington, Christchurch and Queenstown. Applying a generalized least squares (GLS) regression approach, the analysis reveals that house prices, air-traffic activity and proximity to airports within New Zealand demonstrate a statistically significant effect, and that air traffic volume has a positive effect on house prices. Moreover, the findings reveal a ‘U’-shape relationship between distance to the airport and house prices, suggesting that airport noise and pollution adversely affect house prices, with this effect diminishing with distance, indicating that economic influences and employment may also serve as a positive externality.
1. INTRODUCTION
In the housing literature, there is evidence that the location of the house is one key characteristic that can impact its price (Chau & Chin, Citation2003; Heyman, Law, & Berghauser Pont, Citation2019; Lieske, van den Nouwelant, Han, & Pettit, 2021) as a consequence of proximity to both positive and negative externalities such as schools or public parks (Bartholomew & Ewing, Citation2011; Diewert, Haan, & Hendriks, Citation2014) or exposed to pollution and antisocial behaviour (Han, Han, & Zhu, Citation2018; Mohamad et al., Citation2016; Wadley, Elliott, & Han, Citation2017). The impact of air quality, noise and proximity to various types of urban infrastructure can arguably have an important influence on the quality of life and has become a key issue for consumers when choosing a residential neighbourhood (McCord et al., Citation2018).
Notably, the effect of noise ostensibly depends not only on the noise intensity to which dwellings are exposed, but also on the nature of the noise source and the consequences for social aversion. Schreurs, Verheijen, and Jabben (Citation2011), undertaking research for the National Institute for Public Health and the Environment in the Netherlands into valuing airport noise, estimated that the depreciation of real estate value due to airport noise to be in the region €1 billion. Equally, they estimated the depreciation of land value to be approximately €600 million. Therefore, the effects of major airports, and their expansions, can be quite controversial and present a topic of debate in terms of an externality effect on house prices and housing markets.
Seminal studies, such as that of Tomkins et al. (Citation1998), do, however, point out that there is a noise versus access debate on the impact of airports on urban property markets, with the effects unlikely to exhibit a uniform, or linear, spatial distribution. Regarding the relationship between airports (noise and other pollutants) and house prices, various international studies (Cohen & Coughlin, Citation2008; Dekkers & van der Straaten, Citation2009; Lijesen, Straaten, Dekkers, Elk, & Blokdijk, Citation2010; McMillen, Citation2004; van Praag & Baarsma, Citation2005; Zheng et al., Citation2020) have tended to show that properties located in closer proximity to an airport tend to have their prices lower than their counterparts, primarily due to increased exposure to noise and air pollution. In contrast, studies such as that of Lipscomb (Citation2003) have revealed price premiums in relation to proximity to airports. Accordingly, there are associated costs and benefits, or disamenity and amenity effects with regards to the presence of, and distance to, airports, with the benefits generally perceived to be access, employment and upgraded infrastructure; and the costs mainly environmental degradation and problems of noise and traffic congestion for adjacent populations.
Despite the voluminous literature examining the adjacency of airports as an externality, there remains limited evidence and empirical insights as to whether this effect is observable in the New Zealand context. More importantly, given the recent COVID-19 pandemic where the global aviation sector was halted with much fewer flying activities, one question arises: Does proximity to airports influence house prices? This study, therefore, examines housing prices and their determinants in New Zealand suburbs surrounding the four international airport cities of Auckland, Christchurch (Harewood), Wellington (Rongotai) and Queenstown (Frankton). The reasons to choose New Zealand as a case study is that the country’s housing prices kept increasing even during the COVID-19 recession (Yiu, Citation2021), and that only New Zealanders were allowed to travel back to the country via the four international airports due to the country’s border restrictions (Gössling et al., Citation2021; Ngo, Citation2020). Applying cross-sectional data at the suburb level, we develop several generalized least square (GLS) regression models and measure the distance of the suburb to the airport, airline traffic (passenger) volume change between 2017 and 2021, and finally we account for the effect of COVID-19 to examine whether this has had an impact on the New Zealand housing market. In this sense, our contribution to the literature is twofold. First, this study is the first attempt to account for the non-linear relationship between airport proximity and house prices, despite the fact that it has been observed previously (Kaur et al., Citation2021; Rahmatian & Cockerill, Citation2004). Second, we provide a more detailed picture of the above relationship in the New Zealand housing market using a large dataset (four airports, five regions – of which Auckland Airport covers two regions, 334 suburbs and five years, yielding about 1500 observations), especially during the COVID-19 pandemic where a record number of New Zealanders returning to the country was observed, which significantly affected the market (Statistics New Zealand, Citation2020; Stuff, Citation2020; The New York Times, Citation2021).
2. RELEVANT STUDIES
In the context of housing literature, an emerging and important area of research in terms of sustainability goals and the more general health and well-being of the global population relates to noise pollution and the environmental, economic, and social (dis)amenity effects. These environmental externalities, neighbourhood amenities and their proximity are key considerations for property prices (McConnell & Walls, Citation2005). Indeed, in relation to environmental economics there has been a long and established history within hedonic pricing studies which have examined the nature and role of proximate locational externalities (Kauko, Citation2003), neighbourhood and school quality (Gibbons & Machin, Citation2008; Forrest et al., Citation1996; Mohamad et al., Citation2016; Rehm & Filippova, Citation2008), environmental degradation (Bao, Citation2021), air pollution and quality (Amini et al., Citation2022), traffic noise and proximity (Andersson, Jonsson, & Ögren, Citation2010; Blanco & Flindell, Citation2011; Day, Bateman, & Lake, Citation2007), accessibility to amenities (Duarte & Tamez, Citation2009) and key infrastructure amenities (Efthymiou & Antoniou, Citation2013).
2.1. Airport proximity and noise
The institutional setting and impact of airport proximity on neighbouring communities is a strongly debated topic as to whether they are perceived as amenities or disamenties (Affuso et al., Citation2019; Salvi, Citation2008). According to Salvi (Citation2008), the positive aspects of proximity are generally related to the provision of communication links and to the direct economic importance of airports, with the negative impacts largely stemming from the adverse environmental effects primarily associated with aircraft noise. Numerous studies have therefore examined the proximal effects to airports and aircraft noise on housing markets using a variety of econometric specifications and approaches. Indeed, studies investigating the effects of airport noise on residential housing markets extend back to the mid-1970s where seminal research (Nelson, Citation1979; O'Byrne, Nelson, & Seneca, Citation1985; Rosen, Citation1974) explored the connection between cumulative measures of airport noise and property prices for a number of North American and European airports. Since then, research within this area has progressed alongside the increased sophistication of software and the availability of data for measuring the proximity and noise effects.
The early study by Uyeno, Hamilton, and Biggs (Citation1993) estimated the density and impact of airport noise on property values for detached houses, multiple-unit residential condominiums and also for vacant land. Applying a variety of regression models to test continuous and banded distance, they found that a unitary increase in noise level results in a decrease of approximately 0.65% in property price for detached houses. Notably, the authors showed that a one unit increase in noise level results in a decrease of approximately 0.90% for condominiums. When considering the impact on vacant land values, they found that vacant land values are approximately 16% lower for properties exposed to a 10 dB incremental levels. Taking a slightly different approach, and building on the findings of Uyeno et al. (Citation1993), Collins and Evans (Citation1994) applied an artificial neural network (ANN) approach to identify whether there was an effect between aircraft noise and residential property values. Considering the application of ANNs to be useful due to their powerful abilities for pattern recognition and to distinguish between complex neighbourhood classifications, the authors revealed a range of value effects which differ markedly between property types. Notably, they identified that detached house prices are more sensitive to aircraft noise than semi-detached or terraced properties.
Espey and Lopez (Citation2000) applying hedonic analysis also estimated the relationship between residential property values, airport noise and proximity to the airport in the Reno–Sparks area of Nevada, USA. Their results showed a statistically significant negative relationship between airport noise and residential property values, with the average home in areas where noise levels are 65 dB or higher displaying a discount of US$2400 than equivalent homes located in quieter areas. Similarly, Cohen and Coughlin (Citation2008) when comparing various spatial econometric models to examine the impact of airport noise for Atlanta in Georgia, USA, showed that houses located in areas considered outside of ‘normal’ day–night general decibel levels sold for 21% less than houses located in areas where the normally accepted decibel ranges were not breached. In addition, they revealed there to be a negative price elasticity effect, indicating that houses further from the airport, on average, have lower sales prices, inferring that proximity to the airport demonstrates somewhat of an amenity effect. This finding is in accord with the earlier study of Tomkins et al. (Citation1998) who found proximity to Manchester Airport in the UK to comprise an amenity effect citing employment and economic benefits.
The work of Affuso et al. (Citation2019) also questioning whether airport proximity is an amenity or disamenity, applied spatial autoregressive models with directional effects to assess the impact of airport noise on housing values in Memphis, Tennessee, USA. Their study established that proximity to Memphis International Airport is perceived as a disamenity, with an average external cost of US$4795/dB of noise per household. This was also notable in the research of Dekkers and van der Straaten (Citation2009) who developed a spatially explicit hedonic pricing model to quantify the social cost of aircraft noise disturbance around Amsterdam Airport in the urban fringe of the Amsterdam region. They found that higher noise levels resulted in lower house prices. More specifically, the authors discovered air traffic noise comprising the largest price effect, showing a marginal benefit of 1 dB noise reduction of €1459 per house, leading to a total benefit of 1 dB noise reduction of €574 million. Salvi (Citation2008) also applied spatial econometric techniques to measure the impact of airport noise on the price of single-family homes in the Zurich Airport area. Using approximately 4000 sales transactions and georeferenced noise measurements aligned to changing patterns of runways configurations derived from a proprietary aircraft noise model,Footnote1 and controlling for neighbourhood fixed-effects, the author established a noise discount index of 0.97%, with typical discounts ranging between 2% and 8%. In a comparable paper, Rahmatian and Cockerill (Citation2004) observed that the average home prices in southern California were lower by approximately US$16,600–17,400 for houses located within 150–300 m from an airport, and more than US$21,000 for houses located between 600 and 750 m. Similarly, recent research undertaken by Kaur et al. (Citation2021) also found that houses locate within the 400–500 m radius of Essendon Airport in Melbourne, Victoria, Australia, have an average price of AUS $515,015, noting that when the radius increases to 1.3–1.4 km (but still within the noise contour of the airport) and further to 1.6–1.8 km, the average prices respectively increased to AUS $809,748 and then dropped to AUS $688,659.
A strand of enquiry has evolved with studies investigating the relocation and expansion of airports and flight paths on housing market activity, behaviour and pricing levels, with opponents of airport expansions arguing that increased noise will reduce property values and lower tax bases. In a study estimating the effect of the expansion of O’Hare International Airport in Chicago, Illinois, USA, and the accompanying noise on property values in the area, McMillen (Citation2004) found home values to be 10% lower in areas that are subject to severe noise. Despite this initial finding, they did acknowledge and estimate that with aircraft becoming quieter, house prices may rise by as much as US$284.6 million in the densely populated area around O’Hare after a new runway is added to the airport. A comparable study by Jud and Winkler (Citation2006) also explored the influence of the announcement effect of a new airport hub on housing prices. Controlling for extraneous influences, they found that property prices within a 2.5-mile radius declined approximately 9% in the post-announcement period within a 65 dB noise contour band, with properties located within the subsequent 1.5-mile proximity band, decreasing by 6% in the post-announcement period.
More laterally, Mense and Kholodilin (Citation2014) scrutinized the effects of an airport expansion and accompanying noise on house and apartment prices located under (new) planned flight paths. The findings revealed that property listing reduced sizeably in areas located under the published flight paths, with an average decrease in value of 9.2% up to a distance of 3 km. Their analysis also indicated that where the intended flight altitude was below 1 km, the discount ranged between 11.8% and 12.8%, whereas higher flight altitudes observed an average discount of approximately 8.3%.
A similar research study was conducted by McCord et al. (Citation2018) using advanced spatial modelling techniques to assess proximity to airport noise and if the flight path affected property prices for Belfast, UK. The authors found that high and moderate noise dB levels exhibited a negative influence on house prices. They also noted that there are spatially distinctive patterns in proximity to the airport, observing some market areas to be unaffected by the distance and noise externality, whereas other markets areas displayed negative associations across the coefficient quartiles which they suggested was a consequence of the existing flight path which is located directly above the south of the city. Directly measuring whether the houses fell within the boundary of being directly under the regional airport flight path, and whether the dB levels impact market pricing, they found that flight path noise has a negative impact on house prices of approximately 5.5%.
Some existing research has further explored the effect of airport proximity and noise on differing sized airports. Lipscomb (Citation2003), in an interesting paper focusing on the impacts an airport on a small urban city, found that being 1 mile further from Hartsfield International Airport in Atlanta, Georgia, decreases the sales price of a house, on average, by approximately US$36,332, and also demonstrating a US$9083 decrease in the sales price for each quarter-mile proximity relative to an average valued house of US$101,708. Appositely, the author revealed there to be no statistical significance of noise as a predictor of sales price, which he suggests is most likely due to a change in the noise level not causing a significant change in sales price, and that proximity may infer that the benefits outweigh the liabilities in smaller cities reliant to the economic benefits of the airport.
A comparable study undertaken by Lu and Morrell (Citation2006) also investigated the existence of environmental and social costs at different sized airports and the role of aircraft noise and engine emissions. Employing data for three major British airports and two Dutch airports, the authors found that the impacts of engine emissions were greater than that of noise. Further assessing the environmental cost with the traffic volume of an airport, the results for the five selected airports revealed a curvilinear relationship between annual environmental costs and aircraft movements, suggesting that marginal environmental costs are increasing as aircraft movements increase, more notably for larger airports as a consequence of social costs.
Equally, Tsao and Lu (Citation2022), for the case of Taiwan Taoyuan International Airport, evaluated the impact of aviation noise on house prices employing three different hedonic price models (HPMs). Their empirical results revealed that aviation noise has a significant negative impact on house prices in the region of US$2356/dB within the noise contour areas of 60–64 dB, and US$3623/dB for contour areas greater than 65 dB.
In terms of air-traffic volume, the research conducted by Tsui et al. (Citation2017) applying a two-least squares methodology to establish whether house prices across three key regions and airports within New Zealand are related to the level of air traffic, empirically found that airport traffic volume positively and significantly influenced house prices.
Other studies have integrated the role, proximity and noise related to airports in relation to socio-demographic characteristics of surrounding neighbourhoods and land-use ordinance and regulation. Ogneva-Himmelberger and Cooperman (Citation2010) in a spatio-temporal analysis of noise pollution near Boston Logan airport, Massachusetts, USA, identified ‘hot’ and ‘cold’ socio-demographic clusters representing spatial concentrations of social groupings to corresponding levels of vulnerability to environmental impacts and noise levels. Their findings revealed that social groupings ‘paying’ for the cost of noise from Logan International Airport in Boston is highly vulnerable as there are more minority and lower income populations, and lower house prices in the noise-affected areas.
In terms of planning ordinance, Batóg, Foryś, Gaca, Głuszak, and Konowalczuk (2019), investigating airport noise for a number of regional airports in Poland with a specific emphasis on the role of land-use regulation, applied spatial hedonic regression and a difference-in-differences approaches to examine the introduction of new land-use restrictions on property prices. They found that the introduction of land-use restrictions impacted upon property prices adjacent to airports.
In a follow up study, Batóg et al. (Citation2019) examined single-family house prices in adjacent areas proximal to the Gdansk Lech Walesa Airport and the Warsaw Chopin Airport in Poland. Using a variety of spatial econometric approaches, the findings revealed differential effects of proximity to airports on the prices of single-family houses located in limited-use areas in Gdansk and Warsaw.
2.2. Airport proximity and the willingness to pay
Whilst revealed preferences using hedonic-based price studies have dominated the literature, there have also been a number of stated preference studies, generally contingent valuation and ‘willingness-to-pay’ (WTP) methods, examining the impact of airport proximity and noise emanating back to the early to mid-1990s such as Feitelson et al. (Citation1996) and Navrud (Citation2002). Feitelson et al. (Citation1996) in a WTP and contingent valuation approach for investigating the impact of airport noise in light of an airport expansion revealed that compensation programmes do not fully compensate homeowners or renters for the loss associated with higher noise exposure. Research undertaken by Wardman and Bristow (Citation2008), examining Manchester, Lyon and Bucharest, looked at embedding aircraft noise nuisance within a broader quality-of-life context, namely changes in aircraft movements by aircraft type within specific time periods, and changes in generic aircraft movements by time of day. They established that respondents across the three selected airport regions value a change of one aircraft per hour in the daytime between €0.87 and €1.10, with evening changes in hourly aircraft volume ranging between €0.31 and €1.26.
Carlsson, Lampi, and Martinsson (Citation2004), using data on Stockholm, Sweden, also scrutinized how the marginal WTP for changes in noise levels is attributable to changes in the volume of flight movements by applying a choice experiment method. Similar to Wardman and Bristow (2008), they found the WTP to vary with the temporal dimensions, insofar that mornings and evenings have higher marginal values. The study undertaken by van Praag and Baarsma (2005), employing a survey in relation to individuals’ ‘life satisfaction or ‘happiness’ relative to income and exposure to aircraft noise, showed that the net income compensation required to offset aircraft noise equates to approximately 3% of net annual household income or 9% of housing costs. Similarly, Pope (Citation2008) focusing on the role of asymmetric information, and more specifically seller disclosure on the implicit price for airport noise for Raleigh–Durham International Airport, North Carolina, USA, indicated that the airport noise disclosure reduced the value of houses by almost 2.9%, which they estimate to translate into approximately a 37 percentage point increase in the implicit price of airport noise.
The existing studies, in line with an earlier meta-analysis undertaken by Nelson (Citation2004), reveal noise discounts attributable to airport proximity and air traffic which are more (or less) sizeable relating to market context and other economic circumstances, differences and market structures. The literature generally exhibits there to be consensus in terms of the noise discounts; however, the proximity of airports is more ambiguous with studies showing proximity to be either a disamenity or an amenity for some adjacent urban housing markets. This study therefore augments this debate by examining four key regional airports across New Zealand in order to identify whether, and to what level, there is an externality effect negative relationship between airport noise exposure, air-traffic volume and residential property values.
3. DATA AND METHODOLOGICAL APPROACH
3.1. Methodology
This research applies a critical realist approach, which relates to underpinning economic and consumer preference and choice reality of people making housing decisions based on house prices and amenity value such as proximity to airports (Affuso et al., Citation2019). In this regard, the hedonic price model (HPM) is the most common statistical approach used in housing price analysis (Affuso et al., Citation2019; Dekkers & van der Straaten, Citation2009; Salvi, Citation2008; Swoboda, Nega, & Timm, 2015; Theebe, Citation2004). In general, the HPM contends that buyers value each characteristic or attribute that makes up the product, for example, a house, differently, such that the price of that product should and can be disaggregated according to those characteristics (Lieske et al., Citation2021). Among those characteristics, the HPM literature, as discussed in the previous section, has identify a non-linear impact of airport proximity on house prices (Kaur et al., Citation2021; Rahmatian & Cockerill, Citation2004); however, this impact has not been empirically examined. In this sense, the incorporation of critical realism and HPM can provide better insights on this issue.
Specifically, Lieske et al. (Citation2021) and Zhang and Tao (Citation2020) argue that one could estimate the relationship between price and characteristics of a house as:
(1)
(1) where
measures the median price of houses in suburb i sold in year t;
is a vector of housing characteristics (including location, house size, land size, etc.) of the median house of suburb i sold in year t;
is a vector of parameters to be estimated; and
is the measurement error.
It is well versed that standard ordinary least squares (OLS) hedonic models are prone to functional form, biased coefficients and instability due to heteroscedasticity (Fletcher, Gallimore, & Mangan, Citation2000). To account for any possible correlation between the regression residuals, a panel generalized least squares (GLS) estimation method is employed in this study to examine the effects of different attributes on property price. In case the residuals are correlated and/or the variances of the observed values are not equal (i.e., heteroscedasticity is present), OLS and weighted least squares (WLS) will fail to be an efficient estimator, resulting in misleading spurious statistical inferences. In contrast, the GLS approach produces unbiased, efficient, consistent and asymptotically normal results.Footnote2 Therefore, within the confines of this research, the panel GLS allows for the estimation of robust results from an unbalanced panel dataset of the 312 suburbs in the neighbourhood of four international airports in New Zealand for the five-year period of 2017–21, whilst also controlling for the fixed effect variables (Haddad et al., Citation2011; Quigley, Citation1995; Wooldridge, Citation2016).
For the main techniques employed, two central themes are developed, each containing four regression models, in which both static and dynamic GLS regression approaches are adopted. The first theme explores a static temporal view (year on year), and the second theme adopts a dynamic temporal view where the time lag of price is also included. For each of these static and dynamic themes, we construct (1) a (base) model with no fixed effect, (2) a model with only the regional fixed effect, (3) a model with only the time/year fixed effect, and (4) a model with both the regional and yearly fixed effects.
From a technical perspective, a static linear regression takes the form of , whereas a dynamic linear regression can be expressed as
. In other words, in a static model, the dependent variable
is a function of a set of independent variables
from the same period, whereas in a dynamic model,
is also affected by its own value(s) from the
previous period. The temporal variability of the coefficient in the dynamic model therefore allows us to observe and model the change in the impact of an attribute on house price in a more flexible manner, which more accurately reflects the property price determination process in reality.
For the first theme, it is assumed that house prices (of a certain suburb in a certain year) are impacted by the characteristics of the houses in the same year and, thus, we define it as a static model of house prices. This first static approach incorporates a baseline model that explores global results for all five geographies with an international airport in proximity. The second model looks at regional fixed effects of the five geographies under analysis, with the third model statically looks at global results over time year by year (e.g., 2014, 2015, etc.). Model 4 further accounts for the regional fixed effects, but takes account of the temporal dimension, year by year.
As identified, several studies have found a positive linkage between tourism and air traffic to regional house prices (Alola et al., Citation2020; Biagi et al., Citation2015, Citation2016; Tsui et al., Citation2017). Since airport activities can influence air traffic and tourism, we therefore include the number of air passenger arrivals, , as a further control variable within the modelling. As discussed previously, the location characteristic represented by the distance between the house and the closest airport (
) can also contribute to house prices. Subsequently, we further control for the non-linear effect of this factor via
(i.e., the square of
); as previous research indicated that this non-linear relationship is apparent but remains limited within existing studies investigations. Note that the use of the quadratic term in non-linear econometric analysis is common (Dai et al., Citation2020; Pérez-Molina, Citation2022; Xiao et al., Citation2019).
Furthermore, to account for the impact of the recent COVID-19 pandemic, and to also consider the differences in house prices between regions and across different years, we modify equation (1) as follows:
(2)
(2) where
represents the number of air passenger’s throughput at airport i in year t;
measures the geographical distance between the centroid of a suburb i and the closest airport;
is the squares of
;
is a dummy variable which has the value of 1 for 2020 and 2021, and 0 otherwise;
is a vector of dummy variables represents the five regions of Auckland–Manukau city, Auckland–Papakura city, Wellington, Christchurch and Queenstown; and
is also a vector of dummy variables represents different years from 2017 to 2021.
It is noted that the five regions correspond to four international airports in New Zealand, which are Auckland Airport (covering two regions), Wellington Airport, Christchurch Airport and Queenstown Airport. These airports have the largest activities in the country, even during the COVID-19 pandemic (Ho, Nguyen, Ngo, & Le, Citation2021; Official Airline Guide, Citation2022). Therefore, we expect that the impact of on
as in equation (2) would be more pronounced at the suburbs surrounding those airports. We also note for the dataset timeframe that the city of Dunedin in the South Island also has an airport of international status, but since the COVID-19 pandemic the one regular international flight has not been reinstated, and thus it is omitted from the study.
For the second theme, we argue that house prices do not only reflect the same year’s characteristics but also are influenced by the house prices of the previous year, that is, the ‘momentum effect’ (Head, Lloyd-Ellis, & Sun, Citation2014; Oikarinen & Engblom, Citation2016; Tsui et al., Citation2019; Titman et al., Citation2014). Therefore, we include the time lag of price as an independent variable with the initial baseline global model – note that this technique is also popular in the generalized method of moments (GMM) approach (Le et al., Citation2021, Citation2022; Ngo et al., Citation2022; Yuen et al., Citation2022). The second model also incorporates a fixed spatial regional effect of all five geographies, with the third model a dynamic time lagging on price developed, and a final regional fixed effects of all five geographies further incorporated as follows:
(3)
(3) where
is the house price from the previous year. In this sense, the empirical themes and models can be summarized as in .
3.2. Data
The data applied within this study are derived from two main sources. First, the house price data for the four international airport cities of Auckland, Christchurch, Wellington and Queenstown encompassing sales prices (PRICE) and property characteristics such as house size, land size and number of bedrooms () was collated from CoreLogic who provide information on property analytics, valuations and sales transactions,Footnote3 providing 422,884 transactions in total dating back to 1980. CoreLogic is a global leader in property information in the United States, Australia and New Zealand; the property data of CoreLogic have been widely used by commercial banks, mortgage advisors, insurers and even the government (CoreLogic, Citation2022).
Comparative units of administrative geographies were applied based on the size of population and geographical expanse of each city. Notably, the Auckland ‘Supercity’ warranted the inclusion of both Manukau city and Papakura city given their geographical proximity to the airport. Overall, the data comprised 312 suburbs within the five city regions to which cross-sectional analysis was conducted in order to calculate the average price and distance (km) from each suburb (centroid) to the airport to obtain a robust ‘price–distance’ fixed effect from 1981 onwards. In this sense, this paper differs from previous studies by using suburb-level data, that is, each suburb is an observation, instead of regional or house-level data (Tsao & Lu, Citation2022; Tsui et al., Citation2019). However, it comes with a trade-off: we could not include other popular house-level variables such as the distance from a suburb to its central business district (CBD) or motorways as additional explanatory factors of our models.
Second, regarding air passenger traffic volume (), the data were directly extracted from the four international airports’ (Wellington, Christchurch, Auckland and Queenstown) monthly traffic reportsFootnote4 between 2017 and 2021. presents the variables, their descriptions and descriptive statistics of the data applied within the study. Given the nature of real estate data, the logarithmic of sales price is used as the log-linear model helps normalize the dataset and ease of interpretation of the estimation effects (Knoke, Burke, & Burke, Citation1980; Wooldridge, Citation2016).
Table 1. Empirical themes and models used within the analysis.
Table 2. Variables and descriptive statistics.
4. EMPIRICAL RESULTS AND DISCUSSION
4.1. Static analysis findings
We first report the results of static models, that is, ones that examine a median house in a certain suburb, with house price considered as a function of the house’s hedonic characteristics and other airport’s relevant factors (). The large values of the Wald 2 suggest that all the static models (models 1–4) provide insightful explanations on the influence of house size, land size, tourism, distance to the nearest airport and COVID-19 on house prices. Notably, the analysis shows that the signs and significant levels of the estimated coefficients are consistent across the models.
Table 3. Estimated results of the static models.
Model 1 provides the baseline model estimates with an R2 of 33%,Footnote5 and shows proximity to the nearest airport (DISTANCE) to exhibit a negative coefficient (−0.134), which is statistically significant at the 1% level, with the number of passengers (PAX) exhibiting a positive significant effect on house prices. As previously noted, we included the squared term of distance (DISTANCE2), to account for non-linearity. The findings from model 1 show this to be positive and statistically significant (0.014, p < 0.001), suggesting that the negative effect of proximity to airports seems to diminish over distance.
Model 2, accounting for regional fixed-effects, reveals an increase in R2 to 76%, and further confirms that proximity to airports display a negative effect of 13.4%. In contrast to model 1, the results observe PAX to be negative, although not statistically significant.
Model 4, which includes all variables (but the COVID dummy variable was omitted due to multicollinearity with the YEAR dummies), shows R2 increasing to 78%, and also exhibits distance to airports showing a negative effect (13.3%) on house prices, which also appears to diminish over space (DISTANCE2 = 0.012, p < 0.001).
4.2. Dynamic analysis findings
reports the results of the dynamic models (models 5–8) in which the median house price in a certain year is also influenced by its price from the previous year. The models exhibit increased R2 and 2 values, compared with the static models, suggesting that the inclusion of house price from the previous year improves the explanatory power of the models. Further, the coefficients on PRICEt−1 are positive and statistically significant, implying a certain degree of temporal autocorrelation within the transaction price time series. Similar to the static models, there is a relatively high consistency across models 5–8 in terms of their coefficient estimations. The findings of model 8 comprising both regional and time fixed effects show air passenger volume to be positive (PAX = 0.012, p > 0.05), however statistically insignificant. In terms of proximity to international airports, the findings exhibit both distance coefficients to be significant at the 1% level and revealing a negative effect of 9.8% (DISTANCE), which appears to diminish over space (DISTANCE2 = 0.009, p < 0.001).
Table 4. Estimated results of the dynamic models.
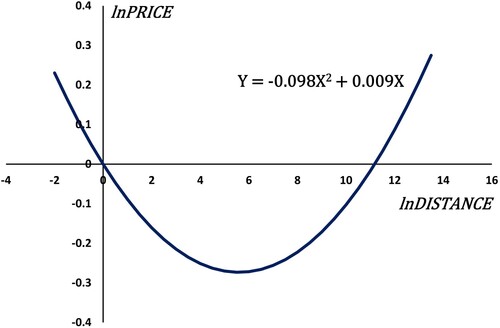
Further analysis into the role of proximity to airports exhibits a non-linear and inverse ‘U’-shape relationship to be evident between airport proximity and house prices (). To estimate the nature of the effect, we combine the positive coefficients of DISTANCE2 with the negative coefficients of DISTANCE to estimate the degree of distance and house prices. As observed in , using the distance coefficients from model 8 in our analysis, we estimate the level of at the minimum value of the quadratic function
, where
(i.e., the coefficient of DISTANCE2),
(i.e., the coefficient of DISTANCE), and
is a constant. Accordingly, the value of X which makes the quadratic function reach its minimum is computed as
and, thus, the corresponding value of airport proximity is
.Footnote6 In other words, houses (suburbs) located approximately within 300 m from an airport in New Zealand will have the lowest price, holding other factors constant, and as distance increases those houses (suburbs) further away show price premiums. This indicates that distance to airports can be viewed as both negative and positive externality as it suggests that houses in the immediate adjacency to airports will have lower prices, but only to a certain level of distance, then the prices will start to increase. In short, one can argue that airport noise and pollutions adversely affect the housing market in New Zealand, and that houses father away from the airport sell at a premium.
Figure 1. ‘U’-shape relationship between house price and airport proximity.
5. KEY FINDINGS AND DISCUSSION
This section is mainly based on the extended models of our analysis where the improved R2 of those models (compared with model 1) suggests that they can explain the situation of the New Zealand housing market. In this sense, we have successfully applied the HPM approach to examine whether and how the various attributes (e.g., house size, number of bedrooms, distance to the airport) affect property prices in New Zealand across regions and over time.
Our first notable finding is that across all eight models, the analysis exhibits the hedonic model tends to hold true for the New Zealand housing market. Specifically, house prices in New Zealand are influenced by the housing attributes, in which larger houses (both in terms of land size and house size) tend to be more expensive than smaller ones. This finding is in line with the hedonic price literature (e.g., Affuso et al., Citation2019; Lieske et al., 2019; Swoboda et al., Citation2015; Zhang & Tao, Citation2020). The impact of the number of bedrooms is, however, less clear, which may be explained by the fact that a three-bedroom house is the most common in New Zealand, so the variation in the number of bedrooms is small and contributes less to house prices. For instance, the number of three-bedroom houses dominates our dataset representing 64.85%, whilst the second and third popular sizes are four and two bedrooms, which account for only 12.92% and 11.01% of the sample, respectively.
Second, we also observed that house prices vary across New Zealand regions, which is revealed through the regional dummy variables (i.e., Auckland, Christchurch, Manukau, Papakura, Queenstown and Wellington). Particularly, the (negative) values of those regional dummy variables suggest that houses in Auckland were the most expensive, as all other regions have negative and significant coefficients (compared with the base region of Auckland). The second and third expensive regions are Manukau and Papakura (practically can also be considered as part of the Auckland Supercity), respectively, followed by Wellington and Queenstown. Houses in Christchurch were the cheapest (with the largest coefficients across models 2, 4, 6 and 8), which may be due to the major earthquakes in 2010 and 2011 (Kusumastuti & Nicholson, Citation2018)Footnote7 as well as stigma from the Christchurch attack in 2019 (BBC News, Citation2019).
Our third finding indicates that passenger volume (PAX) seemingly has an effect on house prices. It is evident in the literature that this type of external demand exerts pressure on local housing demand which both directly and indirectly impacts on housing values (Alola et al., Citation2020; Biagi et al., Citation2016; Tsui et al., Citation2017). As such, the service economy, tourism-related activities, and auxiliary effects such as job creation and the development of the hospitality sector to the local economies can result in higher incomes for the local communities and, thus, also has an indirect impact on house prices (Fu et al., Citation2021; Mikulić et al., Citation2021; Paramati & Roca, Citation2019; Tsui et al., Citation2019). Accordingly, this finding not only supports the tourism-led policy of New Zealand (MBIE, Citation2017; Tourism Industry Aotearoa, Citation2019), but also indicates that domestic travel and tourism can play an important role for house prices.
Fourth, while passenger volume may be observed as a positive externality, the effects of airport noise, distance and congestion have been viewed in the literature as negative externalities on house values (Affuso et al., Citation2019; Dekkers & van der Straaten, Citation2009; McCord et al., Citation2018; Mense & Kholodilin, Citation2014). Our findings confirm this effect, as demonstrated by the negative coefficients across the static and dynamic models which suggested that houses in closer proximity to an airport are cheaper than their counterparts; however, that this effect also diminishes and displays an inverse parabolic ‘U’-shape effect. This finding is in keeping with studies such as Rahmatian and Cockerill (Citation2004) and Kaur et al. (Citation2021) which both observed house prices within immediate proximity to airports to be lower which diminished with distance and increased outside the airport noise contour.
Finally, we also examined the impacts of the recent COVID-19 pandemic on the New Zealand housing market, which reflects via the dummy variable COVID, and via the yearly dummies (i.e., for 2020 and 2021 compared with the 2017–19 period). The first impression is that housing prices were on an increasing trajectory, with the coefficients of the yearly dummies all positive and significant across the models containing time-fixed effects (models 3, 4, 7 and 8). In fact, the ‘housing bubble’ was observed in New Zealand even before the pandemic (Johnson et al., Citation2018; Tookey, Citation2017). In combination, the coefficient of COVID is also positive and significant, suggesting that the recent pandemic also contributed to the prices increase of New Zealand houses driven by acute demand tastes and increased monetary supply. The onset of the pandemic in 2020 led to a record increase in the number of New Zealanders returning to the country (Statistics New Zealand, Citation2020; Stuff, Citation2020; The New York Times, Citation2021). This, in turn, has put more pressure on the country’s housing market and, thus, it is understandable that house prices kept increasing during the 2020–21 period.
6. CONCLUSIONS
There exists a volume of research that has isolated the effects of externalities on property prices, and specifically investigating the role of airports as an amenity. This paper has added to this literature base and provides one of the first, if not the first, studies to conduct analysis into the proximal effect of four international airports located in New Zealand on their surrounding suburbs using several static and dynamic fixed-effects GLS hedonic models.
The research findings, across the differing GLS models, showed when accounting for spatial and time fixed-effects that the proximity to airports in New Zealand revealed a consistent negative effect on property prices. When further investigating the proximity effect by measuring the quadratic function of the distance coefficients, the findings clearly exhibited an inverse ‘U’-shape relationship to be evident indicating that housing in suburbs closer to airports exhibit a discount, which diminishes with distance and houses located further away to display a premium. An interesting finding also showed that air traffic volume seemingly has a positive impact on property prices which may be due to economic benefits this brings to the local economy, although further research is required to isolate and examine this potential effect in more detail.
The research is therefore important in terms of providing an evidence base for policy particularly in terms of planning interventions in urban environments, such as pollution controls, air traffic limits, congestion charging proposals and urban infrastructure proposals. This study also contributes to the real estate valuation literature, valuation profession and policy, in that it provides a market transaction price-based empirical assessment of how property values can be impacted by the presence of key infrastructure such as airports. For example, the findings could serve as a reference for determining the amount of compensation for noise/air pollution impacts on affected communities due to new private or public (re)development projects such as airport expansion under the ‘polluter pays’ principle. The findings provide clear evidence that local air zone management strategies and noise abatement and management strategies need further examination in suburbs proximal to airports in New Zealand, a fundamental issue for policy development and management targeting.
In consolidating these findings, future work will seek to use data which are spatially referenced in order to measure the nature of the effect more proficiently, and specifically the spatial heterogeneity of house prices and proximity to airports. Accordingly, the results of this study are subjected to some limitations that should be addressed in future research. For example, we do not consider other sources of pollution within the vicinity of the airport (such as soil pollution), which may have price dampening effects. We also do not investigate whether other key infrastructures or transportation comprise an effect and if the proximity to airports varies by property typology. Future research is suggested to incorporate other housing attributes and local amenities to further measure this relationship, and also within a more spatially based framework.
DISCLOSURE STATEMENT
No potential conflict of interest was reported by the authors.
Notes
1 Provided by the Swiss Federal Laboratories for Materials Testing and Research (EMPA).
2 For instance, see Case and Quigley (Citation1991) and Olmo (Citation1995) for a discussion on the application of GLS in real estate research.
4 For instance, for Auckland and Christchurch airport passenger traffic updates, see https://corporate.aucklandairport.co.nz/news/publications/monthly-traffic-updates; and https://www.christchurchairport.co.nz/about-us/who-we-are/facts-and-figures/monthly-passenger-arrivals-and-departures/.
5 It is not uncommon to find such low R2 values in previous HPM studies (e.g., Lake et al., Citation1998; Yun Joe Wong et al., Citation2003; Elsinga & Hoekstra, Citation2005; Bourassa et al., Citation2011; Leishman & Watkins, Citation2017; Bełej et al., Citation2020), not to mention that it is only our base model and that the R2 was improved in the extended models.
6 A quadratic function is minimized when its first derivative equals zero, that is, . Therefore,
. The numbers are subjected to the rounding effect.
7 House prices in Christchurch increased faster than in Auckland and Wellington during the 2005–09 period (Shi et al., Citation2014), but the market slowed after 2010.
REFERENCES
- Affuso, E., Caudill, S. B., Mixon, F. G., & Starnes, K. W. (2019). Is airport proximity an amenity or disamenity? An empirical investigation based on house prices. Land Economics, 95(3), 391–408. https://doi.org/10.3368/le.95.3.391
- Alola, A. A., Asongu, S. A., & Alola, U. V. (2020). House prices and tourism development in Cyprus: A contemporary perspective. Journal of Public Affairs, 20, e2035. https://doi.org/10.1002/pa.2035
- Amini, A., Nafari, K., & Singh, R. (2022). Effect of air pollution on house prices: Evidence from sanctions on Iran. Regional Science and Urban Economics, 93, 103720. https://doi.org/10.1016/j.regsciurbeco.2021.103720
- Andersson, H., Jonsson, L., & Ögren, M. (2010). Property prices and exposure to multiple noise sources: Hedonic regression with road and railway noise. Environmental and Resource Economics, 45(1), 73–89. http://doi.org/10.1007/s10640-009-9306-4
- Bao, H. X. (2021). Urbanisation, environmental externalities and house prices in China. In R. T. Abdulai & K. G. B. Awuah (Eds.), Sustainable real estate in the developing world (pp. 141–167). Emerald.
- Bartholomew, K., & Ewing, R. (2011). Hedonic price effects of pedestrian- and transit-oriented development. Journal of Planning Literature, 26(1), 18–34. http://doi.org/10.1177/0885412210386540
- Batóg, J., Foryś, I., Gaca, R., Głuszak, M., & Konowalczuk, J. (2019). Investigating the impact of airport noise and land use restrictions on house prices: Evidence from selected regional airports in Poland. Sustainability, 11(2), 412. http://doi.org/10.3390/su11020412
- BBC News. (2019). Christchurch shootings: New Zealand falls silent for mosque victims. BBC News. https://www.bbc.com/news/world-asia-47662450.
- Bełej, M., Cellmer, R., & Głuszak, M. (2020). The impact of airport proximity on single-family house prices—evidence from Poland. Sustainability, 12(19), 7928. https://doi.org/10.3390/su12197928
- Biagi, B., Brandano, M. G., & Caudill, S. B. (2016). Tourism and house prices in Italy: A latent class approach. Tourism Economics, 22(5), 964–978. https://doi.org/10.5367/te.2015.0470
- Biagi, B., Brandano, M. G., & Lambiri, D. (2015). Does tourism affect house prices? Evidence from Italy. Growth and Change, 46(3), 501–528. https://doi.org/10.1111/grow.12094
- Blanco, J. C., & Flindell, I. (2011). Property prices in urban areas affected by road traffic noise. Applied Acoustics, 72(4), 133–141. http://doi.org/10.1016/j.apacoust.2010.11.004
- Bourassa, S. C., Hoesli, M., Scognamiglio, D., & Zhang, S. (2011). Land leverage and house prices. Regional Science and Urban Economics, 41(2), 134–144. https://doi.org/10.1016/j.regsciurbeco.2010.11.002
- Carlsson, F., Lampi, E., & Martinsson, P. (2004). The marginal values of noise disturbance from air traffic: Does the time of the day matter?. Transportation Research Part D: Transport and Environment, 9(5), 373–385. http://doi.org/10.1016/j.trd.2004.07.002
- Case, B., & Quigley, J. M. (1991). The dynamics of real estate prices. The Review of Economics and Statistics, 73(1), 50. http://doi.org/10.2307/2109686
- Chau, K. W., & Chin, T. (2003). A critical review of literature on the hedonic price model. International Journal for Housing Science and Its Applications, 27(2), 145–165.
- Chica Olmo, J. (1995). Spatial estimation of housing prices and locational rents. Urban Studies, 32(8), 1331–1344. http://doi.org/10.1080/00420989550012492
- Cohen, J. P., & Coughlin, C. C. (2008). Spatial hedonic models of airport noise, proximity, and housing prices. Journal of Regional Science, 48(5), 859–878. https://doi.org/10.1111/j.1467-9787.2008.00569.x
- Collins, A., & Evans, A. (1994). Aircraft noise and residential property values: An artificial neural network approach. Journal of Transport Economics and Policy, 28(2), 175–197.
- CoreLogic. (2022). About Us: Who we are. CoreLogic NZ Limited. https://www.corelogic.co.nz/about-us/who-we-are
- Dai, J., Lv, P., Ma, Z., Bi, J., & Wen, T. (2020). Environmental risk and housing price: An empirical study of Nanjing, China. Journal of Cleaner Production, 252, 119828. https://doi.org/10.1016/j.jclepro.2019.119828
- Day, B., Bateman, I., & Lake, I. (2007). Beyond implicit prices: Recovering theoretically consistent and transferable values for noise avoidance from a hedonic property price model. Environmental and Resource Economics, 37(1), 211–232. http://doi.org/10.1007/s10640-007-9121-8
- Dekkers, J. E., & van der Straaten, J. W. (2009). Monetary valuation of aircraft noise: A hedonic analysis around Amsterdam airport. Ecological Economics, 68(11), 2850–2858. https://doi.org/10.1016/j.ecolecon.2009.06.002
- Diewert, W. E., Haan, J. de, & Hendriks, R. (2014). Hedonic regressions and the decomposition of a house price index into land and structure components. Econometric Reviews, 34(1-2), 106–126. http://doi.org/10.1080/07474938.2014.944791
- Duarte, C. M., & Tamez, C. G. (2009). Does noise have a stationary impact on residential values? Journal of European Real Estate Research, 2(3), 259–279.
- Efthymiou, D., & Antoniou, C. (2013). How do transport infrastructure and policies affect house prices and rents? Evidence from Athens, Greece. Transportation Research Part A: Policy and Practice, 52, 1–22. https://doi.org/10.1016/j.tra.2013.04.002
- Elsinga, M., & Hoekstra, J. (2005). Homeownership and housing satisfaction. Journal of Housing and the Built Environment, 20(4), 401–424. https://doi.org/10.1007/s10901-005-9023-4
- Espey, M., & Lopez, H. (2000). The impact of airport noise and proximity on residential property values. Growth and Change, 31(3), 408–419. https://doi.org/10.1111/0017-4815.00135
- Feitelson, E. I., Hurd, R. E., & Mudge, R. R. (1996). The impact of airport noise on willingness to pay for residences. Transportation Research Part D: Transport and Environment, 1(1), 1–14. https://doi.org/10.1016/S1361-9209(96)00004-1
- Fletcher, M., Gallimore, P., & Mangan, J. (2000). Heteroscedasticity in hedonic house price models. Journal of Property Research, 17(2), 93–108. http://doi.org/10.1080/095999100367930
- Forrest, D., Glen, J., & Ward, R. (1996). The impact of a light rail system on the structure of house prices: A hedonic longitudinal study. Journal of Transport Economics and Policy, 30(1), 15–29.
- Fu, X., Tsui, K. W. H., Sampaio, B., & Tan, D. (2021). Do airport activities affect regional economies? Regional analysis of New Zealand’s airport system. Regional Studies, 55(4), 707–722. https://doi.org/10.1080/00343404.2020.1851359
- Gibbons, S., & Machin, S. (2008). Valuing school quality, better transport, and lower crime: Evidence from house prices. Oxford Review of Economic Policy, 24(1), 99–119. https://doi.org/10.1093/oxrep/grn008
- Gössling, S., Scott, D., & Michael Hall, C. (2021). Pandemics, tourism and global change: A rapid assessment of COVID-19. Journal of Sustainable Tourism, 29(1), 1–20. https://doi.org/10.1080/09669582.2020.1758708
- Haddad, K., Rahman, A., & Kuczera, G. (2011). Comparison of ordinary and generalised least squares regression models in regional flood frequency analysis: A case study for New South Wales. Australasian Journal of Water Resources, 15(1), 59–70. doi:10.1080/13241583.2011.11465390
- Han, B., Han, L., & Zhu, G. (2018). Housing price and fundamentals in a transition economy: The case of the Beijing market. International Economic Review, 59(3), 1653–1677. http://doi.org/10.1111/iere.2018.59.issue-3
- Head, A., Lloyd-Ellis, H., & Sun, H. (2014). Search, liquidity, and the dynamics of house prices and construction. American Economic Review, 104(4), 1172–1210. http://doi.org/10.1257/aer.104.4.1172
- Heyman, A., Law, S., & Berghauser Pont, M. (2019). How is location measured in housing valuation? A systematic review of accessibility specifications in hedonic price models. Urban Science, 3(1), 3. http://doi.org/10.3390/urbansci3010003
- Ho, T. H., Nguyen, D. T., Ngo, T., & Le, T. D. Q. (2021). Airfares data in New Zealand domestic aviation market. Sustainability, 13(16), 8916. https://www.mdpi.com/2071-1050/13/16/8916.
- Johnson, A., Howden-Chapman, P., & Eaqub, S. (2018). A stocktake of New Zealand’s housing. Ministry of Business, Innovation and Employment (MBIE).
- Jud, G. D., & Winkler, D. T. (2006). The announcement effect of an airport expansion on housing prices. The Journal of Real Estate Finance and Economics, 33(2), 91–103. https://doi.org/10.1007/s11146-006-8943-4
- Kauko, T. (2003). Residential property value and locational externalities: On the complementarity and substitutability of approaches. Journal of Property Investment and Finance, 21(3), 250–270.
- Kaur, K. P., Cardak, B. A., & McAllister, R. (2021). The impact of airport noise on house prices. Q Open, 1(2), qoab012. https://doi.org/10.1093/qopen/qoab012
- Knoke, D., Burke, P. J., & Burke, P. J. (1980). Log-linear models. Sage.
- Kusumastuti, D., & Nicholson, A. (2018). Mixed-use development in Christchurch, New Zealand: Do you want to live there? Urban Studies, 55(12), 2682–2702. https://doi.org/10.1177/0042098017725475
- Lake, I. R., Lovett, A. A., Bateman, I. J., & Langford, I. H. (1998). Modelling environmental influences on property prices in an urban environment. Computers, Environment and Urban Systems, 22(2), 121–136. https://doi.org/10.1016/S0198-9715(98)00012-X
- Le, T. D. Q., Ho, T. H., Nguyen, D. T., & Ngo, T. (2022). A cross-country analysis on diversification, sukuk investment, and the performance of Islamic banking systems under the COVID-19 pandemic. Heliyon, 8(3), e09106. 10.1016/j.heliyon.2022.e09106
- Le, T. D. Q., Ho, T. H., Nguyen, D. T., & Ngo, T. (2021). Fintech credit and bank efficiency: International evidence. International Journal of Financial Studies, 9(3), 44. https://doi.org/10.3390/ijfs9030044
- Leishman, C., & Watkins, C. (2017). Assessing the spatial impact of policy interventions on real-estate values: An exemplar of the use of the hybrid hedonic/repeat-sales method. Regional Studies, Regional Science, 4(1), 202–217. https://doi.org/10.1080/21681376.2017.1360790
- Lieske, S. N., Van Den Nouwelant, R., Han, J. H., & Pettit, C. (2021). A novel hedonic price modelling approach for estimating the impact of transportation infrastructure on property prices. Urban studies, 58(1), 182–202. https://doi.org/10.1177/0042098019879382.
- Lijesen, M., Straaten, W. van der, Dekkers, J., Elk, R., & Blokdijk, J. (2010). How much noise reduction at airports?. Transportation Research Part D: Transport and Environment, 15(1), 51–59. http://doi.org/10.1016/j.trd.2009.07.006
- Lipscomb, C. (2003). Small cities matter, too: The impacts of an airport and local infrastructure on housing prices in a small urban city. Review of Urban and Regional Development Studies, 15(3), 255–273. https://doi.org/10.1111/j.1467-940X.2003.00076.x
- Lu, C., & Morrell, P. (2006). Determination and applications of environmental costs at different sized airports – aircraft noise and engine emissions. Transportation, 33(1), 45–61. https://doi.org/10.1007/s11116-005-2300-y
- Mcconnell, V., & Walls, M. A. (2005). The value of open space: Evidence from studies of nonmarket benefitsResources for the Future.
- McCord, M. J., MacIntyre, S., Bidanset, P., Lo, D., & Davis, P. (2018). Examining the spatial relationship between environmental health factors and house prices: NO2 problem? Journal of European Real Estate Research, 11(3), 353–398. https://doi.org/10.1108/JERER-01-2018-0008
- McMillen, D. P. (2004). Airport expansions and property values: The case of Chicago O’Hare airport. Journal of Urban Economics, 55(3), 627–640. https://doi.org/10.1016/j.jue.2004.01.001
- Mense, A., & Kholodilin, K. A. (2014). Noise expectations and house prices: The reaction of property prices to an airport expansion. The Annals of Regional Science, 52(3), 763–797. https://doi.org/10.1007/s00168-014-0609-1
- Mikulić, J., Vizek, M., Stojčić, N., Payne, J. E., Časni, A.Č., & Barbić, T. (2021). The effect of tourism activity on housing affordability. Annals of Tourism Research, 90, 103264. https://doi.org/10.1016/j.annals.2021.103264
- Ministry of Business, Innovation and Employment (MBIE). (2017). New Zealand tourism forecast 2017–2023. MBIE.
- Mohamad, M. H., Nawawi, A. H., & Sipan, I. (2016). Review of building, locational, neighbourhood qualities affecting house prices in Malaysia. Procedia – Social and Behavioral Sciences, 234, 452–460. https://doi.org/10.1016/j.sbspro.2016.10.263
- Navrud, S. (2002). The state-of-the-art on economic valuation of noise: Final report to European commission DG environment. The Commission.
- Nelson, J. P. (1979). Airport noise, location rent, and the market for residential amenities. Journal of Environmental Economics and Management, 6(4), 320–331.
- Nelson, J. P. (2004). Meta-analysis of airport noise and hedonic property values. Journal of Transport Economics and Policy (JTEP), 38(1), 1–27.
- Ngo, T. (2020). International travel restriction and border closure estimate the imported cases of COVID-19, and lock-down policy in New Zealand. The Empirical Economics Letters, 19(8), 082020.
- Ngo, T., Trinh, H. H., Haouas, I., & Ullah, S. (2022). Examining the bidirectional nexus between financial development and green growth: International evidence through the roles of human capital and education expenditure. Resources Policy, 79, 102964. https://doi.org/10.1016/j.resourpol.2022.102964
- O'Byrne, P. H., Nelson, J. P., & Seneca, J. J. (1985). Housing values, census estimates, disequilibrium, and the environmental cost of airport noise: A case study of Atlanta. Journal of Environmental Economics and Management, 12(2), 169–178.
- Official Airline Guide. (2022). OAG data analyser. OAG.
- Ogneva-Himmelberger, Y., & Cooperman, B. (2010). Spatio-temporal analysis of noise pollution near Boston logan airport: Who carries the cost? Urban Studies, 47(1), 169–182. https://doi.org/10.1177/0042098009346863
- Oikarinen, E., & Engblom, J. (2015). Differences in housing price dynamics across cities: A comparison of different panel model specifications. Urban Studies, 53(11), 2312–2329. https://doi.org/10.1177/0042098015589883
- Paramati, S. R., & Roca, E.. (2019). Does tourism drive house prices in the OECD economies? Evidence from augmented mean group estimator. Tourism Management, 74, 392–395. http://doi.org/10.1016/j.tourman.2019.04.023
- Pérez-Molina, E. (2022). Exploring a multilevel approach with spatial effects to model housing price in San José, Costa Rica. Environment and Planning B: Urban Analytics and City Science, 49(3), 987–1004. https://doi.org/10.1177/23998083211041122
- Pope, J. C. (2008). Buyer information and the hedonic: The impact of a seller disclosure on the implicit price for airport noise. Journal of Urban Economics, 63(2), 98–516.
- Quigley, J. M. (1995). A simple hybrid model for estimating real estate price indexes. Journal of Housing Economics, 4(1), 1–12. https://doi.org/10.1006/jhec.1995.1001
- Rahmatian, M., & Cockerill, L. (2004). Airport noise and residential housing valuation in southern California: A hedonic pricing approach. International Journal of Environmental Science & Technology, 1(1), 17–25. https://doi.org/10.1007/BF03325812
- Rehm, M., & Filippova, O. (2008). The impact of geographically defined school zones on house prices in New Zealand. International Journal of Housing Markets and Analysis, 1(4), 313–336.
- Rosen, S. (1974). Hedonic prices and implicit markets: product differentiation in pure competition. Journal of Political Economy, 82(1), 34–55.
- Salvi, M. (2008). Spatial estimation of the impact of airport noise on residential housing prices. Swiss Journal of Economics and Statistics, 144(4), 577–606. https://doi.org/10.1007/BF03399267
- Schreurs, E., Verheijen, E., & Jabben, J. (2011). Valuing airport noise in the Netherlands. RIVM letter report 680555005.
- Shi, S., Jou, J.-B., & Tripe, D. (2014). Can interest rates really control house prices? Effectiveness and implications for macroprudential policy. Journal of Banking & Finance, 47, 15–28. https://doi.org/10.1016/j.jbankfin.2014.06.012
- Statistics New Zealand. (2020). NZ citizens migrating home in record numbers. https://www.stats.govt.nz/news/nz-citizens-migrating-home-in-record-numbers/.
- Stuff. (2020). Influx of returning New Zealanders due to Covid-19 ‘a myth’, says experts. https://www.stuff.co.nz/national/health/coronavirus/300121317/influx-of-returning-new-zealanders-due-to-covid19-a-myth-says-experts.
- Swoboda, A., Nega, T., & Timm, M. (2015). Hedonic analysis over time and space: The case of house prices and traffic noise. Journal of Regional Science, 55(4), 644–670. http://doi.org/10.1111/jors.2015.55.issue-4
- Theebe, M. A. (2004). Planes, trains, and automobiles: The impact of traffic noise on house prices. The Journal of Real Estate Finance and Economics, 28(2), 209–234. https://doi.org/10.1023/B:REAL.0000011154.92682.4b
- The New York Times. (2021). New Zealanders are flooding home. Will the old problems push them back out? The New York Times, https://www.nytimes.com/2021/05/24/world/asia/new-zealand-return-covid.html.
- Titman, S., Wang, K., & Yang, J. (2014). The dynamics of housing prices. Journal of Real Estate Research, 36(3), 283–318. https://doi.org/10.1080/10835547.2014.12091394
- Tomkins, J., Topham, N., Twomey, J., & Ward, R. (1998). Noise versus access: The impact of an airport in an urban property market. Urban Studies, 35(2), 243–258. https://doi.org/10.1080/0042098984961
- Tookey, J. E. (2017). The mess we’re In: Auckland’s housing bubble from a construction sector perspective. The Policy Observatory, Auckland University of Technology (AUT).
- Tourism Industry Aotearoa (TIA). (2019). Tourism 2025 and beyond: A sustainable growth framework. TIA.
- Tsao, H. C., & Lu, C. J. (2022). Assessing the impact of aviation noise on housing prices using new estimated noise value: The case of Taiwan Taoyuan international airport. Sustainability, 14(3), 1713. https://doi.org/10.3390/su14031713
- Tsui, K. W. H., Tan, D., Chow, C. K. W., & Shi, S. (2019). Regional airline capacity, tourism demand and housing prices: A case study of New Zealand. Transport Policy, 77, 8–22. https://doi.org/10.1016/j.tranpol.2019.02.007
- Tsui, W. H. K., Tan, D. T. W., & Shi, S. (2017). Impacts of airport traffic volumes on house prices of New Zealand’s major regions: A panel data approach. Urban Studies, 54(12), 2800–2817. https://doi.org/10.1177/0042098016660281
- Uyeno, D., Hamilton, S. W., & Biggs, A. J. G. (1993). Density of residential land use and the impact of airport noise. Journal of Transport Economics and Policy, 27(1), 3–18.
- Van Praag, Baarsma. (2005). Using happiness surveys to value intangibles: The case of airport noise. The Economic Journal, 115(500), 224–246.
- Wadley, D., Elliott, P., & Han, J. H. (2017). Modelling homeowners’ reactions to the placement of high voltage overhead transmission lines. International Planning Studies, 22(2), 114–127.
- Wardman, M., & Bristow, A. (2008). Valuations of aircraft noise: Experiments in stated preference. Environmental and Resource Economics, 39(4), 459–480. http://doi.org/10.1007/s10640-007-9136-1
- Wooldridge, J. M. (2016). Introductory econometrics: A modern approach (6th ed). Cengage Learning.
- Xiao, Y., Hui, E. C. M., & Wen, H. (2019). Effects of floor level and landscape proximity on housing price: A hedonic analysis in Hangzhou, China. Habitat International, 87, 11–26. https://doi.org/10.1016/j.habitatint.2019.03.008
- Yiu, C. Y. (2021). Why house prices increase in the COVID-19 recession: A five-country empirical study on the real interest rate hypothesis. Urban Science, 5(4), 77. https://doi.org/10.3390/urbansci5040077
- Yuen, M. K., Ngo, T., Le, T. D. Q., & Ho, T. H. (2022). The environment, social and governance (ESG) activities and profitability under COVID-19: Evidence from the global banking sector. Journal of Economics and Development, (Online first). https://doi.org/10.1108/JED-08-2022-0136
- Yun Joe Wong, T., Man Eddie Hui, C., & Seabrooke, W. (2003). The impact of interest rates upon housing prices: An empirical study of Hong Kong’s market. Property Management, 21(2), 153–170. https://doi.org/10.1108/02637470310478891
- Zhang, Y., & Tao, W. (2020). Will energy efficiency affect appliance price? An empirical analysis of refrigerators in China based on hedonic price model. Energy Policy, 147, 111818. http://doi.org/10.1016/j.enpol.2020.111818
- Zheng, X., Peng, W., & Hu, M. (2020). Airport noise and house prices: A quasi-experimental design study. Land Use Policy, 90, 104287. https://doi.org/10.1016/j.landusepol.2019.104287