
 ?Mathematical formulae have been encoded as MathML and are displayed in this HTML version using MathJax in order to improve their display. Uncheck the box to turn MathJax off. This feature requires Javascript. Click on a formula to zoom.
ABSTRACT
China has recorded impressive economic achievements driving the structural transformation of its society. However, this transformation is marked by rising inequality, environmental pollution and stark provincial disparities. In 2015, the launching of the Agenda 2030 provided a common ground at the international level conceptualizing the United Nations’ Sustainable Development Goals (SDGs). This paper analyses the provincial performances towards the Agenda 2030 in the period 2015–19 by introducing the integrated sustainable development index cluster; convergence and econometric analyses are then used to explore synergies and trade-offs among SDGs. The empirical results capture the dynamics of sustainable development of China’s provinces and provide a clearer understanding of how policies may influence different the SDGs’ achievements, exploring the relationship between environmental versus different aspects of development. These results are used to draw policy recommendations that highlight the importance of identifying the appropriate mix of strategies to promote integrated sustainable development.
1. INTRODUCTION
The 2030 Agenda and its 17 Sustainable Development Goals (SDGs) (United Nations, Citation2015) pose critical questions regarding the transition towards a more sustainable development. Many studies have aimed to measure sustainable development at global, regional, national and subnational levels (Allen et al., Citation2020; Benedek et al., Citation2021; Biggeri et al., Citation2019; Hametner & Kostetckaia, Citation2020; Sachs et al., Citation2022). Although their scope and methodologies differ, such studies have generally shown how the path towards sustainable development is characterized by diverging achievement between and within regions, countries and subnational areas, as well as across the various dimensions of sustainability. So far the literature mostly concentrates on country performances and policies.
The localization of the SDGs is a key element both in terms of strategies for the sustainability transition and analysis of the different subnational dynamics of sustainable development processes (United Cities and Local Governments (UCLG), Citation2022). Indeed, SDG localization is conceived as the process of transforming the SDGs into reality at the local level, in coherence with the national frameworks and in line with communities’ priorities.Footnote1 Therefore, localizing the SDGs means placing territories and communities at the centre of sustainable development, a two-way process where the local meets the national and the global, and vice versa (UN-Habitat, Citation2022).
In this context, China has gained considerable attention due to its impressive socio-economic achievements, which led to a rapid but unbalanced transformation. Monetary poverty has reduced dramatically (Rolf, Citation2021), but the overall progress has not always been harmonious or sustainable due to rising inequality, environmental pollution and strong provincial disparities (Biggeri & Bortolotti, Citation2020; Crane et al., Citation2018). In response, China’s policymakers, aware of internal economic and social imbalances, have for the past decade proposed political strategies oriented towards a more environmentally sustainable and balanced development and sought to enhance the country’s commitment to the 2030 Agenda for Sustainable Development by mobilizing resources at national and subnational levels (Xie et al., Citation2021).
According to the global 2020 SDG Index (Sachs et al., Citation2020), China ranks 48th out of 166 countries, with a score of 73.9. China performs particularly well for SDG 1 (No Poverty), SDG 4 (Quality Education) and SDG 8 (Decent Work and Economic Growth), while major challenges remain for SDG 10 (Reduced Inequalities) and SDG 14 (Life Below Water). Moreover, China records quite balanced scores across the different goals; for this reason, indexes that penalize heterogeneity across goals (via non-compensatory aggregation methods) assign an even higher positioning to China (Biggeri et al., Citation2019). At the national level, this result suggests a capacity of balancing different aspects of development, exploiting their synergies and reducing the trade-offs. Yet, the strong heterogeneity in the level and type of development experienced by China’s provinces (Hu et al., Citation2020) encourages further investigation about the interaction between different aspects of development and subnational policies.
This paper captures these dynamics by analysing provincial performance towards sustainable development. The integrated sustainable development (ISD) index is introduced to obtain a comparable measure of the achievements towards the Agenda 2030 at the subnational level (China’s provinces) that fully embraces the integrated nature of sustainable development and accounts for synergies and trade-offs across its components. The ISD index values are then used in cluster, convergence and econometric analyses to explore the characteristics of sustainable development at the provincial level between 2015 and 2019 and the related synergies and trade-offs.
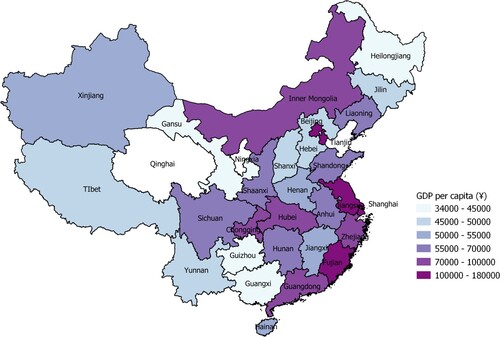
Our dataset is based on official statistics from the National Bureau of Statistics of China (NBS) and other official statistics. It consists of 71 selected variables measured at the provincial level, covering all 31 provinces of China between 2015 and 2019, that is, for the five years after the launching of the Agenda 2030. The term ‘province’ refers here to the provincial-level administrative divisions of China, including direct-controlled municipalities (Beijing, Tianjin, Shanghai and Chongqing, which are generally richer and more urban than surrounding provinces) and autonomous regions, but excluding the special administrative regions (Hong Kong and Macau) for data availability. indicates the 31 provinces of China and highlights the differences in income per capita in 2019; traditionally China is divided between the poorer inner area (west and central China) and the richer coastal area (south-east and north-east). Since the beginning of the new millennium, such income inequality has been tackled by the central government through specific policies such as the Go-West strategy (Biggeri & Bortolotti, Citation2020).
Figure 1. Income per capita in China’s provinces, 2019.
Source: Authors’ elaboration based on NBS (Citation2022).
The 71 selected variables are then grouped into the 17 unidimensional SDG domains so to obtain an index for each goal, and in one synthetic index of ISD. The analysis of these indexes allows us to capture the dynamics of China’s socio-economic and environmental transition, especially considering the trade-off between environmental and economic targets.
The selection of variables and SDG targets was informed by Sachs et al. (Citation2020), who offer a benchmark to understand the differences in development between China’s provinces, as well as a means to compare these with other countries.
The findings of this study are relevant for both researchers and policymakers. For scholars engaged in SDG analysis, our study offers a robust method for aggregating subnational SDG performances and comparing them across time and with other countries. For policymakers, it both provides a better understanding of how China’s existing policies may positively or negatively influence the achievement of various SDGs, and offers monitoring tools to shape policy at both national and provincial levels, in alignment with the 2030 Agenda vision for the betterment of humanity and its common future.
The remainder of the paper is structured as follows. Section 2 presents the background of China’s strategies and achievements in SDG implementation and localization. Section 3 describes the selection and sources of the indicators deployed to measure provincial SDG achievements. Section 4 introduces the method to aggregate the ISD index and the methodologies adopted to study it. Section 5 presents the national and provincial SDG performance results. Section 6 presents the characteristics of sustainable development at the provincial level between 2015 and 2019 using the results from cluster, convergence and econometric analyses. Section 7 discusses the main findings and draws conclusions on future challenges.
2. SDG IMPLEMENTATION AND LOCALIZATION IN CHINA
2.1. China’s strategy for SDG implementation and localization
Since 2005, China’s development strategies have increasingly embraced a broad notion of development, as reflected both in Hu Jintao’s Harmonious Society strategy and in Xi Jinping’s Chinese Dream project. China’s 13th Five-Year Plan (2016–20), adopted in March 2016, focused on five main principles – innovation, coordination, green economy, openness and inclusiveness – through an action package composed of a scientific and technological innovation plan, a poverty alleviation plan, a guideline on environmental improvement and other related plans. China’s 13th Five-Year Plan closely reflects the SDGs and provides the ‘theoretical guidance for China’s efforts to implement the 2030 Agenda and promote sustainable development’. In this regard, Xue et al. (Citation2018) carefully link each SDG to one or more chapters of the 13th Five-Year Plan and demonstrate the effectiveness of China’s adapting governance in addressing the Agenda 2030 from a policymaking perspective.
Later that same year, in September 2016, China’s National Plan on Implementation of the 2030 Agenda for Sustainable Development was officially adopted. It provided an analysis of the challenges and opportunities China faced in implementing the 2030 Agenda, and it outlined guiding thoughts, general principles and approaches for the implementation by translating each of the 169 SDG targets into action plans (Xie et al., Citation2021).
In March 2021, the adoption of the 14th Five-Year Plan indicates that China is maintaining a development strategy oriented toward environmental protection and shared prosperity. Indeed, the government has specified targets concerning the production and consumption of clean energy, the reduction of fossil energy consumption and carbon intensity and the engagement in climate-related global governance. Moreover, this is the first plan which does not mention gross domestic product (GDP) growth, consistently with the shift of priority toward non-monetary targets.
In other words, the Chinese government seems to have aligned and integrated its mid- and long-term development strategies and other sector-specific long-term plans with the 2030 Agenda. Moreover, the Chinese government instituted an inter-ministerial coordination mechanism between 45 government agencies, thus providing a strong institutional guarantee for implementation efforts. This initiative includes regularly conducted reviews and active participation in global follow-up processes through national voluntary reviews (VNRs). Despite local and regional governmentsFootnote2 do not directly participate either in the inter-ministerial coordination mechanism or in the VNR process due to a highly centralized political regime, according to UCLG (Citation2020) China ranks highly in the evaluation of how enabling the institutional environments are for local governments in terms of supporting sustainable development. This is particularly the case of urban integration and coordination between rural and urban areas and equitable and sustained city development strategy.
Such a relatively large degree of autonomy needs to be matched with local financial resources, which play a vital role in investments for sustainable development (Hu et al., Citation2020). Within this scenario, the implementation of the SDGs poses relevant governance challenges in terms of multilevel coordination.
Arguably, the most renowned initiative is the SDG Pilot Zone Initiative, whereby central government (i.e., the Ministry of Science and Technology) and local governments collaborate to develop local variations for policies, to promote innovation and to drive policy learning and change to achieve the SDGs. This initiative allows local governments to pass new legislation, explore institutional reform, pilot alternative public servant performance evaluation and restructure public expenditure in line with the SDGs (Association of Southeast Asian Nations (ASEAN) & United Nations Development Programme (UNDP), Citation2019), facilitating both vertical coordination between governance levels and horizontal coordination between different departments, as well as public participation (UCLG, Citation2020). This approach creates more room for bottom-up innovation, potentially leading to the adoption of successful cases nationwide, and replicates in the field of sustainable development the same trial-and-error approach that characterized the economic reforms undertaken since 1979 (Rolf, Citation2021).
2.2. Literature review
In the context of multilevel strategies and policies for SDG implementation, an increasing number of studies evaluate local-level sustainable development in China, as summarized in .
Table 1. Summary of studies measuring sustainable development in China at the local level.
Of the broad body of literature produced on urban sustainable development, initial analyses focused on measuring achievement in specific cities, highlighting significant spatial disparities within and between all three dimensions of sustainability, despite some scattered progress (Chen & Zhang, Citation2020, Citation2021; Ding et al., Citation2016; Zheng & Bedra, Citation2018). Most of these analyses do not draw a complete picture of sustainable local development in China (as they only cover specific areas), and do not directly refer to the SDG framework or to the international indices, hence not allowing for global comparison (Sachs et al., Citation2020).
Recent studies that measure China’s progress in sustainable development at the provincial level have emerged and provided a broader picture. Long and Ji (Citation2019) analyse the compatibility of economic growth with environmental and social sustainability by applying the genuine progress indicator to measure development across the 31 provinces in mainland China, on the basis of 24 sub-indicators, for the period 1997–2016. Their results show a strong divide between provinces with high economic growth but negative ecological costs and, conversely, provinces where low economic growth threatens social sustainability.
In a similar vein, Biggeri and Bortolotti (Citation2020) devise a harmonious multidimensional index based on 36 indicators of sustainable development and explore convergence across provinces between 1993 and 2016 from a multidimensional perspective. Although this index increased constantly over time, and a robust convergence trend was observed after the launch of the Harmonious Society strategy, the authors evidence the persistence of strong imbalances between coastal and inner provinces. Such imbalances are confirmed by Liao et al. (Citation2020), whose results are based on an evaluation system of 29 input and output indicators, weighted through the improved entropy coefficient method and collected for 30 provinces during the period 2012–18.
While these studies contribute significantly to the literature on sustainable local development at the provincial level in China, they have null (Long & Ji, Citation2019) or only partial (Biggeri & Bortolotti, Citation2020; Liao et al., Citation2020) explicit correspondence to the SDG framework, as many aspects included in the 17 SDGs and related targets are not mentioned in their analyses. Conversely, Wang et al. (Citation2020) and Xu et al. (Citation2020) make direct reference to all the goals by calculating a comprehensive SDG index.
More specifically, Xu et al. (Citation2020) collect 119 provincial performance indicators relevant to the SDGs for the period 2000–15. Despite a general improvement in the index for each province, their analysis shows large variations across regions, which favour eastern and southern provinces. Analogous results, in terms of spatial inequality, are also found by Wang et al. (Citation2020), whose SDG index was built based on 52 indicators for 2016. In line with Long and Ji (Citation2019), they demonstrate how eastern provinces are advantaged by higher economic sustainability, but to the detriment of environmental protection, while the attainment of many SDGs is hindered by slower economic growth in western provinces. However, both Wang et al. (Citation2020) and Xu et al. (Citation2020) provide results before or almost contemporaneous with the launch of the 2030 Agenda, which does not allow for the tracking of post-2015 achievements.
Outside China, other studies have looked at the distribution of the 17 SDGs within one country, as the Sustainable Development Reports of Benin (De la Mothe Karoubi et al., Citation2022), the United States (Lynch & Sachs, Citation2021), Paraguay (Fuller et al., Citation2021), Uruguay (Inter-American Development Bank (IDB) & Sustainable Development Solutions Network (SDSN), Citation2021), and the analysis of Italian regions (D’Adamo et al., Citation2021). However, these studies – just as in Wang et al. (Citation2020) and Xu et al. (Citation2020) – provide indexes that allow measuring inequalities within a single country but they are not suitable for comparison with processes outside the national borders.
This paper is intended to progress this debate. First, a new dataset that enables to capture the most recent (2015–19) performance and trends at China’s provincial level is built. Second, the scores for all the 17 SDGs and their underlying indicators are anchored to the values measured in the Sustainable Development Report by Sachs et al. (Citation2020), the most widely referred in the literature, thus allowing comparability with levels of sustainable development achieved in other countries and offering invaluable benchmarking. Third, the adopted methodology rejects the assumption of perfect substitutability among the SDGs, emphasizing the synergies and trade-offs among different aspects of sustainable development. Fourth, cluster, convergence and econometric analyses are performed to explore the characteristics of sustainable development in China’s provinces.
3. SELECTION OF DIMENSIONS AND DATA
The indicators selected to measure the provincial achievements towards each SDG are based on the official definitions of the goals and their targets, as well as on existing literature. The United Nations (UN) General Assembly produced and consistently updates a ‘global indicator framework’ that includes 231 different indicators, many of which are descriptive, and attributes each of them to a specific SDG target (United Nations, Citation2022). On the other hand, the 2020 Sustainable Development Report – SDR (Sachs et al., Citation2020) selects 85 equally important indicators that are strongly policy oriented to evaluate the efforts in place to reach the goals. Indeed, the SDR is based on the same aim of this research: measuring progression towards sustainable development.
However, neither of these two sources could portray the overall picture of sustainable development occurring at China’s provincial level. Indeed, many of these variables for theoretical or empirical reasons only apply at the national level – they are not collected at lower administrative divisions (Wang et al., Citation2020; Xu et al., Citation2020; Xue et al., Citation2018).
Therefore, the selection of indicators can be summarized in four steps:
We collected all the indicators listed by the UN and the SDR available for Chinese provinces.
We revised the indicators used by Wang et al. (Citation2020) and Xu et al. (Citation2020) to determine which of them could be used to cover aspects of sustainable development that were not identified otherwise.
We checked different China Statistical Yearbooks to identify provincial variables that could cover aspects of sustainable development that were not identified in previous steps.
We listed the previously unidentified aspects of sustainable development to acknowledge the limitations of our empirical analysis.
This process enables to monitor the complexity of sustainable development; there are few exceptions, since some targets do not apply at the provincial level and are therefore not represented in the ISD. Exceptions involve especially SDG 16 (Peace, Justice and Strong Institutions) and SDG 17 (Partnerships for the goals). As a result, we individuated a total of 71 indicators, all of which were equally weighted and considered only once following the SDR.
A total of 70 indicators were retrieved from the NBS website (NBS, Citation2022) and from other official statistical yearbooks or government ministries. The only unofficial indicator relates to imports per sector, as retrieved from the Observatory of Economic Complexity (OEC) (Citation2022).
All the data collected refer to the entire group of provinces. Not all the data, particularly those not collected by the NBS (Citation2022), were available for all the five years considered. In these cases, the data of the nearest year or the average between preceding and successive years were adopted. If the variable is available, no provincial information is missing; the only exception is some of the data relative to SDG 14, which refers to seas and oceans and cannot be applied to landlocked areas. We combined oceans’ indicators (available for coastal provinces only) with rivers’ indicators (available for all the 31 provinces). Table A1 in the Appendix in the online supplemental data lists the 71 indicators, the SDG targets connected to them, the source of the variables and the details on the missing data.
4. METHODOLOGY
4.1. Standardization, SDG targets and ISD aggregation
The provincial indicators were rescaled and aggregated to provide 17 synthetic measures that indicate the extent of each goal achievement (GA) and the ISD index of sustainable development. This process involved: (1) rescaling each variable for comparability purposes; (2) aggregating rescaled variables relative to the same goal into 17 GA scores; and (3) aggregating these 17 scores into a single index of provincial sustainable development.
In the existing literature, the rescaling of indicators is generally achieved through a min–max standardization that sets 0 equal to the minimum score recorded and 1 to the maximum score recorded. Intermediate values are linearly projected in the (0; 1) interval. Slight modifications of this technique can include minimums and/or maximums that are set theoretically or exclude outlier values. Among others, the human development index (HDI) computed by the UNDP and the SDR adopt this rescaling procedure. This method guarantees internal comparability, but problems may arise when comparing different samples: different individuals (or geographical units) and different years may exhibit different minimum and maximum values. The worst (best) performance recorded in a given place and time can be markedly different from the worst (best) performance observed in a different context.
Diverging from previous literature (Wang et al., Citation2020; Xu et al., Citation2020), the ISD index wants to be comparable with units not included in our sample. Therefore, we adopt a linear standardization that anchors the Chinese average for each of the 17 SDG scores to the SDR values, connecting therefore our GA and ISD indexes to the benchmark in the literature of international sustainable development. For these reasons, standardization proceeded following the formula:
(1)
(1) where
is the value recorded by province
and related to the variable
, and where
are the 17 goals.
is the weighted average value across provinces (i.e., the average of
attained across China); and
is the score given to China in the SDR to the goal
. The SDR scores describe (in percentage points) the degree of achievement of each goal per country ranging in [0;1].
are the 71 standardized values.
If assumes higher value for worse performance (e.g., in the case of pollutant emissions), the formula was adjusted as follows to guarantee that higher value corresponds to better performance:
(2)
(2) The
scores are aggregated to measure the achievements of each province in each goal. In the literature about multidimensional indicators, the arithmetic mean is the most common aggregation procedure for variables belonging to the same dimension
, while it is often rejected along with the perfect substitutability assumption when indicators from different dimensions are joined. As an example, the HDI adopts the arithmetic mean to aggregate different indicators of education but penalizes heterogeneity through the geometric mean when it aggregates different dimensions. A similar approach has been adopted in assessing the SDGs (Biggeri et al., Citation2019). At this stage, the aggregation involves variables related to the same dimensions, so the arithmetic mean was chosen as procedure, bounding such averages in the interval [0; 1]. This was achieved by adopting the simple formula:
(3)
(3) where
is the number of indicators, and
relates to the goal
.
The final step, the aggregation of the scores into an ISD score, involves a formative synthesis; therefore, we reject the assumption of perfect substitutability, consistently with the literature on non-compensatory indicators (Klugman et al., Citation2011; Mauro et al., Citation2018). Among the variety of non-compensatory aggregation procedures, we adopt the multidimensional synthesis of indicators (MSI), whose characteristics precisely match the case of sustainable development indicators (Biggeri et al., Citation2019). This procedure rejects both the hypothesis of perfect substitutability and the assumption of a fixed degree of substitutability. Indeed, the MSI assumes a degree of substitutability that depends on the average score: provinces with better performance have higher substitutability, while at lower levels of development, the heterogeneity across scores is more heavily penalized. The MSI technique aggregates the 17 scores of each province into a synthetic indicator according to the following formula:
(4)
(4) where
is the average of the 17 GA computed in province
. The formula in equation (4) (MSI) corresponds to a non-compensatory aggregation method; it operates when
is included in [0; 1], which is guaranteed by equation (3). The resulting integrated sustainable development (
) index is a number bounded in [0; 1] where 0 corresponds to a score equal to 0 in all the goals, and 1 corresponds to a score equal to 1 in all the goals.
grows granularly for higher values of
and when the values
are homogeneous across the 17 goals.
4.2. Methodologies for convergence, cluster and econometric analyses
GA and ISD can be considered interest variables for the understanding of subnational development, so they can substitute the monetary measures of development traditionally investigated by economists. Among the methodologies deployed, we use convergence, cluster and econometric analyses.
Convergence analysis intends depicting whether different units will eventually reach a uniform level of achievement (convergence) or rather the inequalities will be maintained or deepened (divergence) in the future. Convergence can be measured through β-convergence and σ-convergence. β-convergence corresponds to an estimated negative relationship between the growth in the interest variable and its level at the beginning of the series (Barro & Sala-i-Martin, Citation1992). σ-convergence corresponds to the decrease over time in the dispersion of the interest variable recorded in the different units (Quah, Citation1993). The latter prevents a consideration of convergence in the cases where an initially backward unit overtakes and outdistances the others. The fact that our variables are bounded in [0; 1] implies that, if there is growth, in the long run all units will reach the same level, 1. Yet, β-convergence tells if in the short run provinces are approaching this outcome.
Clustering is a technique to associate units who share similar characteristics according to a vector of variables and can be computed through various techniques. The k-means clustering is one of the most widespread algorithms that divide a sample in data-driven clusters. For example, it has been used by He et al. (Citation2022) to cluster China’s provinces according to environmental, economic and energetic factors.
Finally, the panel structure of our dataset allows to run fixed- and random-effect regression to investigate the associations between indexes. Considering that most of the interest variables that provinces exhibit are already included in the ISD index, we use econometric analysis to observe how, ceteris paribus, GA are associated between themselves, focusing in particular on the goals related to the Planet sphere, in order to observe the trade-offs and the synergies that characterize the environmental development of China’s provinces. As usual, an F-test is performed to verify the need of panel estimators versus pooled ordinary least squares (OLS), then the Hausman test is adopted to choose between random- (null hypothesis, the unique errors are not correlated with the regressors) and fixed-effects (alternative hypothesis). This test indicates random-effects as more appropriate, so that:
(5)
(5) where
is the environmental GA of province
at year
,
is a vector containing the achievements in the eleven non-environmental goals,
is a provincial effect assumed to be not correlated with the explanatory variables in the random-effect model, and
is the error term.
5. PROVINCIAL SUSTAINABLE MULTIDIMENSIONAL PERFORMANCES
5.1. Sustainable development in China
Measuring sustainable development at the national level constitutes the background for an analysis differentiated in Chinese provinces. In the 2020 SDR, China scored an average level of SDG achievement equal to 0.74 (a ranking of 48th of 166 countries), placing it just below Ukraine. According to the ISD index, which penalizes the heterogeneity of the goals, China scores 0.72, ranking it 40th: the homogeneity in achieving all the goals allows China to be less penalized with respect to most of the other countries. The average (not weighted) score of all 166 countries is 0.67 for the arithmetic mean and 0.62 for the MSI aggregation. This means China performed among the top countries, especially applying a non-compensatory aggregation method. Moreover, China’s scores and rankings improved over time.
In 2016, China’s average score was 0.67, and the MSI aggregation was 0.65, ranking it 72nd and 69th, respectively, out of 158 countries. China’s best performance is in SDG 1, while its worst performance is in SDG 17. Concerning the five Planet goals, especially SDG 14 (Life Below Water) and SDG 15 (Life on Land), China fell to the lowest part of the world ranking, despite recording yearly improvements. At the provincial level, the highest performances are usually found in eastern regions while wealthier coastal provinces have sacrificed much of their environmental endowments, although a convergence is observed over time.
5.2. Sustainable development in China’s provinces
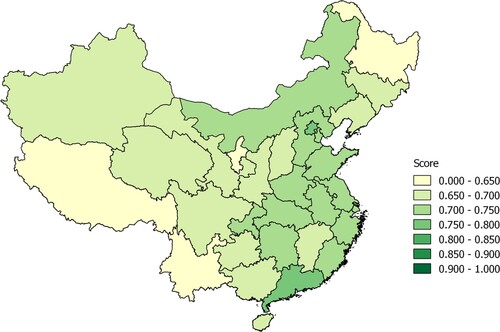
The Chinese ISD score (0.72 in 2019) is not homogeneous across the country. reports provincial ranking and scores according to the ISD (calculated using the MSI) and according to the arithmetic mean, and the difference in the two scores (denoting the level of heterogeneity in the outcomes). The Environmental GAs in 2019 and ISD in 2015 are also reported.
Table 2. Provincial integrated sustainable development (ISD) index scores.
shows the distribution of scores across the country and recalls the traditional economic divide () between wealthy coastal provinces and more disadvantaged central and western provinces (Biggeri & Bortolotti, Citation2020; Crane et al., Citation2018). The north-east of the country also exhibits poor scores. The east–west disparity is rooted in China’s history, but escalated after 1978 reforms, which favoured the coastal, trade-oriented provinces. The relative decline of the north-east is also related to economic reforms, which drove the core of economic activity away from state-owned, heavy industry enterprises (the backbone of the economy in this area).
Figure 2. Integrated sustainable development (ISD) index in China’s provinces, 2019.
Source: Authors’ elaboration based on ISD data, represented with geographical information system (GIS) software.
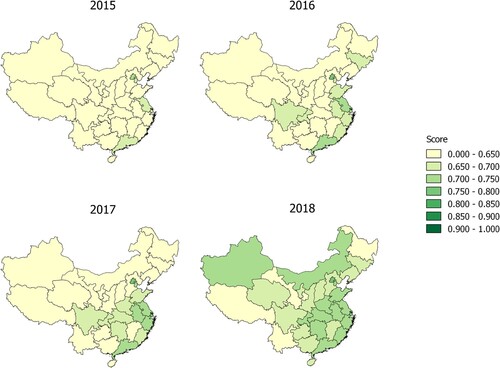
can be compared with , which shows the provincial ISD Index scores between 2015 and 2018. It emerges that the biggest improvement occurred between 2015 and 2018, while between 2018 and 2019 only marginal changes occurred.
Figure 3. Integrated sustainable development (ISD) index in China’s provinces, 2015–18.
Source: Authors’ elaboration based on ISD data, represented with geographical information system (GIS) software.
Tibet stands out as an underperforming province because of a low level and high heterogeneity in GA. In 2019, with , its development was comparable with that of Guatemala (ranked 109th of 166 countries). Tibet, as overall China, achieved rapid growth and good results in fields such as SDG 1 (No Poverty) and SDG 12 (Responsible Consumption and Production), but also in Planet goals such as SDG 15 (Life on Land). On the contrary, Tibet has performed poorly in relation to SDG 6 (Clean Water and Sanitation) and SDG 16 (Peace, Justice and Strong Institutions). Other western provinces also performed poorly (e.g., Yunnan and Ningxia), but in 2019 the second-worst performing province in terms of ISD was Heilongjiang, in the north-east (
). Heilongjiang is the only province to record a drop in development levels for two consecutive years (2018 and 2019).
Beijing, on the contrary, maintains first place in provincial sustainable development rankings since 2015. In 2019, it achieved (21st in the world ranking, slightly higher than Chile and Italy). It fully achieved the following five goals: SDG 1 (No Poverty), SDG 8 (Decent Work and Economic Growth), SDG 9 (Industry, Innovation and Infrastructure), SDG 13 (Climate Action) and SDG 14 (Life Below Water); however, it performed poorly in SDG 15 (Life on Land). Other provinces that show higher-than-average levels of sustainable development are the remaining direct-controlled municipalities (Chongqing, Tianjin and Shanghai), as well as some coastal, export-oriented provinces (e.g., Guangdong and Jiangsu).
By focusing on the GA, it appears that the relative distribution of SDG scores varies largely across provinces. Some of the goals reflect the distribution of . For example, SDG 9 (Industry, Innovation and Infrastructure) is the most emblematic of the overall differences in provincial development. Some extremely innovative provinces can be found along the coast (Beijing, Jiangsu, Shanghai, Zhejiang or Guangdong), but the situation is more backward in central China and, especially, in eastern and north-eastern provinces (see SDG 17 in ). Other goals follow different or even opposite patterns. Such is the case for SDG 15 (Life on Land), which was best achieved in some inner provinces, while the whole coastal area scores lowest.
Figure 4. Sustainable Development Goal (SDG) scores for China’s provinces, 2019.
Source: Authors’ elaboration based on integrated sustainable development (ISD) index data, represented with geographical information system (GIS) software.
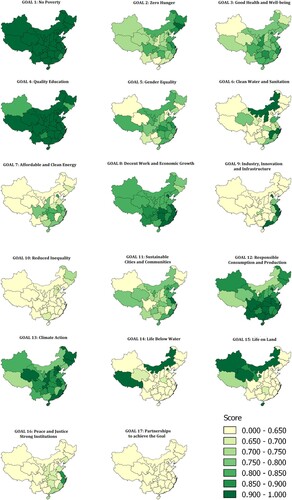
The different dynamics of the goals can also be interpreted by analysing their correlation coefficients (see Table A2 in the Appendix in the online supplemental data). For example, SDG 9 (Industry, Innovation and Infrastructure) not only is the goal showing the highest correlation with (0.73 in 2019) but also exhibits synergies with SDG 8 (Decent Work and Economic Growth), SDG 7 (Affordable and Clean Energy) and SDG 11 (Sustainable Cities and Communities). On the other hand, China’s provinces generally exhibit trade-offs between SDG 15 (Life on Land) and most of the other goals.
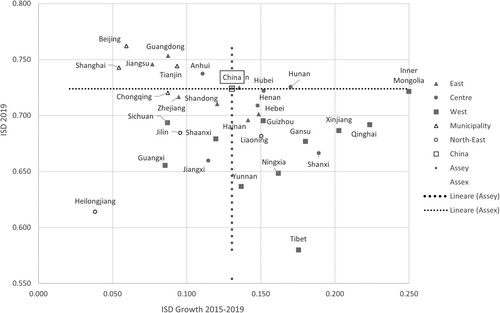
illustrates the 2019 level of ISD (vertical axis) and the increase since 2015 (vertical axis) of each province. The performance of overall China divides the graphic in four parts:
In the top-left area there are provinces that are relatively more developed but whose growth is weaker, as most of the direct-controlled municipalities.
The top-right area is almost empty: no province records contemporary high ISD and high growth.
In the bottom-right area there are provinces which grew the most: they are mostly western provinces, as Qinghai (+0.22) and Xingjian (+0.20), which inherited economic and social gap which is not yet closed.
Provinces in the bottom-left area (e.g., Heilongjiang) not only are less developed than the average, but their poor growth indicates they are excluded from the converging trend.
Figure 5. Integrated sustainable development (ISD) index and its growth in China’s provinces, 2019.
Source: Authors’ elaboration based on ISD data.
6. CHARACTERISTICS, SYNERGIES, TRADE-OFFS AND DYNAMICS OF PROVINCIAL SUSTAINABLE DEVELOPMENT
6.1. Cluster analysis
presents the six clusters formed in 2019: we note how Heilongjiang stands alone, distinguished by lower scores. Tibet is grouped to the other poorer eastern provinces. The third group contains other poor inner provinces, while the fourth group contains three northern provinces that are traditionally considered poor (in monetary terms) but exhibit some of the highest performances in environmental goals, boosting their ISD score. The last two groups are mainly comprised of coastal provinces, with the direct-controlled municipalities (Shanghai, Beijing, Tianjin and Chongqing) separated from the top-performing group (the sixth), which includes larger, economically advanced provinces.
Table 3. Clusters, 2019.
6.2. Convergence analysis
All the provinces record a positive change with improvements that were stronger for less developed provinces. combines the provincial ISD level in 2015 (horizontal axis) with the improvements achieved between 2015 and 2019 (vertical axis). It shows β-convergence among provinces, because of a significant and negative correlation between the starting point and growth in terms of ISD.
Figure 6. Integrated sustainable development (ISD) index convergence.
Source: Authors’ elaboration based on ISD data.
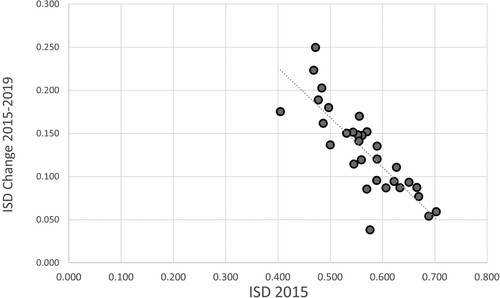
Convergence emerges also from the decreasing trend in the dispersion of provinces over the five years (σ-convergence): the standard deviation σ decreases from 7.03% to 4.08% between 2015 and 2019. After observing the standard deviation across provinces, we can also look at the standard deviation across GA (). This variable expresses the ability of each province to balance its development between different goals. While overall China has a low
, this ability is not evidenced at the provincial level: the average
across provinces is 0.19, similar to the standard deviation between world countries’ scores. In other words, China’s balanced performance hinders a variety of provincial development patterns that are internally unbalanced but compensate each other. However, just as there is convergence across provinces, there is also convergence across the goals, as the most deprived goals improve faster and
decreases between 2015 and 2019.
6.3. A panel analysis on the interactions between the SDGs and environmental progress
A better understanding of the relationship between environmental goals and the remaining SDGs is explored creating an Environmental GAs index based only on the Planet goals. This variable is built in three alternative ways, leading to similar results, so as to check the robustness of our results. The first specification contains the six Planet goalsFootnote3 aggregated via the MSI (), similarly to how the ISD is built; the second specification contains the same goals aggregated via a simple arithmetic mean (
); the third specification contains a MSI aggregation of five goals (
), excluding SDG 14 to avoid combining coastal and landlocked provinces. An alternative model includes a dichotomic variable (‘east’) to distinguish eastern provinces, which traditionally behave differently from the remainder of China because of their more advanced economic conditions. However, the variable ‘east’ is not statistically correlated with the environmental goals, remarking another difference between economic development and environmental sustainability. The Hausman tests do not allow to reject the null hypothesis, so we use the random-effect model in all the specifications. The results are reported in .
Table 4. Relationship between environmental goals and the other Sustainable Development Goals (SDGs) (random-effect model).
Environmental sustainability development appears synergically related to the achievement of other goals, such as SDG 1 and SDG 9–11. In other words, the fight against poverty, the implementation of innovative and environmentally friendly infrastructure and industry, the fight against inequality, and the building of sustainable cities and communities all favour the achievements of a green development. Conversely, the coefficient for SDG 8, linked to GDP growth, turns out to be not statistically significant.
7. DISCUSSION AND CONCLUSIONS
This paper explored China’s provinces progress towards achieving the SDGs in order to shed light on existing local imbalances and trade-offs between goals and, thus, between environmental versus other aspects of economic and social development.
At a general level beyond the Chinese provincial case, the results fit with cutting-edge perspectives in the global debate on SDG localization, contributing to raise conceptual, theoretical and empirical implications for our understanding of SDG attainment at the local level across the world. Indeed, the real-world experiences on SDG localization are reaching a mature stage, being implemented and experienced in several countries across the world under different contextual conditions and factors (UCLG, Citation2022). In China, as in many other countries, the common framework to bring different governance levels and stakeholders together provided by the 2030 Agenda translates into growing policy commitment, tailored institutional frameworks, and enhanced alignment of national and subnational plans with the SDGs (UN-Habitat, Citation2022). Therefore, policy practices are increasingly embracing the synergies and trade-offs among SDGs through an integrated ‘whole-of-government’ approach (Bianchi et al., Citation2021), notwithstanding the need for local, subnational and national governments to rely on further conceptualization, evidence, and guidance to shape effective governance systems and strategies to implement the SDGs.
At a more specific level, the findings of our analysis can be summarized in four points, then raising some main policy recommendations for China.
First, the composite ISD index shows significant and constant progress at the national level between 2015 and 2019, with scores higher than the world average. This suggests that China, on the whole, has followed a well-integrated pattern of sustainable development across the different goals, which is confirmed by the fact that China’s position in the global ranking turns out to be one of the most sensitive when non-compensatory multidimensional indicators of sustainable development are employed. For example, in 2019, China ranked 40th out of 166 countries when achievements were calculated in an integrated way, but it ranked 48th when the goal scores were aggregated through the simple arithmetic mean. Nevertheless, some relevant imbalances persist. On the one hand, China’s economic and social achievements are particularly remarkable and well exemplified by its fight against poverty. On the other hand, China underperforms in respect to global averages in terms of environmental sustainability. This confirms that, at least initially, China’s reforms were disproportionately biased in favour of Prosperity, to the detriment of Planet-related goals.
Second, the picture radically changes when analysis is detailed at the subnational level, where significant provincial differences are found in the level, pace and cross-goal integration of sustainable development. As expected, the spatial difference of the ISD scores points to a divide between the more advanced coastal provinces and their underdeveloped inner provincial counterparts. In fact, some of the wealthiest provinces have scores similar to the most developed countries, with Beijing ranking 20th just below Canada and Portugal and above Italy, Austria and the United States.Footnote4 However, provinces as Tibet and Heilongjiang still appear in the bottom half of country rankings in terms of ISD, revealing the marked economic imbalances that emerged in China’s development strategy. Indeed, despite government efforts to promote development in western China, as exemplified by the Go-West strategy and the Silk Road Economic Belt, this area remains economically and socially disadvantaged (Hu et al., Citation2020), while the north-east shows signs of regression and weaker levels of development. These differences drove the identification of six clusters of provinces, where the top performing group is mainly represented by larger, economically advanced provinces. How long such imbalances will continue to exist depends largely on the pace of provincial convergence towards an analogous level of ISD. In this context, while the analysis highlights how underdeveloped provinces are evolving faster than advanced ones, it seems that such convergence is still too slight to expect a rapid resolution of disparities.
Third, this analysis enabled us to identify strong imbalances that exist at the subnational levels across all the different goals. China’s capacity to synergically promote different dimensions of sustainable development does not emerge at the grassroots level – where provinces experience different degrees of SDG success or failure – and seems to be based on subnational reciprocal compensations of gaps and achievements.
Fourth, such place-based strategies should focus on addressing specific existing trade-offs behind the missed integration of the SDGs. For example, the SDG 15 (Life on Land in the Planet domain) exhibits a large trade-off with several Prosperity goals. This suggests that China’s provinces have not yet achieved synergy between economic development and environmental sustainability. In this regard, interesting results emerged from the econometric analysis on the provincial environmental progress, which showed a synergic relationship between the composite index for environmental sustainable development and other relevant goals (such as the fight against poverty and inequality, the implementation of innovative and green infrastructure and industry, and the building of sustainable cities and communities). SDG 8, which is the most directly connected to provincial GDP growth, seems to have no significant relation with environmental progress, implying the fact that it has neither positive or negative effects in the transition. One hypothesis is that GDP growth with the actual production system generates environmental negative results on one side while, on the other side, it induces higher taxes and then better public expenditure potential for financing the green transition. These hypotheses need to be tested by future research.
In light of such findings, two main related policy implications for China’s sustainable development emerge. First, in order to prevent some provinces from remaining trapped in low-to-middle levels of sustainable development, with only a few being able to take-off, it seems necessary to avoid a one-size-fits-all approach on policy for sustainable development, in favour of maintaining and encouraging place-based strategies. Second, Chinese policymakers should devote efforts to combine economic, environmental and social policies for integrated sustainable development in a ‘whole-of-government’ approach, by focusing on the most synergistic SDGs and by promoting synergic development at the grassroots level through coordination of location-specific policies. Taking these two policy implications together, the main challenge for underdeveloped provinces is to maintain their improvements in socio-economic development avoiding high environmental costs and inequalities. Conversely, economically advanced provinces should devise policies to invest in environmentally friendly activities, without jeopardizing progress made in terms of living standards. All these points are even more important considering that China’s pace of sustainable development may have decelerated, as the 2022 SDR seems to suggest.
Such challenges emphasize also implication for future research to, crucially, study the economic, social, political and institutional causes for the imbalanced path of sustainable development adopted by the most economically advanced provinces, and to understand how to solve trade-offs and multiply synergies in all Chinese provinces. Such understanding may prevent underdeveloped provinces from traversing the same (un)integrated path.
Furthermore, the methodology adopted in this study allowed us to compare the provincial evolution of ISD with the rest of the world, acknowledging that, especially in emerging economies, the indicators of sustainable development may largely differ at the subnational level. It also highlighted how, to some extent, some Chinese provinces present challenges that are more akin to those faced by other developed countries than their respective Chinese counterparts. Such comparison opens the door for individuating recurrent paths of development across countries and corresponding subregions, in order to identify global common subnational strategies differentiated on the basis of the trade-offs and synergies currently at play.
Supplemental Material
Download MS Word (347.5 KB)DISCLOSURE STATEMENT
No potential conflict of interest was reported by the authors.
Notes
1 It is widely acknowledged that 65% of SDG targets cannot be reached without proper engagement and coordination with local and regional governments (Organisation for Economic Co-operation and Development (OECD), Citation2022).
2 Mainland China has three tiers of subnational government: 2851 local governments at the municipal level (counties), 333 at the intermediary level (prefectures) and 31 at the regional level (provinces) (UCLG, Citation2022).
3 These are: SDGs 6, 7 and 12–15.
4 Two other provinces, Guangdong and Tianjin, would overcome the United States.
REFERENCES
- Allen, C., Reid, M., Thwaites, J., Glover, R., & Kestin, T. (2020). Assessing national progress and priorities for the sustainable development goals (SDGs): experience from Australia. Sustainability Science, 15(2), 521–538. https://doi.org/10.1007/s11625-019-00711-x
- Association of Southeast Asian Nations (ASEAN) & United Nations Development Programme (UNDP). (2019). SDG localization in ASEA: Experiences in shaping policy and implementation pathways. UNDP.
- Barro, R. J., & Sala-i-Martin, X. (1992). Convergence. Journal of Political Economy, 100(2), 223–251. https://doi.org/10.1086/261816
- Benedek, J., Kinga, I., Török, I., Temerdek, A., & Holobâcă, I. H. (2021). Indicator-based assessment of local and regional progress toward the sustainable development goals (SDGs): An integrated approach from Romania. Sustainable Development, 1–16. https://doi.org/10.1002/sd.2180
- Bianchi, P., Biggeri, M., & Ferrannini, A. (2021). The political economy of places in a sustainable human development perspective: The case of Emilia-Romagna. Cambridge Journal of Regions, Economy and Society, 14(1), 93–116. https://doi.org/10.1093/cjres/rsaa037
- Biggeri, M., & Bortolotti, L. (2020). Towards a ‘harmonious society’? Multidimensional development and the convergence of Chinese provinces. Regional Studies, 54(12), 1655–1667. https://doi.org/10.1080/00343404.2020.1746759
- Biggeri, M., Clark, D. A., Ferrannini, A., & Mauro, V. (2019). Tracking the SDGs in an ‘integrated’ manner: A proposal for a new index to capture synergies and trade-offs between and within goals. World Development, 122, 628–647. https://doi.org/10.1016/j.worlddev.2019.05.022
- Chen, Y., & Zhang, D. (2020). Evaluation of city sustainability using multi-criteria decision-making considering interaction among criteria in Liaoning province China. Sustainable Cities and Society, 59, 102211. https://doi.org/10.1016/j.scs.2020.102211
- Chen, Y., & Zhang, D. (2021). Evaluation and driving factors of city sustainability in Northeast China: An analysis based on interaction among multiple indicators. Sustainable Cities and Society, 67, 102721. https://doi.org/10.1016/j.scs.2021.102721
- Crane, B., Albrecht, C., Duffin, K. M., & Albrecht, C. (2018). China’s special economic zones: An analysis of policy to reduce regional disparities. Regional Studies, Regional Science, 5(1), 98–107. https://doi.org/10.1080/21681376.2018.1430612
- D’Adamo, I., Gastaldi, M., Imbriani, C., & Morone, P. (2021). Assessing regional performance for the sustainable development goals in Italy. Scientific Reports, 11(1), 1–10. https://doi.org/10.1038/s41598-020-79139-8
- De la Mothe Karoubi, E., Toure, S., Lafortune, G., & Fuller, G. (2022). Rapport sur le Développement Durable pour le Bénin 2022.
- Ding, L., Shao, Z., Zhang, H., Xu, C., & Wu, D. (2016). A comprehensive evaluation of urban sustainable development in China based on the TOPSIS-entropy method. Sustainability, 8(8), 746. https://doi.org/10.3390/su8080746
- Fuller, G., Rodríguez Heredia, M., Camperi, G., & McCord, G. (2021). Informe de Desarrollo Sostenible para Paraguay 2021. Sustainable Development Solutions Network.
- Hametner, M., & Kostetckaia, M. (2020). Frontrunners and laggards: How fast are the EU member states progressing towards the sustainable development goals? Ecological Economics, 177, 106775. https://doi.org/10.1016/j.ecolecon.2020.106775
- He, Y., Xing, Y., Zeng, X., Ji, Y., Hou, H., Zhang, Y., & Zhu, Z. (2022). Factors influencing carbon emissions from China’s electricity industry: Analysis using the combination of LMDI and K-means clustering. Environmental Impact Assessment Review, 93, 106724. https://doi.org/10.1016/j.eiar.2021.106724
- Hu, S., Zeng, G., Zhuang, L., & Liu, H. (2020). Towards more dispersion: The geographical evolution of China’s development zones. Regional Studies, Regional Science, 7(1), 495–498. https://doi.org/10.1080/21681376.2020.1831948
- Inter-American Development Bank (IDB) & Sustainable Development Solutions Network (SDSN). (2021). Uruguay sustainable development report 2021. IDB & SDSN.
- Klugman, J., Rodríguez, F., & Choi, H. J. (2011). The HDI 2010: New controversies, old critiques. The Journal of Economic Inequality, 9(2), 249–288. https://doi.org/10.1007/s10888-011-9178-z
- Liao, Y., Ma, Y., Chen, J., & Liu, R. (2020). Evaluation of the level of sustainable development of provinces in China from 2012 to 2018: A study based on the improved entropy coefficient-TOPSIS method. Sustainability, 12(7), 2712. https://doi.org/10.3390/su12072712
- Long, X., & Ji, X. (2019). Economic growth quality, environmental sustainability, and social welfare in China – provincial assessment based on genuine progress indicator (GPI). Ecological Economics, 159, 157–176. https://doi.org/10.1016/j.ecolecon.2019.01.002
- Lu, C., Xue, B., Lu, C., Wang, T., Jiang, L., Zhang, Z., & Ren, W. (2016). Sustainability investigation of resource-based cities in northeastern China. Sustainability, 8(10), 1058. http://doi.org/10.3390/su8101058
- Lynch, A., & Sachs, J. (2021). The United States sustainable development report 2021. New York: SDSN.
- Mauro, V., Biggeri, M., & Maggino, F. (2018). Measuring and monitoring poverty and well-being: A new approach for the synthesis of multidimensionality. Social Indicators Research, 135(1), 75–89. https://doi.org/10.1007/s11205-016-1484-1
- National Bureau of Statistics of China (NBS). (2022). National Data. Available at: (Last Accessed: https://data.stats.gov.cn/english/easyquery.htm?cn=E0103 13th September 2022).
- Observatory of Economic Complexity (OEC). (2022). Historical Data. Available at: https://oec.world/en (Last Accessed: 15th May 2022).
- Organisation for Economic Co-operation and Development (OECD). (2022). OECD toolkit for a territorial approach to the SDGs. OECD Publ.
- Quah, D. (1993). Galton's fallacy and tests of the convergence hypothesis. The Scandinavian Journal of Economics, 427–443. https://doi.org/10.2307/3440905
- Rolf, S. (2021). China’s uneven and combined development. Springer International Publishing.
- Sachs, J., Lafortune, G., Kroll, C., Fuller, G., & Woelm, F. (2022). Sustainable development report 2022 – From crisis to sustainable development: The SDGs as roadmap to 2030 and beyond. Cambridge University Pres.
- Sachs, J., Schmidt-Traub, G., Kroll, C., Lafortune, G., Fuller, G., & Woelm, F. (2020). The sustainable development goals and COVID-19. Sustainable development report 2020. Cambridge University Press. (2020 and previous years).
- UN-Habitat. (2022). Accelerating progress towards the localization of the SDGs and post-pandemic recovery through enhanced multilevel governance. United Nations Human Settlements Programme.
- United Cities and Local Governments (UCLG). (2020). The localization of the global agendas: How local action is transforming territories and communities – Asia–Pacific region. UCLG.
- United Cities and Local Governments (UCLG). (2022). Towards the localization of the SDGs: Local and regional governments breaking through for a sustainable and just recovery – Local and Regional Governments’ Report to the 2022 HLPF. UCLG.
- United Cities and Local Governments (UCLG). (2022). Country profiles on SDG localization – Local and regional governments stepping forward for achieving the 2030 agenda. UCLG.
- United Nations. (2015). Transforming our world: The 2030 agenda for sustainable development, Resolution adopted by the General Assembly (A/RES/70/1), 25 September.
- United Nations. (2022). Global indicator framework for the sustainable development goals and targets of the 2030 agenda for sustainable development, decision (53/101) by the 53rd United Nations Statistical Commission (E/2022/24-E/CN.3/2022/41), 18 March.
- Wang, Y., Lu, Y., He, G., Wang, C., Yuan, J., & Cao, X. (2020). Spatial variability of sustainable development goals in China: A provincial level evaluation. Environmental Development, 35, 100483. https://doi.org/10.1016/j.envdev.2019.100483
- Xie, H., Wen, J., & Choi, Y. (2021). How the SDGs are implemented in China – A comparative study based on the perspective of policy instruments. Journal of Cleaner Production, 291, 125937. https://doi.org/10.1016/j.jclepro.2021.125937
- Xu, Z., Chau, S. N., Chen, X., Zhang, J., Li, Y., Dietz, T., Wang, J., Winkler, J. A., Fan, F., Huang, B., & Li, S. (2020). Assessing progress towards sustainable development over space and time. Nature, 577(7788), 74–78. https://doi.org/10.1038/s41586-019-1846-3
- Xue, L., Weng, L., & Yu, H. (2018). Addressing policy challenges in implementing sustainable development goals through an adaptive governance approach: A view from transitional China. Sustainable Development, 26(2), 150–158. https://doi.org/10.1002/sd.1726
- Yang, B., Xu, T., & Shi, L. (2017). Analysis on sustainable urban development levels and trends in China's cities. Journal of Cleaner Production, 141, 868–880. http://doi.org/10.1016/j.jclepro.2016.09.121
- Zheng, B., & Bedra, K. B. (2018). Recent sustainability performance in China: Strength–weakness analysis and ranking of provincial cities. Sustainability, 10(9), 3063. https://doi.org/10.3390/su10093063