
 ?Mathematical formulae have been encoded as MathML and are displayed in this HTML version using MathJax in order to improve their display. Uncheck the box to turn MathJax off. This feature requires Javascript. Click on a formula to zoom.
ABSTRACT
In this article, we discuss the role of second-tier cities in the socio-economic and innovative development of countries. A methodological approach is proposed for carrying out a comparative analysis of the contribution of second-tier and capital cities in the national settlement systems of Europe and Russia. The proposed approach was tested by analysing the contribution of second-tier cities to the demographic development of several countries. In European countries, a more homogeneous distribution of the population between capitals and second-tier cities was observed. This finding indicates a higher competitiveness of European cities in comparison, for example, with Russian cities in terms of human capital attraction and retention. In Russia, the national settlement system traditionally pivots around Moscow and St. Petersburg. On the other hand, the population dynamics of second cities in Eastern Europe is negative for most countries, thereby indicating a migration outflow of their inhabitants toward national capitals. The conducted comparison of the key economic indicators (GDP and GDP per capita) of urbanized areas in all analysed countries showed second-tier cities to be less competitive than national capitals. In this respect, European cities seem to be more successful on a national scale compared to Russian cities with a population of over one million people. The contribution of second-tier cities to innovative development is higher in Western European countries, compared to Eastern Europe, where the innovation potential is largely concentrated in capitals. In terms of this indicator, Russia occupies an intermediate position.
1. INTRODUCTION
Modern trends in the development of settlement systems are related to significant changes in the role of cities in both the national and worldwide social, economic, and spatial context. Present-day cities are habitats for more than 55% of the world’s population and are production centres accounting for more than 80% of the world GDP (The World Bank, Citation2019). Cities are hosting scientific and technological progress, as well as cultural, political and social processes. Saskia Sassen (Citation1991) was one of the first researchers to demonstrate that primate (global) cities can become more powerful than countries, when reaching a certain developmental stage. John Friedman (Citation2002), Peter Hall (Citation2006), and Rossman (Citation2013) formulated important clarifications regarding the typology of global cities and their role in the worldwide, European, and national economic space. At the same time, globalization and information system development have a considerable impact not only on the status of global, but also second-tier (second) cities, which are home to a significant number of people (World Bank, Citation2009; UN, Citation2014; Roberts, Citation2014). Such urban entities perform important economic and social functions on the national scale, frequently functioning as regional administrative centres providing public services. Second cities are striving to become integrated into the system of global economic relations (Marais et al., Citation2016; Rodríguez-Pose & Fitjar, Citation2013).
Second-tier cities play a particular role in post-socialist and developing countries. Joining the system of international economic relations, they create prerequisites for the transfer of technological innovations, best practices of social management, and incentives for civil initiatives on the city level as well as on the corresponding macro-regional level (Rondinelli, Citation2001; Bolay & Rabinovich, Citation2004; Marais et al., Citation2016). Development of second-tier cities, compared to that of global cities, is determined by national and regional factors. Such cities are more dependent on the established system of governance, configuration of the national settlement system and the status of regional and national markets. In the Russian Federation, for example, the role of second-tier cities is gaining importance due to the territorial magnitude of the country, remoteness from the capital city of the vast part of the country’s territory, the uneven nature of regional development, and the specific features of territorial strategic planning (Golubchikov & Badina, Citation2016; Turgel & Vlasova, Citation2016; Roberts & Hohmann, Citation2014; Lyubovny, Citation2013; Antipin, Citation2018; Ulyanova, Citation2017).
In this work, we aim to propose a comparative approach to evaluating the competitiveness of second-tier cities and their role in national settlement systems and in the socio-economic development of Eastern and Western European countries and Russia.
The article is structured according to the following logic. The Introduction section aims to justify the authors’ interest in the problem of urban development, in general, and second-tier cities, in particular. The Theory section investigates the evolution of theoretical ideas about the concept of second-tier city. The Methodology section outlines approaches to the description of the second-tier city concept, principles of their determination, as well as the importance of these cities in the development of countries. A methodology of comparative analysis of the contribution of second-tier cities in Europe and Russia based on demographic and economic indicators is proposed. In addition, an attempt is made to analyse the role of second-tier cities in the innovative development of countries as an important factor of long-term economic development. All calculations are presented in . The Results and Discussion section presents the results obtained during a comparative analysis of the contribution of second-tier cities in Western and Eastern Europe and Russia. Here, the key developmental trends are outlined. The Conclusion section summarizes the results obtained and presents major implications of the study.
Table 1. Demographic parameters of the second tier cities of Europe and Russia.
Table 2. Economic parameters of the second tier cities in Europe and Russia.
Table 3. Parameters of scientific and innovative potential of the second tier cities of Europe and Russia.
2. BACKGROUND
Although second-tier cities perform important economic and social functions and are home to a significant number of people, the specifics of their development have still attracted insufficient research attention (Friedmann, & Wolff, Citation1982; Zook and Brunn, Citation2005). This direction started to develop in the second half of the 1970s as a response to failures to support economic growth in the 1960s. The policy pursued by many governments to stimulate the concentration of export-oriented industries in the largest urban agglomerations demonstrated its ineffectiveness. The need to overcome the negative effects of over-concentrated economic activity shifted the research focus at that time to second-tier cities (Hardoy & Satterthwaite, Citation1986; Rondinelli, Citation1983; Wood, Citation1986). However, this surge in interest turned out to be temporary. The destruction of centralized planning systems and the acceleration of globalization processes brought large urban agglomerations back to the fore. Such entities were shown to be more effective in coping with global competition, encouraging the development of the knowledge economy and creative industries (Marais et al., Citation2016). During that period, a number of works appeared, whose authors discussed the impact of globalization on different types of cities (Bolay & Rabinovich, Citation2004; Robinson, Citation2002; Wright, Citation2005).
Recent years have witnessed a growing interest in the development of second-tier cities, largely due to an increasing turbulence of the external environment and an increasing frequency of global economic crises (Agnoletti, Bocci, Iommi, Lattarulo & Marinari, Citation2015; Hodos, Citation2011). Under these conditions, global cities demonstrate lower adaptability and higher sensitivity to changes in the external environment. At the same time, second-tier cities, which are not as involved in the system of world economic relations, turn out to be more resilient (Camagni & Capello, Citation2015; Markusen et al., Citation1999).
As a rule, primate cities are national or regional capitals; however, the experience of such countries as Switzerland, the Netherlands, Turkey, Australia and the United States shows that metropolitan functions can be successfully distributed among several cities (Kaufmann, Citation2018; Rossman, Citation2018, Schatz, Citation2004). The list of primate cities will expand if, in addition to population size, economic indicators are used as the inclusion criteria (Mayer et al., Citation2017; Turgel & Ulyanova, Citation2019).
Research into the development of second-tier cities in individual countries or macro-regions is expanding. Thus, Dobkins and Ioannides (Citation2001) note that in the United States, as opposed to France and Japan, population growth contributed to the emergence of new cities. These authors also discovered a relationship between the age of a city and the size of its population. Desmet and Rappaport (Citation2017) found that second-tier cities in the United States are characterized by the trend of convergence, while a comparison of first- and second-tier cities showed the trend of divergence. When analysing the system of urban settlement in Europe, researchers found that second cities perform urban functions better in the absence of dominant capitals (Cardoso & Meijers, Citation2016).
The level of competitiveness of second-tier cities with regard to national capitals depends on the efficiency of implementation of urban development strategies (Donaldson et al., Citation2020). It was convincingly shown that the political will and significant administrative resources helped South Korea to successfully realize nationwide policies aimed at supporting second-tier cities (Rondinelli, Citation1983; Henderson, Citation2002; Hardoy & Satterthwaite, Citation1986). However, there are risks that such developmental strategies may be ineffective due to either misidentification of prospective growth foci or the failure of their practical implementation (Duranton, Citation2008; Satterthwaite, Citation2006). The dominance of primary cities in terms of population and economic growth can also contribute to the failure of second-tier city development projects (Otiso, Citation2005).
An analysis of the role of second-tier cities in economic development reveals some interesting trends. Thus, such cities were found to be closely linked economically with the capitals or primate cities of other countries. This process promotes not only the inter-city competition at the national level, but also interactions between countries at the global level (Chen & Kanna, Citation2012). Another consequence of globalization is a decrease in the number of second-tier cities in economically developed countries. It was noted that, although the capitals of global financial and service economies are still concentrated in the Global North, a significant part of cities there used to be major industrial centres in the past (Forrant et al., Citation2017; Ryan, Citation2012). The use of digital technologies and big data is an important factor in the successful competition of second-tier cities for economic resources. Second-tier cities that develop smart governance and data-driven ecosystems tend to exhibit higher economic growth rates compared to national capitals with a low innovative capacity (Datta & Odendaal, Citation2019; Ranchod, Citation2020).
According to publications examining the role of secondary cities in demographic development, these are the fastest-growing entities in low- and middle-income countries (Shores et al., Citation2019). In Russia, the population growth rates in second-tier cities are generally lower than in regional capitals, being less attractive to migrants (Karachurina, Citation2020). However, the rapid population growth in second-tier cities in Africa, some Asian countries, and Latin America contributes to increasing poverty, inequality, and depletion of rural demographic resources (Singru, Citation2015). Conversely, in countries with higher levels of economic development, less successful secondary cities face the problem of population decline (Pendras & Williams, Citation2021).
The role of second-tier cities in territorial hierarchies can be elucidated using the concept of polycentricity. The morphological approach to the definition of polycentricity emphasizes the size and distribution of urban centres across space. The functional approach emphasizes the importance of functional relationships in forming territorial hierarchies (Brezzi &Veneri, Citation2015; Rauhut, Citation2017; Riguelle et al., Citation2007). The concept of polycentricity is analysed at three different levels: intracity, intercity, and interregional (Green, Citation2007; Rauhut, Citation2017). In this context, studies into the spatial organization of polycentric regions in Germany and UK are of particular interest (Dembski, Citation2015; Growe, Citation2012; Zepp, Citation2018). The centres of these polycentric regions act simultaneously as second-tier cities within the framework of national settlement systems. The idea of supporting the polycentricity of regional development has become one of the key priorities of contemporary spatial policy, primarily in the European Union (Cardoso & Meijers, Citation2016; Vandermotten et al., Citation2008).
Despite the significant number of publications focusing on various aspects of the development of second-tier cities in different countries and macro-regions, there seems to be a lack of cross-country comparisons that evaluate the economic role of such cities in an integral way. To a certain extent, our study intends to fill this gap by comparing secondary cities in Western Europe, Eastern Europe, and the Russian Federation.
3. METHODOLOGY
The role of second-tier cities in national systems and their competitive potential against capital cities was studied by integrating three conceptual approaches.
First, it is important to perform an analytical selection of second-tier cities or to come up with a precise definition of a second-tier city. In keeping with the international practice, second-tier cities are those ranking after primate cities in the hierarchy of national settlement systems according to population size. While primate cities serve mainly as the centres of capital city agglomerations, second-tier cities play the role of regional development centres for the economy and the society. As a rule, second-tier cities are defined as such due to the number of residents. However, the diversity of countries by population, settlement system, government principles, and economic structure requires a broader definition of second-tier cities, rather than that based exclusively on the population size. Thus, UN-Habitat classifies cities with a population of 100–500 thousand people as second-tier cities (UN-Habitat, Citation1996). In China, such cities can reach populations of more than five million people. For comparison, in Southeast Asia, second cities are determined as those with from 100 thousand people to 3 million people (Song, Citation2013). For Russia, it seems relevant to classify cities with more than 1 million people (according to Set of rules 42.13330.2016 ‘Urban Planning’ Citation2016) as those of the second-tier group, with the exception of Moscow and St. Petersburg, which should be classified as primate cities. Second, the European Commission and the European Research Program ESPON 2020 define second-tier cities as non-capital cities of European states, which make a significant contribution to national economies in terms of economic and social indicators. Currently, there are no precise criteria for distinguishing second-tier cities in Europe; as a result, the ESPON program investigates all non-capital European cities (ESPON, Citation2013). According to third approach researchers propose to distinguish second cities by their functional role in the national settlement system, rather than by the criterion of population size (Abdel-Rahman & Anas, Citation2004; WorldBank, Citation2011; Hall, Citation2005). For example, such cities can serve as regional hubs in the supply chain network at the regional, national, and global levels. From the standpoint of this approach, strategies for the development of second cities should be based on their role and economic contribution.
Therefore, in this study, we propose to distinguish and analyse second-tier cities following a two-stage approach. The first stage is the formation of an analytical sample of cities based on the city size and its role in the national urban hierarchical system (primarily in terms of population size). Subsequently, a more detailed comparative analysis is carried out according to demographic and economic indicators, as well as (additionally) according to the level of innovative development as a basis for long-term economic growth.
An analytical sample of cities was formed by integrating the above approaches to identifying second-tier cities. Four types of macroregions such as Western Europe, Eastern Europe (former socialist countries, EU members), Eastern Europe (the former republics of the USSR not members of the EU) and the Russian Federation were included. This sample is useful for identifying the specifics of second-tier cities located in countries with different economic systems: both developed economies having established institutions of governance and emerging economies undergoing radical transformations. The Eastern European post-socialist countries, which are not EU members, were distinguished into a separate category, because, as opposed to other former socialist countries, they are guided by the EU policy in the field of infrastructure and sustainability.
For Western European countries, the sample included cities with more than one million people, not national capitals.
For Eastern European countries that are EU members (The United Nations, Citation2019), the sample included cities classified as second-tier by the European Spatial Planning Observation Network program (Parkinson et al., Citation2012).
For Eastern European countries that are not EU members, the sample included the city of Gomel (Belarus, the second largest city after the capital in the absence of other cities with a population of over one million except for the capital), Odessa, and Kharkov (Ukraine, population over one million people).
From the Russian Federation, the largest regional capitals with a population of more than one million people were included (Set of Rules 42.13330.2016 Urban planning Citation2016).
Second, in order to proceed with comparative analysis, it is important to define criteria for the selection of second-tier cities and to compare their role with that of capital cities. The most common approach relies on quantitative indicators, such as the number of residents, population density, and urban housing area (Van der Merwe, Citation1992). UN-Habitat reviews use the population size for comparisons (UNCHS, Citation2014). ‘However, it should be noted that second-tier cities play the role of regional capital cities, which is of importance for our study. In this sense, they are comparable with the official national capital and may claim leadership in certain areas (Hodos, Citation2011; Shagoyan, Citation2012). The absolute values of second-tier city indicators characterizing their economic performance are lower than the corresponding indicators for the official national capital (or the nation’s largest city). Relative threshold values can be utilized to evaluate the comparability of first- and second-tier cities, particularly in terms of their claims for national leadership. Zipf's law, a widely accepted framework, shows certain dependencies in city distribution based on population size. It has been established that the primate city should have a population twice as large as the second city in the municipal hierarchy (Jefferson, Citation1939; Zipf, Citation1949; Goodall, Citation1987). Other interpretations of Zipf's law have confirmed the existence of these dependencies (Gabaix, Citation1999). Analysis of population size distribution can also inform the assessment of other city indicators, particularly those related to economic performance (Axtell, Citation2001; Gaffeo et al., Citation2003; Nitsch, Citation2005). To achieve real comparability with the largest city, a second city's indicators should account for at least 50% of the largest city's indicators (Treyvish, Citation2009).
For a clearer comparison of second cities in Western European and Eastern European countries, as well as in cities with a population of over one million in Russia, it seems appropriate to compare relative, rather than absolute, indicators characterizing the contribution (share) of the analysed city in the country's indicators, as well as with respect to the country's capital.
Third, an analysis of solely demographic and economic statistics of cities’ development does not always identify the advantages of second-tier cities due to narrowed statistical opportunities (Turgel & Ulyanova, Citation2019). Therefore, we propose to use an additional indicator, i.e. the innovation potential of cities.
The full set of indicators used for comparative analysis of the contribution of second-tier cities includes the following:
3.1. Main Indicators for Assessing the Concentration of Second-Tier Cities
The level of demographic development (): population size, population dynamics for the period (for reference), the share of the city (or a group of Functional Urban Areas) in the indicators of the country as a whole, the share of the city (or a group of Functional Urban Areas) in the indicators of the capital city;
The level of economic development (): the city’s GDP in constant prices (2010 level) by purchasing power parity (or of the Functional Urban Area city group), the city’s GDP (or the Functional Urban Area city group) per capita (for reference), the city’s share in the national GDP, the city’s share in the GDP of the capital city.
3.2. Additional Indicators
Level of the city’s innovation potential (): the number of applications for patents in the European Patent Office, the proportion of people with higher education (5–8 levels of International Standard Classification of Education), the proportion of universities from the QS World University Ranking concentrated in the analysed cities to the total number of universities from the ranking QS located in the country, as well as Nature Index, which characterizes the level of scientific performance in the natural sciences of scientific groups based in the city.
For the calculation of the main quantitative indicators showing the concentration of the economy and population in second-tier cities, the following notations were introduced. Indices: i – an index of a specific indicator of socio-economic development (population and GDP), j – an index of the total territory of all second cities in the country, p – an index of individual second cities (or Functional Urban Areas), c – an index of the capital city, s – an index of the country.
The concentration of second-tier cities was calculated using the following formulas:
To compare the socio-economic indicators of large second-tier cities with those of the national capital, the following formula is used:
(1)
To estimate the contribution of large second-tier cities to the country's overall socio-economic performance, the following formula is used:
The indicators for assessing the innovative potential of cities () and the indicators given for reference in and are additional in nature. These indicators were analysed by the absolute presented values without taking into account their share in the capital and country volumes of indicators and are aimed at forming a more comprehensive picture of second-tier cities.
Data provided by the Organization for Economic Cooperation and Development (OECD.Stat), European Commission (EuroStat), and RF Government Statistics Service serve as the information basis for the research. To characterize demographic development of European cities, data available on the City Population Internet Portal (https://www.citypopulation.de/) ‘Population Statistics in Maps and Charts for all Countries in Europe’ were used. Analysis of the cities’ quantitative parameters was made on the basis of data available on the official websites of the corresponding ranking and analytical reports.
4. RESULTS AND DISCUSSION
Data representing demographic development of second-tier cities and their role in the national settlement systems of Western and Eastern European countries and Russia are given in .
Most Eastern European countries are characterized by a negative population trend as a whole for the period of time since the last European census (2011) with the exception of the Czech Republic (+1.6%) and Slovakia (+1.0%). In spite of the positive national demographic growth in these countries, there are negative dynamics for second-tier cities, such as Košice in Slovakia (−0.7%) and Ostrava in the Czech Republic (−4%). Similar negative trends are present in most second-tier cities in Hungary (−4.7%), Ukraine (−0.4%) and Poland (−1.5%). For the analysed selection of developed European countries negative dynamics are seen only in Spain (−0.2%), both in the capital city as well as in the second largest city, Barcelona, where the population growth in general has a positive trend. Germany has become Europe’s leader in terms of demographic dynamics with a 3.5% growth. In general, the positive population growth in Central and Western Europe is explained by migration processes from Northern Africa, Middle East and South Asia, which have multiplied since 2015 and have led to Europe’s migration crisis, the largest in Europe since the Second World War.
The Russian Federation is characterized by positive population dynamics for the country as a whole (+2.5%), as well as for the national capital (+1.4%) and for the entire group of second largest cities with populations of over one million (+0.85%). Population outflow among Russia’s largest regional capitals can be observed in Volgograd, Samara, Omsk and Nizhny Novgorod.
The flow of people to the national capitals with an average growth of 5% is typical for all European countries and Russia. Berlin is the leader with +10.7%, with Budapest having the lowest value (+1.3%). Over the last several years the role of capital cities in national settlement systems of European countries has grown. In the Russian Federation on the contrary we observe a small drop (−0.09%) of Moscow’s share in the overall national population.
The contribution of second-tier cities in the settlement systems in Russia and in Europe constitutes about 6.2% of the entire population. In the Warsaw Treaty countries, the share of second-tier cities is in general higher than the average number in Europe, ranging from 6.8% in Poland to 10.6% in Russia.
The analysis of population in Eastern European capital cities and second-tier cities reveals that only Poland's second-tier cities have a total population that surpasses that of its capital city by 48%. Similarly, in Western Europe, the population of second-tier cities is higher by 20% in Germany. In Russia this surplus is about 24%. It is noteworthy that the share of second-tier cities in the national capital indicator in the settlement systems of European countries and Russia over the last period (2011−2019) of observation is going down. This fact is supported by the negative dynamics of the share of second-tier cities’ population against that of the capital cities. The only exception is Belarus, with the value of +0.15% in Gomel. In Russia, the population of most cities with over one million residents (with the exception of St. Petersburg) is about 10% of the capital’s population. At the same time, only Milan in Italy (48% of the level of Rome), Barcelona in Spain (50% of the level of Madrid), Hamburg in Germany (51% of the values of Berlin), Kosice in Slovakia (55% of the level of Bratislava), and Kharkiv in Ukraine (49% of the values of Kiev) are close to the level of about or more than 50% of the capital’s indicators.
If we take into account the threshold values to assess the potential competitiveness of the second-tier cities with the national capitals (more than 10% of the capital city indicators), then one may assume that all selected second-tier cities in Europe have prerequisites to compete with the country’s largest city in terms of population. In Russia, those cities include St. Petersburg, Novosibirsk, Yekaterinburg, and Nizhny Novgorod. However, if we will taking into account the threshold values for the real competition (about or above 50% of the capital), then we may talk only about the cases of Košice in Slovakia (55% of the Bratislava level), Kharkiv in Ukraine (49% of Kyiv), Milan in Italy (48% of Rome), Barcelona in Spain (50% of Madrid), and Hamburg in Germany (51% of Berlin).
A comparison of the contribution of second-tier cities to the development of countries as a whole in terms of the main demographic and economic indicators is presented in a matrix (). All analysed countries passed the threshold of 10% in terms of their share in the country's GDP, with the exception of UK and Slovakia (a probable reason is accounting for only one city), as well as Hungary with five cities. This fact indicates that rather small cities are classified as second-tier cities. In terms of demography, almost all countries are less than 10% of the country's population level. The exception is Russia with its 13 largest cities.
Figure 1. A matrix for comparing countries according to the contribution of second-tier cities to the country-wide development indicators (share of second-tier cities in the country’s GDP and share of second-tier cities in terms of population size in the total population of the country).
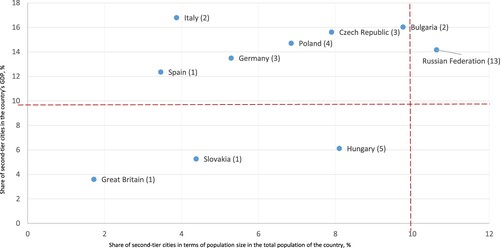
There are some general trends for the countries where second-tier cities include only cities with a population of one million or more (Ukraine, Russia, the UK, Germany, Spain, and Italy) :
there is an overall positive population growth in the cities with one million people or more, with the exception of Ukraine;
the share of separate cities with one million people in Russia in the national settlement system is significantly lower than in European countries. In addition, unlike the countries of Europe, over the last period, the total share of the second-tier cities in the total population went down (by 0.18%).
a typical feature of Russia is a significantly lower scale of separate cities with over one million people against the capital cities, compared to European countries. Among the exceptions are Novosibirsk and Yekaterinburg with a 12% indicator, comparable to that of Birmingham in the UK.
displays the key economic development indicators of the cities and surrounding urban territories, defined by OECD as Functional Urban Area (‘Definition of Functional Urban Areas (FUA) for the OECD metropolitan database,’ Citation2013). To compare Russian indicators of urban development, we used the data of the ‘Economy of Russia’s Cities and Urban Agglomeration’ research project, conducted by the ‘Urban Economy Institute’ Foundation.
In most countries of Europe and Russia, GDP of the capital city agglomeration is on average 3.3 times higher than that of the urban agglomeration groups around the second-tier cities. Germany and Italy are the exceptions, where the economy scale of the second-tier Functional Urban Area (2.5 and 1.9 times correspondingly) is twice as high as those of the capital cities. It is interesting to know that while in Germany the population of the second-tier cities is 20% higher than the population of Berlin, which explains the scale of second-tier economies, in Italy the reverse is true. In spite of the lower share of the population in the second-tier cities, the share of their economy considerably exceeds that of Rome.
Another specific feature of the second-tier cities’ role in the economic development is seen in Russia and Poland. In spite of the higher share of the second-tier cities’ population compared to the capitals (in Russia by 1.3 times and in Poland 1.5 times) their contribution to the national GDP in Russia is twice lower and in Poland 1.3 times lower than that in the capital city. This fact demonstrates insufficient economic density in those cities and their lower economic efficiency.
The leader among urban capital city areas in terms of GDP is Moscow with USD747 billion, followed by London (USD718 billion). In both countries the share of the metropolitan areas reaches 30% of the national GDP, preceded only by Budapest (nearly 50% of Hungary GDP). In general, comparison of their economic role in the national wealth of Eastern Europe countries with their Western counterparts shows a higher rate of centralization (on average the share of Eastern Europe capital cities equals 30% of the national GDP against 15% of the Western Europe countries).
In St. Petersburg, Russia’s second largest city, the size of the economy of the surrounding urban territory in absolute terms is comparable to that of Barcelona, Berlin and Rome. However, it is three times larger than the capital of Catalonia, 1.5 times larger than Germany’s capital and 1.9 times larger than Rome. Again this demonstrates lower economic efficiency indicators of Russia’s cities. The proof of this fact is the comparison of average per capita GDP FUA. On average, Russia has the lowest economic efficiency among the countries of Eastern and Western Europe – $19.500 per capita. Only Bulgaria has a lower number of $17,000 per capita. Moscow with its per capita GDP of $44,000, levels out Russia’s average GDP per capita indicators.
Unlike the demographic indicators, fewer second-tier cities can compete with the national capital cities in terms of economy. Potential competition to the capital may be offered by the second-tier cities of Bulgaria, Poland, the Czech Republic, Hungary and the UK (with lower than the capital’s GDP values, compared with demographic values). In Russia, only St. Petersburg has prerequisites to provide competition with the national capital. In Southern European countries (Italy and Spain) and Germany, all selected second-tier cities are competing with the national capitals. Moreover, Munich and Milan surpass the national capitals by the size of their economy and de facto perform their economic functions in their countries ().
Figure 2. A matrix for comparing countries according to the contribution of second-tier cities to the country's capitals development indicators (share of second-tier cities in the capital’s GDP and share of second-tier cities in terms of population in the total population of the country).
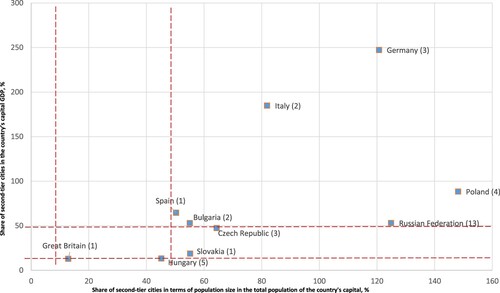
The differences in the economic development of the cities with one million and more people in Europe and Russia lie in their different shares in the national wealth. Thus, the share of separate second-tier city agglomerations in Russia on average does not exceed 1.1% of the national GDP, whereas in Europe this number, on average, equals 4.7%. This is a sign of a strong economic and political centralization in Russia, which is also supported by the specific nature of registering companies in the Russian Federation (registration of the HQs of large corporations in Moscow and subsequently, their contribution to the metropolitan indicators).
An analysis of the number of patent applications () to the European Patent Office (EPO) submitted from second-tier cities compared to the capitals reveals two major groups: one in Eastern Europe and the other in Western Europe. Eastern Europe countries are characterized by centralized innovation activities. The number of applications from the Eastern Europe capitals is much higher than that from second-tier cities, whereas, in Western Europe (including Southern Europe), the number of applications is distributed evenly among other cities.
Two key conclusions can be drawn concerning the education level of metropolitan and second-tier residents. First, the share of the European population in the national capitals having university education (levels 5–8 according to the standard International Education Classification) is approximately twice as high as for the second-tier city residents. Second, in Russia, university education is a more traditional feature compared to the European population. Thus, more than half of the population of Russia’s cities with more than one million inhabitants has university education, while in Europe this number is just one third.
In terms of university quality, Western Europe surpasses Eastern Europe and Russia. The UK is the leader in terms of the number of world class universities, having 76 universities included in the global QS rating. However, only 26% of those are located in London, the others are spread out throughout the country. This is a typical feature of all developed European countries. For instance, in Germany, only 7% of international standard universities are based in the capital, in Spain only 16% and in Italy – 13%. In Eastern Europe countries world-class universities are primarily based in capitals. Poland and Russia stand out among their Eastern Europe counterparts by a large number of universities of the QS rating (14 and 27 respectively) distributed among the largest second-tier cities.
An analysis of the output quality in the area of natural science is similar to the patent application analysis. Obvious leaders among them have been singled out judging by their contribution to the development of natural sciences. The analysis was based on the Nature Index, which takes into account authorship of articles published in renowned international scientific reviews. The leaders in the scientific output in this area include London, Berlin and Barcelona, closely followed by Madrid. Warsaw and Prague are the leaders among Eastern Europe countries, while Moscow and St. Petersburg are the leaders in Russia. Only Nizhny Novgorod and Novosibirsk provide relevant information among Russia’s cities with over one million people.
5. CONCLUSION
It is noted that second-tier cities as drivers of economic growth still attract insufficient attention. This direction started to develop in the second half of the 1970s and the first half of the 1980s. Unfortunately, the collapse of centralized planning systems and the acceleration of globalization processes that followed in the 1990s shifted the focus back to largest urban agglomerations. However, secondary cities demonstrate higher resilience to increased turbulence of the external environment and frequently outperform capital cities. Aiming to bridge this gap, we propose a methodology for analysing the significance of second-tier cities on a national scale. This methodology applies a set of criteria for the selection of second-tier cities and relies on relative, rather than absolute, indicator values. Thus, the contribution of each second-tier city is assessed in relation to the country’s and its capital’s values. Three groups of indicators were used for calculations. The first group characterizes the city’s demographic development. The second group is the city’s economic development. The third group are the indicators characterizing the city’s innovative potential. The range of indicators for the analysis of cities was expanded, including, in addition to statistical data, information from specialized research reports and rankings.
The main trends in the demographic development of the analysed territories are a decrease in the total population of Eastern Europe countries, including all second-tier cities in these countries, with a simultaneous increase in the population of Western European countries, Russia and Belarus both in national capitals and in cities with a population of over one million. At the same time, a widespread redistribution of population in favour of national capitals was observed. The share of second-tier cities is also increasing, although at a slower pace (with the exception of Russia). Our analysis of the potential of second cities compared to national capitals in terms of population size showed large opportunities for second-tier European cities, regardless of their size. In this respect, the largest regional Russian capitals underperform European cities.
The economic contribution of second-tier cities to the development of national economies is much weaker than the demographic contribution. Moreover, real competition with the capitals exists only in the developed Western European countries, such as Germany, Italy and Spain. At the same time, such urban agglomerations as Milan and Munich surpass their capital cities in terms of GDP, performing the actual economic function of the capital. Despite the rather high absolute indicators of the GDP of urban Russian agglomerations, their economic efficiency is around the lowest among the analysed sample in comparison with European countries. The contribution of individual second cities (with the exception of St. Petersburg) to the country’s GDP does not exceed 1.1%, against 4.7% in European countries, including Eastern Europe. This confirms the high level of economic centralization in Russia.
From the standpoint of creating conditions for the innovative development of regions, the analysed countries can be divided into several groups according to the contribution of second cities to these processes. The first group comprises Eastern European countries, in which all research, educational and innovative activity is concentrated exclusively in the capitals (with the exception of Poland). Moreover, in Eastern Europe, Poland, the Czech Republic and Hungary are the leaders in innovative development. A similar picture is typical of Belarus, where 100% of top universities of the international level are concentrated in the capital, Minsk. Conversely, in Ukraine, leading universities are distributed between the capital, second cities and other regions. A similar distribution is observed in the countries of Western Europe. In the Russian Federation, there are leading universities in both primate cities and those with a population of one million, where a significant potential for innovative and scientific development is created.
In general, differences in the development of second cities in the analysed countries lie in the fact that in Eastern Europe, including Ukraine and Belarus, mainly capital cities are of key importance. In Western Europe, the economic contribution of second-tier cities with a population over one million people is very important, frequently more important that of the official capitals. In Russia, second-tier cities are characterized by an intermediate activity: on the one hand, they host significant growth potential, on the other, its implementation is insufficient for real competition with Moscow and large European cities. A probable reason is a high level of centralization in the Russian Federation. Separately, Moscow may compete with European capitals in absolute terms, but its efficiency and productivity are lower than those of European cities.
Acknowledgements
The research funding from the Ministry of Science and Higher Education of the Russian Federation (Ural Federal University Program of Development within the Priority-2030 Program) is gratefully acknowledged.
Disclosure statement
No potential conflict of interest was reported by the authors.
References
- Abdel-Rahman, H. M., & Anas, A. (2004). Theories of systems of cities,” handbook of regional and urban economics. In J. V. Henderson, & J. F. Thisse (Eds.), Handbook of regional and urban economics edition 1, volume 4, chapter 52 (pp. 2293–2339). Elsevier.
- Agnoletti, C., Bocci, C., Iommi, S., Lattarulo, P., & Marinari, D. (2015). First- and second-tier cities in regional agglomeration models. European Planning Studies, 23(6), 1146–1168. https://doi.org/10.1080/09654313.2014.905006
- Antipin, I. A. (2018). Strategic priorities in The development of large Russian cities. R-economy, 4(4), 144–150. https://doi.org/10.15826/recon.2018.4.4.019
- Axtell, R. L. (2001). Zipf distribution of US firm sizes. Science, 293(5536), 1818–1820.
- Bolay, J. C., & Rabinovich, A. (2004). Intermediate cities in Latin America risk and opportunities of coherent urban development. Cities, 21(5), 407–421. https://doi.org/10.1016/j.cities.2004.07.007
- Brezzi, M., & Veneri, P. (2015). Assessing polycentric urban systems in the OECD: Country, regional and metropolitan perspectives. European Planning Studies, 23(6), 1128–1145. https://doi.org/10.1080/09654313.2014.905005
- Camagni, R., & Capello, R. (2015). Second-rank city dynamics: Theoretical interpretations behind their growth potentials. European Planning Studies, 23(6), 1041–1053. https://doi.org/10.1080/09654313.2014.904994
- Cardoso, R. V., & Meijers, E. J. (2016). Contasts between first-tier and second-tier cities in Europe; a functional perspective. European Planning Studies, 24(5), 996–1015. https://doi.org/10.1080/09654313.2015.1120708
- Chen, X., & Kanna, A. (2012). Secondary Cities and the Global Economy.
- Datta, A., & Odendaal, N. (2019). Smart cities and the banality of power. Environment and Planning D: Society and Space, 37(3), 387–392. https://doi.org/10.1177/0263775819841765
- Dembski, S. (2015). Structure and imagination of changing cities: Manchester, Liverpool and the spatial in-between. Urban Studies, 52(9), 1647–1664.
- Desmet, K., & Rappaport, J. (2017). The settlement of the United States, 1800-2000: The long transition towards Gibrat's law. Journal of Urban Economics, 98, 50–68.
- Dobkins, L. H., & Ioannides, Y. M. (2001). Spatial interactions among US cities: 1900-1990. Regional Science and urban Economucs, 31(6), 701–731.
- Donaldson, R., Marais, L., & Nel, E. (2020). Secondary cities in South Africa. In Urban geography in South Africa (pp. 121–137). Springer.
- Duranton, I. (2008). Cities: Engines of growth and prosperity for developing countries (working paper no. 12). Commission of Growth and Development, World Bank.
- ESPON. (2013). Second tier cities and territorial development in Europe: Performance, policies and prospects. Scientific Report. https://www.espon.eu/sites/default/files/attachments/SGPTD_ Final_Report_-_Final_Version_27.09.12.pdf
- EuroStat. (2019a). https://appsso.eurostat.ec.europa.eu/nui/submitViewTableAction.do; https://appsso.eurostat.ec.europa.eu/nui/show.do?dataset=met_pat_eptot&lang=en
- EuroStat. (2019b). https://ec.europa.eu/eurostat/data/database
- Federal State Statistics Service of the Russian Federation. (2019). https://www.gks.ru/folder/12781; https://www.gks.ru/folder/210/document/13206
- Forrant, R., Levenstein, C., & Wooding, J. (2017). Metal fatigue: American bosch and the demise of metalworking in the Connecticut river valley. Routledge.
- Foundation “Institute of City Economics”. (2019). http://www.urbaneconomics.ru/centr-obshchestvennyh-svyazey/news/reyting-aglomeraciy-ot-fonda-institut-ekonomiki-goroda-rabotayut#_ftn2
- Friedmann, J. (2002). The world city hypothesis. Critical Concepts in the Social Sciences, 151–163.
- Friedmann, J., & Wolff, G. (1982). World city formation and agenda for research and action. International Journal of Urban and regional research, 6(3), 309–344.
- Gabaix, X. (1999). Zipf's law for cities: an explanation. The Quarterly journal of economics, 114(3), 739–767.
- Gaffeo, E., Gallegati, M., & Palestrini, A. (2003). On the size distribution of firms: additional evidence from the G7 countries. Physica A: Statistical Mechanics and its Applications, 324(1-2), 117–123.
- Golubchikov, O. Y., & Badina, A. V. (2016). Macro-regional trends in the development of cities of the former USSR. Regional Studies, 2(52), 31–43.
- Goodall, B. (1987). The penguin dictionary of human geography. Penguin.
- Green, N. (2007). Functional Polycentricity: A formal definition in terms of social network analysis. Urban Studies, 44(11), 2077–2103. https://doi.org/10.1080/00420980701518941
- Growe, A. (2012). Emerging polycentric city-regions in germany: Regionalisation of economic activities in metropolitan regions. Erdkunde, 66(4), 295–311.
- Hall, P. (2005). The world’s urban systems: A European perspective. Global Urban Development Magazine, 1(1), 1–12.
- Hall, P. G. (2006). Seven types of capital city. In D. Gordon (Ed.), Planning twentieth century capital cities (pp. 8–14). Routledge.
- Hardoy, J., & Satterthwaite, D. (1986). Small and intermediate urban centres: Their role in national and regional development in the third world. Hoder and Stoughton.
- Henderson, J. (2002). Urbanization in developing countries. World Bank Research Observer, 17(1), 89–112. https://doi.org/10.1093/wbro/17.1.89
- Hodos, J. I. (2011). Second cities: Globalization and local politics in Manchester and Philadelphia. Temple University Press.
- Jefferson, M. (1939). The law of the primate city. Geographical Review, 29(2), 226–232. https://doi.org/10.2307/209944
- Karachurina, L. B. (2020). Attractiveness of centers and secondary cities of regions for internal migrants in Russia. Regional Research of Russia, 10(3), 352–359. https://doi.org/10.1134/S2079970520030065
- Kaufmann, D. (2018). Varieties of capital cities. Edward Elgar Publishing.
- Lyubovny, V. Y. (2013). Cities of Russia: Alternatives of development and management. M.: Ekon-Inform, 614.
- Marais, L., Nel, E., & Donaldson, R. (2016). Second cities and development (pp. 187). Routledge.
- Markusen, A. R., Lee, Y. S., & DiGiovanna, S. (Eds.). (1999). Second tier cities: Rapid growth beyond the metropolis (Vol. 3). U of Minnesota Press.
- Mayer, H., Sager, F., Kaufmann, D., & Warland, M. (2017). The political economy of capital cities. Routledge.
- Nature Index. (2018). Science cities. https://www.natureindex.com/supplements/nature-index-2018-science-cities/global-city-map
- Nitsch, V. (2005). Zipf zipped. Journal of Urban Economics, 57(1), 86–100.
- OECD. (2013). Definition of functional Urban Areas (FUA) for the OECD metropolitan database. https://www.oecd.org/cfe/regional-policy/Definition-of-Functional-Urban-Areas-for-the-OECD-metropolitan-database.pdf
- OECD.Stat. (2019). https://stats.oecd.org/#
- Otiso, K. (2005). Kenya’s secondary cities growth strategy at a crossroads: Which way forward? GeoJournal, 62(1-2), 117–128. https://doi.org/10.1007/s10708-005-8180-z
- Parkinson, M., Meegan, R., Karecha, J., Evans, R., Jones, G., Tosics, I., & Hall, P. (2012). Second tier cities in Europe: In an age of austerity why invest beyond the capitals. Retrieved from https://people.uta.fi/~atmaso/verkkokirjasto/Second_tier_cities_policy.pdf
- Pendras, M., & Williams, C. (2021). Secondary cities: Introduction to research agenda. In M. Pendras & C. Williams (Eds.), Exploring uneven development in dynamic urban regions of the global north (pp. 1–24). Policy Press.
- Population Statistics in Maps and Charts for all Countries in Europe. (2019). Retrieved from https://www.citypopulation.de/Europe.html
- QS World University Rankings. (2019). https://www.topuniversities.com/university-rankings
- Ranchod, R. (2020). The data-technology nexus in South African secondary cities: The challenges to smart governance. Urban Studies, 57(16), 3281–3298. https://doi.org/10.1177/0042098019896974
- Rauhut, D. (2017). Polycentricity - one concept or many?. European Planning Studies, 25(2), 332–348. https://doi.org/10.1080/09654313.2016.1276157
- Riguelle, F., Thomas, I., & Verhetsel, A. (2007). Measuring urban polycentrism: A European case study and its implications. Journal of Economic Geography, 7(2), 193–215. https://doi.org/10.1093/jeg/lbl025
- Roberts, B., & Hohmann, R. (2014). The systems of second cities: The neglected drivers of urbanizing economies. CIVIS Sharing Knowledge and Learning from Cities, 7(No. 89861), 1–12. http://documents.worldbank.org/curated/en/400881468181444474/pdf/898610BRI0CIVI00Box385295B00PUBLIC0.pdf
- Roberts, B. H. (2014). Managing systems of second cities. Policy reponses in international, 232. City Alliance.
- Robinson, J. (2002). Global and word cities: A view from off the map. International Journal of Urban and Regional Research, 26(3), 531–554.
- Rodríguez-Pose, A., & Fitjar, R. D. (2013). Buzz, archipelago economies and the future of intermediate and peripheral areas in a spiky world. European Planning Studies, 21(3), 355–372. https://doi.org/10.1080/09654313.2012.716246
- Rondinelli, D. (1983). Secondary cities in developing countries: Policies for diffusing urbanization. Sage.
- Rondinelli, D. A., (2001). Making metropolitan areas competitive and sustainable in the new economy. Journal of Urban Technology), 8(1), 1–21.
- Rossman, V. (2013). Capitals: Their diversity, patterns of development and movement. Publishing House of the Gaidar Institute. 336.
- Rossman, V. (2018). Capital cities: Varieties and patterns of development and relocation. Taylor & Francis.
- Ryan, B. D. (2012). Design after decline: How America rebuilds shrinking cities. University of Pennsylvania Press.
- Sassen, S. (1991). Global city (Vol. 2). Princeton University Press.
- Satterthwaite, D. (2006). Outside the large cities. The demographic importance of small urban centres and large villages in Africa, Asia and Latin America. Human settlements discussion paper—urban change 3. UNCHS.
- Schatz, E. (2004). What capital cities say about state and nation building. Nationalism and Ethnic Politics, 9(4), 111–140.
- Set of Rules 42.13330.2016. (2016). Urban planning: Planning and development of urban and rural settlements. Updated version of the SNIP (building codes and regulations of the Russian Federation) 2.07.01-89. http://docs.cntd.ru/document/456054209.
- Shagoyan, G. (2012). ‘First’ and ‘second’ in images of Gyumri: Semiotic analysis of urban text. Kritikaisemiotika, 16, 17–47. http://www.philology.nsc.ru/journals/kis/pdf/CS_16/cs016shagoyan.pdf
- Shores, A., Johnson, H., Fugate, D., & Laituri, M. (2019). Networks of need: A geospatial analysis of secondary cities. Applied Network Science, 4(1), 1–20. https://doi.org/10.1007/s41109-019-0229-x
- Singru, R. N. (2015). Regional balanced urbanization for inclusive cities development: Urban-rural poverty linkages in secondary cities development in Southeast Asia.
- Song, L. K. (2013). Southeast Asian second cities: Frontiers of opportunity and challenges. Community Innovators Lab (CoLab).
- The United Nations. (2019). Standard country or area codes for statistical use. https://unstats.un.org/unsd/methodology/m49/.
- Treyvish, A. I. (2009). City, region, country, world. Country expert's view on the development of Russia. NovyKhronograf.
- Turgel, I., & Ulyanova, E. (2019). Russia’s largest regional capitals. The settlement system and the economy of the country. In B. Sergi (Ed.), Tech, smart cities, and regional development in contemporary Russia (pp. 55–81). Emerald Publishing Limited.
- Turgel, I. D., & Vlasova, N. Y. (2016). The “secondary” cities of the urals: From the factory city to multifunctional centers. Regional Studies, 2(52), 43–54.
- Ulyanova, E. A. (2017). Development of regional strategies in Russia: The case of sverdlovsk region. R-economy, 3(3), 176–188. https://doi.org/10.15826/recon.2017.3.3.020
- UN. (2014). World Urbanization Prospects: The 2014 Revision-Highlights. UN, 493.
- UN-Habitat. (1996). The management of second cities in Southeast Asia. United Nations Centre for Human Settlements.
- United Nations Centre for Urban Settlements. (2014). State of the African Cities: Re-imagining sustainable urban transitions. https://www.gwp.org/globalassets/global/toolbox/references/the-state-of-african-cities-2014_re-imagining-sustainable-urban-transitions-un-habitat-2014.pdf
- Van der Merwe, I. J. (1992). In search of an urbanization policy for SA: Towards second cities strategy. Geographical Research Forum, 12(1), 102–127. https://pdfs.semanticscholar.org/a45f/6d6578be7914a3da6697c4735c0889f44c07.pdf
- Vandermotten, C., Halbert, L., Roelands, M., & Cornut, P. (2008). European planning and the polycentric consensus: Wishful thinking?. Regional Studies, 42(8), 1205–1217. https://doi.org/10.1080/0034300701874206
- Wood, W. B. (1986). Immediate cities on a resource frontier. Geographical Review, 149–159.
- World Bank. (2009). Systems of cities integrating national and local policies connecting institutions and infrastructures.
- World Bank. (2011). Systems of cities:Harnessingurbanisation for growth and poverty alleviation. The world bank urban and local government strategy.
- World Bank. (2019) Urban Development. http://www.worldbank.org/en/topic/urbandevelopment/overview#1
- Wright, T. (2005). Global cities. Contemporary Sociology, 34(4), 392.
- Zepp, H. (2018). Regional green belts in the Ruhr region a planning concept revisited in view of ecosystem services. Erdkunde, 72(1), 1–22.
- Zipf, G. K. (1949). Human Behaviour and the Principle of Least Effort Reading. https://archive.org/details/in.ernet.dli.2015.90211/page/n7
- Zook, M. A., & Brunn, S. D. (2005). Hierarchies, regions and legacies: European cities and global commercial passenger air travel. Journal of Contemporary European Studies, 13(2), 203–220.