
ABSTRACT
E-governance is regarded as a critical indicator of smart cities, but the measurement of e-governance efficiency requires further consideration. Pursuing this research strand, the paper proposes an e-governance efficiency index (EEI) that is then applied to Chinese cities. The results show that e-governance efficiency in Chinese cities is spatially uneven. Overall, the newly proposed index can be used in supporting analyses and assessments of smart governance.
E-governance is a critical indicator of smart cities, where efficiency is understood as a key consideration of e-governance (Bernardo, Citation2019). Existing methods of evaluating e-governance often overlook measures of efficiency that can be applied in the context of data scarcity and a lack of advanced expertise.
The key factors in measuring e-governance efficiency relate to the speed of handling a single case and the total number of cases processed (Darem, Citation2013; Moon, Citation2002). This shares similarities with a well-known indicator: the H index. It quantifies scholarly performance as both the number and citations of papers, achieving the effect of describing productivity and impact with a single value. In order to provide a simple and implementable tool to measure the efficiency of e-governance, introducing the idea of the H index, we propose the e-governance efficiency index (EEI). EEI can simultaneously reveal information about the number of governance cases and the processing time with a single value. It is calculated as the number of cases (C) handled in a predefined time threshold, C × α (for detailed explanations on the measurement and parameter α, see the Appendix in the supplemental data online). A higher EEI indicates that government spends less time on cases, and consequently e-governance efficiency is higher. Guided by this framework, we map the EEI pattern of China (). Our data were derived from a well-known website: the People’s Daily Online from 2020 to 2021 (293,196 items in total).
Figure 1. E-governance efficiency index (EEI) map of China.
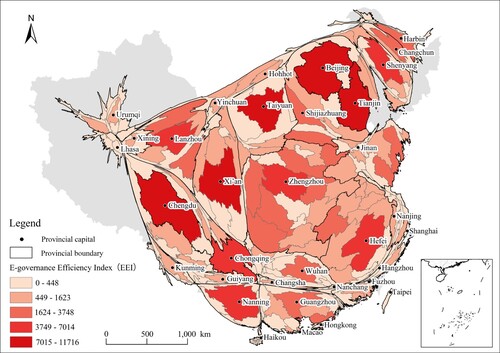
Several cities, such as Beijing and Chengdu, record the highest EEI, while there are 271 cities whose EEI distribution is in the low range of [0,448]. Moreover, the differences in e-governance efficiency are also among different provinces. Spatial contraction in the north-western regions, including Xinjiang, Tibet, Lhasa, Inner Mongolia and three north-eastern provinces, is notable, while the economically developed eastern regions, including Shandong, Fujian and Zhejiang, are also severely squeezed. However, there is a high achievement of e-governance in central and northern provinces (e.g., Hunan and Anhui). In most cases, the provincial capital cities often have the highest e-governance efficiency.
What this brief analysis indicates is that the EEI offers potential benefits to analysts interested in measuring and monitoring e-governance efficiency in China and internationally.
Supplemental Material
Download MS Word (23.7 KB)DISCLOSURE STATEMENT
No potential conflict of interest was reported by the authors.
REFERENCES
- Bernardo, M. D. R. M. (2019). Smart city governance: From e-government to smart governance. In Information Resources Management Association (Ed.), Smart cities and smart spaces: Concepts, methodologies, tools, and applications (pp. 196–232). IGI Global. https://doi.org/10.4018/978-1-5225-7030-1
- Darem, A. B. (2013). Measuring the efficiency of e-government websites. International Journal of Computer Applications, 70(22), 43–49. https://doi.org/10.5120/12203-8501
- Moon, M. J. (2002). The evolution of E-government among municipalities: Rhetoric or reality? Public Administration Review, 62(4), 424–433. https://doi.org/10.1111/0033-3352.00196