
 ?Mathematical formulae have been encoded as MathML and are displayed in this HTML version using MathJax in order to improve their display. Uncheck the box to turn MathJax off. This feature requires Javascript. Click on a formula to zoom.
ABSTRACT
This article analyses the impact of climate change policies (CCPs) on emissions at the regional level. Using data for the entire sample of European NUTS-2 regions over a period of 26 years, we find that CCPs effectively reduce regional emissions, with the impact that materialises three years after the implementation of the policy. These effects are associated with an improvement in economic activity in the medium term, and are amplified in regions with high innovation and investment capacity, and good local institutions.
1. INTRODUCTION
In the last decade, the fight against climate change has taken a new turn with international actions such as the United Nations’ (UN) 2030 Agenda for Sustainable Development. Countries worldwide have committed to substantial efforts to contrast climate crisis. However, the onset of the COVID pandemic in late 2019 has led to an abrupt turnaround by governments, as issues related to economic decline have taken over political agendas (Cifuentes-Faura, Citation2022). In fact, environmental policy actions may have negative effects on the economy, particularly in the short term, thus exacerbating poverty and inequality. If a trade-off between environmental goals and economic performance arises, policymakers may lack the political capital to enact climate change policies (CCPs).
In such a scenario, a deep understanding of the impact of CCPs on both environment and economy, of local-level aspects either mitigating or amplifying the efficacy of CCPs, as well as of heterogeneous effects of different policies, becomes crucial to raise awareness and policy support for strict climate actions.
This article contributes to these objectives by analysing the dynamic effect of CCPs on regional emissions, for a sample of 239 European NUTS-2 regions, during the period 1990–2015.Footnote1 The use of a dynamic model is crucial in our setting, as the effect of CCPs may take time to materialise, and static models may only capture a partial (short-term) effect.
The regional approach has several advantages over aggregate country-level studies. First, it increases the statistical power of the analysis. Second, levels of emissions may vary across regions, depending on unobserved local-level characteristics that are accounted for through region fixed effects. Moreover, the efficacy of CCPs may vary according to region-specific economic and political conditions.
The type of policy implemented may also affect the impact of CCPs (International Monetary Fund (IMF), Citation2019). In fact, CCPs include both market-based policies, such as taxes and trading schemes, and non-marked-based ones, as public support for research and development (R&D) for renewable energy. By analysing the efficacy of each individual policy, this article identifies the best policy mix to reach wider environmental goals, while limiting economic costs.
Results show that CCPs have significant and persistent effects on the reduction of emissions, with benefits for the environment that materialise three years after the implementation of the policy. Importantly, we demonstrate that positive medium-term effects for the environment are not driven by a reduction in economic activity, thus supporting the adoption of CCPs. The results also suggest that a great deal of heterogeneity does exist in terms of type of policy. In this regard, policies that impose costs on emissions (particularly CO2) or stimulate green investments are those that work more. Finally, results show that CCPs are more effective in regions with high gross domestic product (GDP) per capita, good local institutions, high innovation and investment capacity.
The contributions of this article to the existing literature are manyfold. First, as it adopts a dynamic approach and investigates the effect of CCPs on both emissions and economy – while existing studies consider either one or the other separately – it is able to disentangle short- and medium-term costs and benefits of CCPs. Moreover, it discusses in detail identification issues and provides a novel instrumental variable (IV) approach to strengthen causality. Finally, it investigates a larger set of sources of heterogeneity with respect to previous studies, in terms of both type of policy and local-level characteristics.
The rest of the article develops as follows. Section 2 reviews the literature. Section 3 presents the data and the empirical methodology. Section 4 provides the results. Section 5 discusses policy implications and concludes.
2. LITERATURE REVIEW
Escalating environmental issues have pushed governments to gradually expand green regulations. Likewise, the number of scholarly works aimed at empirically investigating the costs and benefits of CCPs, in terms of both environmental and economic outcomes, has rapidly increased (Organisation for Economic Co-operation and Development (OECD), Citation2021).Footnote2
2.1. CCPs and emissions
Empirical studies predominantly find a reduction of emissions after CCPs, meaning that tightening regulations lead to lower emissions. Zhao et al. (Citation2015) show that environmental regulation mitigates carbon emissions of power industry in China. Shapiro and Walker (Citation2018) analyse the reduction of emissions in US manufacturing, during the period 1990–2008 and find that it results from changes in environmental regulations. For the case of Europe, Neves et al. (Citation2020) analyse the role of CCPs in reducing CO2 on a sample of 17 EU countries and show that environmental regulation reduces emissions in the long run.
By contrast, a smaller literature indicates that CCPs increase emissions. In his seminal paper, Sinn (Citation2008) sustains the green paradox theory, according to which households and firms increase fossil energy consumption if they predict more stringent environmental regulations, thereby increasing CO2 emissions. Smulders et al. (Citation2012), using a theoretical approach, corroborate Sinn’s hypothesis. Zhang et al. (Citation2017) for the case of China find empirical validation of the green paradox.
Other studies disclose an inverted ‘U’-shaped relationship between green regulation and emissions, meaning that when regulation is weak, emissions increase, while they start decreasing after the intensity of CCPs overcomes a threshold. This may happen because early green regulation mostly stimulates environmental infrastructure construction (e.g., central heating), leading to high energy consumption and emissions (Zhang et al., Citation2020). This result is corroborated by Wang and Zhang (Citation2022).
This article supports the idea that effects of CCPs may change nonlinearly with time. For instance, the contribution of CCPs in reducing emissions may be better appreciated in the medium term, as both economic systems and the environment need time to respond to policy actions. This results in the need to empirically use a dynamic model.
2.2. Transmission channels: the effect of CCPs on the economy
A reduction of emissions after CCPs may occur either at economic costs, as CCPs impose additional costs on firms, or stimulating the use of clean energy. A large literature suggests that emissions decrease because of a slowdown of the economic activity (see OECD, Citation2021, for a review). Authors show that stringent CCPs negatively affect employment, production and foreign direct investment (FDI).
On the other side, increased energy costs may induce firms to modernise their production techniques and switch to a more energy-efficient production process, a theory known in the literature as the Porter Hypothesis (Porter & Linde, Citation1995). According to this hypothesis, CCPs favour decoupling by promoting the introduction of green technologies. In such a scenario, high economic growth may come with a reduction in emissions (Naqvi, Citation2021).
In light of the above scenarios, this article analyses short- and medium-term effects of CCPs on both emissions and economic performance, using the same country/time coverage. In so doing, it helps to better understand whether or not environmental benefits after CCPs imply economic costs, and the timing of these effects.
2.3. Heterogeneity in the effect of CCPs on emissions: policy instruments
Few studies in the literature have systematically explored the efficacy of different policy instruments available to policymakers, with authors mostly focusing on one specific policy or a few of them. Chang and Han (Citation2020) find that carbon pricing is the most effective measures to meet emission reduction targets. Zhao et al. (Citation2015) investigate three different environmental regulations in the Chinese power industry and show that market-based regulations and government subsidies have positive impacts on carbon emission reductions, while command and control regulations have no significant impact. Jiang et al. (Citation2022) analyse the effects (and co-effects) of carbon tax, sulfur tax and nitrogen tax in China, suggesting that governments should consider synergies between tax plans.
Differently from previous studies, this article compares the efficacy of a vast set of individual policy instruments in reducing emissions, within the same empirical framework.
2.4. Heterogeneity in the effect of CCPs on emissions: within-country characteristics
In terms of unit of analysis, researchers have concentrated on single countries or a restricted number of countries (particularly China and the United States) or industrial sectors (Pei et al., Citation2019). Within-country heterogeneity remains mostly unexplored, with few exceptions. Wang and Zhang (Citation2022), in their focus on 282 cities in China, find that CCPs effectively reduce CO2 emissions of large and medium-sized cities by adjusting the industrial structure, but they do not play a positive role in small cities. Naqvi (Citation2021) looks at regions in Europe and shows that low-income regions react strongly to CCPs. Sanchez Rodriguez et al. (Citation2018) adopt an urban perspective to identify salient factors that contribute to the exposure to climate change as well as the link with other sustainable development goals.
This article allows the effect of CCPs on emissions to depend on several region-specific characteristics. First, regions may better respond to CCPs if they have enough resources to deal with environmental issues (Wang & Zhang, Citation2022). The position of a region in the business cycle is also relevant. As noted by Pei et al. (Citation2019), emissions are expected to be pro-cyclical, as rapid economic development is linked to a consumption of large amounts of fossil energy. Investments and innovation are key to achieve environmental goals, as they can facilitate the adoption of environmentally friendly production techniques and amplify the efficacy of CCPs (Porter & Linde, Citation1995). In addition, the literature suggests that firms may deploy dirty productions in places with weak environmental regulations in response to stricter environmental policies (Kim & Rhee, Citation2019). Finally, the quality of the local government may play a role in increasing the efficacy of CCPs, as good regional institutions are less exposed to corruption (Fazekas, Citation2017). Considering the above intuitions, the effects of CCPs on emissions are expected to be larger in rich regions, in regions with high investment and innovation capacity, those with good local institutions, and hosting numerous multinational firms. Contrarily, it may be smaller in regions experiencing economic boom.
This article accounts for all these regional characteristics as factors mediating the effects of CCPs on regional emissions, thus improving its relevance for policy recommendations.
3. DATA AND METHODOLOGY
3.1. Data
We assemble a novel dataset that covers 239 European regions, over a period of 26 years (1990–2015). Table AT3 in the supplemental data online reports the descriptive statistics.
3.1.1. Emissions
Data for different types of emissions are retrieved from the Emissions Database for Global Atmospheric Research (EDGAR). The dataset is developed by the Joint Research Centre (JRC) of the European Commission and provides 0.1 × 0.1° grid-level emissions from 1970 to 2015. It covers both greenhouse gases (GHG) and air pollutants. We construct a comprehensive index of emissions by summing all the available items to evaluate the impact of CCPs on reducing overall emissions. Emissions data are then matched with NUTS-2 boundaries using the European ETRS 1989 LAEA coordinate system, so as to obtain and index of emissions at the regional level.
3.1.2. CCPs shock
In terms of CCPs, we use the environmental policy stringency index (EPS), developed by the OECD. The index varies yearly at the country level and ranges from 0 to 6, where 6 denotes the most stringent regulation. Figure AF1 in the supplemental data online reports the evolution of the average EPS across countries over time for the entire sample.
We define a CCPs shock as a significant increase in the degree of stringency of environmental regulation at the country level. In detail, we construct a dummy variable which takes the value 1 if the yearly variation in country i is larger than 1 SD (standard deviation) of the annual variation of EPS in our sample, and 0 otherwise:
(1)
(1) where
indicates the SD of the variation of EPS in our sample between t and t – 1.
3.2. Methodology
The impact of CCPs on emissions has been estimated using local projections (Jordà, Citation2005), a methodology already used in the literature to trace out short- and medium-term effects of macroeconomic policies on regional economies (Furceri et al., Citation2023). This procedure is particularly suited to estimating non-linearities in dynamic responses, as it is the case of our analysis. Specifically, we estimate the following equation:
(2)
(2) where subscripts r and t indicate region and time, respectively. The term
denotes the cumulative per cent variation of the level of emissions (in log) in region r between t + k and t – 1, with k = 0, … , 5 (years).
and
are region and time-fixed effects, included to account for differences in regional time-invariant characteristics and global shocks, for example, the Great Recession.
is the dummy variable that identifies the CCP shock, and
is a vector of controls that includes four lags (with l = 1/4) of the dependent variable, of the CCPs shock and of the share of the industrial sector in a region.Footnote3 Standard errors are clustered at the regional level.
Afterwards, we extend Equationequation (2)(2)
(2) to test if average effects of CCPs on regional emissions depend on heterogenous characteristics of regions. Following the previous literature (Furceri et al., Citation2023), we estimate this equation:
(3)
(3) with
(
where z is alternatively an indicator of regional wealth, business cycle, investment and innovation capacity, outward FDI and quality of local institutions,Footnote4 normalised to have zero mean and unit variance. is the corresponding smooth transition function. We exploit both within and cross-country variation in the normalisation, that is, we use
. The weights assigned to each regime vary between 0 and 1 according to the weighting function
, so that
can be interpreted as the probability of being in a given regime, at each horizon k. Specifically, the coefficient
is associated with low regimes, and
is the coefficient in high regime.
4. RESULTS
4.1. Unconditional effects
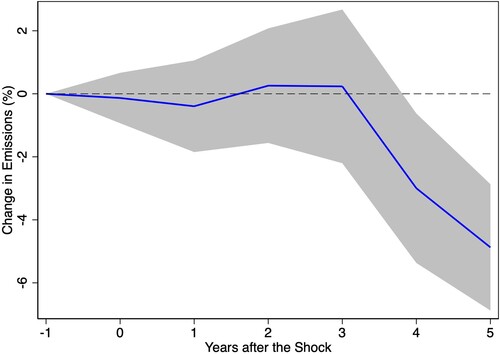
and Table AT4 in the supplemental data online present the dynamic effects of CCPs on regional emissions, over a period of five years. The results suggest that, in the short term, there is no statistically significant effect of CCPs on regional emissions. However, three years after the policy shock, emissions start to reduce, with the effect that persists over time. According to our estimates, the adoption of strict green regulations contributes to reducing regional emission by approximately 5%, five years after the policy shock.
Figure 1. Effect of climate change policies (CCPs) on regional emissions.
Note: The graph shows the dynamic effect of CCPs on regional emissions as well as the associated 90% confidence bands. Impulse response functions are estimated based on Equationequation (2)(2)
(2) . The x-axis shows years (k) after the shock; t = −1 is the year of the shock.
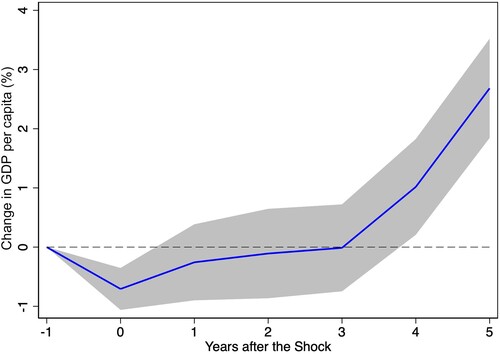
However, emissions may reduce at the cost of a disruption of economic activity. As noted in section 2, the literature does not provide clear-cut intuitions, as both a negative and a positive effect of CCPs on the economy are potentially possible. To test this relationship empirically, we substitute the dependent variable from emissions to economic performance. Results are reported in . In detail, the dependent variable is now the cumulative per cent variation of the regional GDP per capita, between t + k and t – 1, with k = 0, … , 5 (years), while the CCPs shock is the same as in Equationequation (1)(1)
(1) . Results show that the shape of the effect of CCPs on the regional economy is symmetrical to that of emissions. In detail, the economy slows down in the short-term in response to a CCPs, while it recovers after three years, to reach a peak of +3%, five years after the policy shock. Overall, these results indicate that while CCPs may cause short-term costs, they are growth-enhancing in the medium term.
Figure 2. Effect of climate change policies (CCPs) on regional gross domestic product (GDP) per capita.
Note: The graph shows the dynamic effect of CCPs on regional GDP per capita as well as the associated 90% confidence bands. Impulse response functions are estimated based on Equationequation (2)(2)
(2) . The x-axis shows years (k) after the shock; t = −1 is the year of the shock.
4.2. Robustness checks and IV approach
The article provides different robustness checks (see Figures AF2a–d in the supplemental data online). First, the lag structure in Equationequation (2)(2)
(2) is modified to check if results are affected by the four lags choice, and two and three lags have been considered. Second, instead of using the SD as threshold to construct the CCP shock, the article considers a dummy equal to 1 if the yearly variation of CCP index in country i is at least as large as the 80th percentile of the annual variation in our sample. Third, we drop outliers by excluding top and bottom 1% and 5% of the distribution of the regional emissions in our sample. Finally, GDP at a regional level and the innovativeness of regions have been included as additional controls, as they may indicate that regions have a developed and technologically advanced economic structure, potentially affecting the level of emissions. Results are qualitatively identical to that in , thus supporting the validity of our baseline analysis.
To further stress the causal interpretation of our results, we opt for an IV approach that consists of interacting a time-varying global term and a constant country-specific term (Furceri et al., Citation2023). In detail, the probability of a country to adopt strict CCPs depends on the policy pressure at the global level induced by weather-related shocks and country-level morphological conditions that may make the adoption of CCPs more likely. In fact, previous evidence shows that preferences toward CCPs changes after major natural disasters. In particular, we construct an instrument measuring the number of flood events in a given year, multiplied by the length of the coastline of a country.
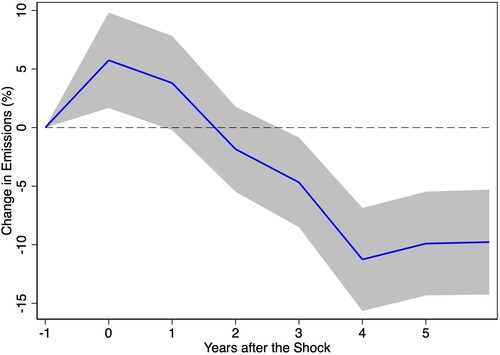
and Table AT5 in the supplemental data online report the results. The instrument is strong and highly statistically significant, as the Kleibergen-Paap rk Wald F-statistic is higher than the associated Stock–Yogo critical value. The results of the second stage show that the effect of CCPs on regional emission is larger than in the baseline. In particular, the impact materialises faster, and it is stronger than that in the baseline scenario, with CCPs that reduce regional emissions by approximately the 8.5% in the medium term.
Figure 3. Effect of climate change policies (CCPs) on regional emissions, instrumental variable (IV) analysis.
Note: The graph shows results from the headline equation when using the IV approach, that is, the dynamic effect of CCPs on regional emissions as well as the associated 90% confidence bands. The x-axis shows years (k) after the shock; t = −1 is the year of the shock.
4.3. Heterogeneity in CCP instruments
In order to build the overall EPS index, the OECD considers several individual policy instruments (see Tables AT6 and AT7 in the supplemental data online for the overall structure of EPS and a glossary of individual instruments). estimates the impact of each individual policy instrument on regional emissions. Note that for each instrument, a policy shock following the same rationale as in Equationequation (1)(1)
(1) has been constructed. As stressed by previous literature (Chang & Han, Citation2020), a tax on carbon emissions represents the most powerful tool to improve environmental quality. According to our estimates, a carbon tax shock may reduce regional emissions up to the 15% in the medium term. The same effect does not hold for other types of tax. Trading schemes may potentially have the same effect as that of the tax. However, as noted by the IMF (Citation2019), the coverage of emission trading systems has usually been very limited in practice and, as a result, their actual impact, as confirmed by our estimates.
Figure 4. Effect of climate change policies (CCPs) on regional emissions: type of policy.
Note: The graphs show the dynamic response of regional emissions to different types of CCPs as well as the associated 90% confidence bands. Impulse response functions are estimated based on equation (2). The x-axis shows years (k) after the shock; t = −1 is the year of the shock.
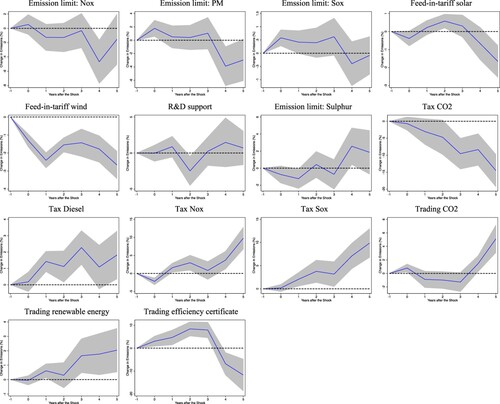
Even if taxes are powerful instruments from an environmental perspective, their introduction may be politically costly (Furceri et al., Citation2023). In such a scenario, alternative instruments such as regulations and emissions limit could be used. However, these instruments have a lower efficacy and would have to be implemented more aggressively to achieve the same emission reduction as that of the tax (IMF, Citation2019). Our results corroborate this idea, as the effect of each of the emission limit instruments is negative but weak. Finally, instruments that promote green innovations and support investments in renewable technologies may represent a complementary way to reduce emissions. Results show that feed-in-tariff, and R&D support to a lesser extent, significantly contribute to reducing emissions.
4.4. The role of economic characteristics
As discussed above, the effect of CCPs on regional emissions may be non-linear, depending on region-specific characteristics. In this empirical exercise, regional GDP per capita and the yearly variation of GDP are used to define the wealth of regions, and their position in the business cycle. To proxy regions’ investment and innovation capacity, this article considers two variables: the gross fixed capital formation at the regional level and the number of patent applications per 1 million inhabitants to the European Patent Office (EPO) in each region. The amount of regional outward FDIs indicates the presence of multinational companies in a region, which may deploy dirty activities where environmental regulation is weak, in response to stricter CCPs. We use data at firm-level, drawn from ORBIS (Bureau van Dijk), to create an index of intensity of outward FDI at a regional level, based on the number of foreign subsidiaries of multinational companies located in region r, at time t. Finally, to evaluate the quality of governments at the regional NUTS-2 level, we use data from Fazekas (Citation2017) that are based on criteria such as transparency and corruption.
Results are reported in . To facilitate their interpretation, each chart reports the impulse response functions of baseline analysis () and that of the regime which we expect to be relevant in determining the relationship between CCPs and regional emissions.
Figure 5. Effect of climate change policies (CCPs) on regional emissions, nonlinear effects.
Note: The graphs show the dynamic effect of CCPs on regional emissions as well as the associated 90% confidence bands. Blue lines indicate results from the baseline analysis, as in Equationequation (2)(2)
(2) . Red lines report estimations of equation (4), where the regime of the region is expected to be relevant in mediating the relationship between CCPs and regional emission. The x-axis shows years (k) after the shock; t = −1 is the year of the shock.
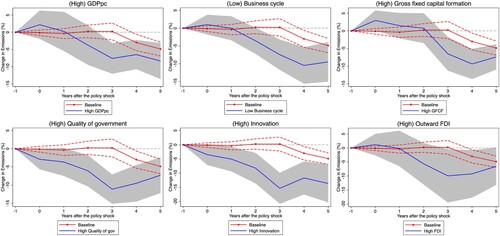
Our estimates confirm that the reduction of regional emissions, in response to an increase in the degree of stringency of CCPs, is larger in rich regions and those experiencing a period of economic downturn. Results also confirm that both innovation and investment capacity contribute to the effectiveness of CCPs. In fact, CCPs reduce regional emissions by about 10% and 15% in high-investment and high-innovation scenarios, respectively. A similar effect in magnitude is the one played by the quality of local government, with a reduction of emissions by about the 10%, in the medium term, when institutions are good. Finally, the efficacy of CCPs is larger in regions hosting numerous multinational firms, thus signalling a potential ‘race to the bottom’, according to which countries may weaken environmental standards to attract foreign investments.
5. DISCUSSION AND CONCLUSIONS
This article provides a dynamic analysis of the effect of CCPs on emissions at the regional level. Results show that CCPs reduce emissions, with the effect that only materialises three years after the implementation of the policy. A symmetric effect is the one that CCPs exert on regional GDP, with economic performance that deteriorates at adoption, and improves after three years. Taken together, these results suggest that green policy actions have short-term costs, but medium-term substantial benefits, both for the environment and the economy.
Considering its comprehensive approach, encompassing the peculiar characteristics of both type of policy implemented and regional economy, this article extends existing literature and provides interesting insights for policy actions. In detail, results support the adoption of CCPs as an effective tool to protect the nature and stimulate the transition towards a green economy. However, in light of the non-linear effects of policies, policymakers should be transparent about initial costs of green policy actions and put in act countermeasures to limit short-term costs, for example, through the enactment of active labour market policies. Moreover, the article emphasises a number of regional aspects that policymakers may consider to improve the efficacy of CCPs, such as the support to the innovativeness of regions. Finally, it shows what combination of policies may be implemented to reach wider environmental goals. In this regard, decision-makers could consider a combination of marked- and non-marked-based policies, such as tax on emissions and support for renewable energy.
In terms of its limits, our analysis could be extended to further levels of territorial disaggregation to better identify mediating factors (e.g., NUTS-3), as well as to developing contexts where different local-level factors may play a key role in driving the effect of CCPs.
Supplemental Material
Download PDF (698.4 KB)ACKNOWLEDGEMENTS
The authors thank Davide Furceri for valuable comments, and Asjad Naqvi for assistance in data collection.
DISCLOSURE STATEMENT
No potential conflict of interest was reported by the authors.
DATA AVAILABILITY
The data used in this article come from publicly available sources, listed in the text. Contact the corresponding author for additional information.
Notes
1 See Table AT1 in the supplemental data online for the list of countries and number of regions per country.
2 See Table AT2 in the supplemental data online for a summary of the results of the literature reviewed in this article.
3 Our results are robust to alternative lag structures; see section 4.1. The level of emission is strictly linked to the degree of industrialisation of the economy (Naqvi, Citation2021). Thus, we include the size of the industry in a region as an additional control, computed as the share of the gross value added (GVA) of industry in region i, at time t, over total GVA in region i, at time t.
REFERENCES
- Chang, N., & Han, C. (2020). Cost-push impact of taxing carbon in China: A price transmission perspective. Journal of Cleaner Production, 248(1), 1–9. https://doi.org/10.1016/j.jclepro.2019.119194
- Cifuentes-Faura, J. (2022). Circular economy and sustainability as a basis for economic recovery post-COVID-19. Circular Economy and Sustainability, 2(1), 1–7. https://doi.org/10.1007/s43615-021-00065-6
- Fazekas, M. (2017). Assessing the quality of government at the regional level using public procurement data. European Commission, Working Papers No. WP, 12, 2017.
- Furceri, D., Ganslmeier, M., & Ostry, J. D. (2023). Are climate change policies politically costly? Energy Policy, 178(C), 1–13. https://doi.org/10.1016/j.enpol.2023.113575
- International Monetary Fund (IMF). (2019). Fiscal monitor: How to mitigate climate change. Washington, October.
- Jiang, H.-D., Liu, L.-J., & Deng, H.-M. (2022). Co-benefit comparison of carbon tax, sulfur tax and nitrogen tax: The case of China. Sustainable Production and Consumption, 29, 239–248. https://doi.org/10.1016/j.spc.2021.10.017
- Jordà, Ò. (2005). Estimation and inference of impulse responses by local projections. American Economic Review, 95(1), 161–182. https://doi.org/10.1257/0002828053828518
- Kim, Y., & Rhee, D. E. (2019). Do stringent environmental regulations attract foreign direct investment in developing countries? Evidence on the ‘Race to the Top’ from cross-country panel data. Emerging Markets Finance and Trade, 55(12), 2796–2808. https://doi.org/10.1080/1540496X.2018.1531240
- Naqvi, A. (2021). Decoupling trends of emissions across EU regions and the role of environmental policies. Journal of Cleaner Production, 323, 1–24. https://doi.org/10.1016/j.jclepro.2021.129130
- Neves, S. A., Cardoso Marques, A., & Patrício, M. (2020). Determinants of CO2 emissions in European union countries: Does environmental regulation reduce environmental pollution? Economic Analysis and Policy, 68, 114–125. https://doi.org/10.1016/j.eap.2020.09.005
- Organisation for Economic Co-operation and Development (OECD). (2021). Assessing the economic impacts of environmental policies. Evidence from a decade of OECD research. OECD Publ.
- Pei, Y., Zhu, Y., Liu, S., Wang, X., & Cao, J. (2019). Environmental regulation and carbon emission: The mediation effect of technical efficiency. Journal of Cleaner Production, 236. https://doi.org/10.1016/j.jclepro.2019.07.074
- Porter, M. E., & Linde, C. V. D. (1995). Toward a new conception of the environment-competitiveness relationship. Journal of Economic Perspectives, 9(4), 97–118. https://doi.org/10.1257/jep.9.4.97
- Sanchez Rodriguez, R., Ürge-Vorsatz, D., & Barau, A. S. (2018). Sustainable development goals and climate change adaptation in cities. Nature Climate Change, 8(3), 181–183. https://doi.org/10.1038/s41558-018-0098-9
- Shapiro, J. S., & Walker, R. (2018). Why is pollution from US manufacturing declining? The roles of environmental regulation, productivity, and trade. American Economic Review, 108(12), 3814–3854. https://doi.org/10.1257/aer.20151272
- Sinn, H. W. (2008). Public policies against global warming: A supply side approach. International Tax and Public Finance, 15(4), 360–394. https://doi.org/10.1007/s10797-008-9082-z
- Smulders, S., Tsur, Y., & Zemel, A. (2012). Announcing climate policy: Can a green paradox arise without scarcity? Journal of Environmental Economics and Management, 64(3), 364–376. https://doi.org/10.1016/j.jeem.2012.02.007
- Wang, H., & Zhang, R. (2022). Effects of environmental regulation on CO2 emissions: An empirical analysis of 282 cities in China. Sustainable Production and Consumption, 29, 259–272. https://doi.org/10.1016/j.spc.2021.10.016
- Zhang, K., Zhang, Z.-Y., & Lian, Q.-M. (2017). An empirical analysis of the green paradox in China: From the perspective of fiscal decentralization. Energy Policy, 103, 203–211. https://doi.org/10.1016/j.enpol.2017.01.023
- Zhang, W., Li, G., Uddin, M.-K., & Guo, S. (2020). Environmental regulation, foreign investment behavior, and carbon emissions for 30 provinces in China. Journal of Cleaner Production, 248. https://doi.org/10.1016/j.jclepro.2019.119208
- Zhao, X., Yin, H., & Zhao, Y. (2015). Impact of environmental regulations on the efficiency and CO2 emissions of power plants in China. Applied Energy, 149, 238–247. https://doi.org/10.1016/j.apenergy.2015.03.112