
 ?Mathematical formulae have been encoded as MathML and are displayed in this HTML version using MathJax in order to improve their display. Uncheck the box to turn MathJax off. This feature requires Javascript. Click on a formula to zoom.
Abstract
Objectives
To evaluate S-phase fraction as a predictor of invasiveness and cancer-specific survival in upper tract urothelial carcinoma (UTUC).
Patients and methods
One hundred and fifteen patients having undergone radical nephroureterectomy were analysed with histology in radical nephroureterectomy specimens as reference test and S-phase fraction as index test. Ploidy and S-phase were determined using flow cytometry. Differences in S-phase fraction were calculated between stages, grades (WHO 1999 and 2004 classifications), ploidy and patients that died of UTUC and those who did not. Five- and 10-year-cancer-specific survivals were calculated. Areas under the ROC curve (AUCs) of S-phase fraction in relation to tumour stage and to death from UTUC were measured. Multiple Cox regression was performed.
Results
Independent prognostic markers of death from UTUC were S-phase fraction and stage. Correlation between S-phase fraction and risk of dying from UTUC was strong, with a 17% greater risk of death from UTUC with every 1% increase in S-phase fraction, hazard ratio = 1.17, 95% CI = 1.10–1.25, p < 0.001, Spearman’s rho ρ = 0.65. AUCs for S-phase fraction as predictors of stage and death from UTUC were 0.8 (95% CI = 0.705–0.894) and 0.77 (95% CI = 0.67–0.87), respectively. Cancer-specific survival was statistically significantly different between stages, ploidy and WHO 1999 grades, but not between WHO 2004 grades. This was also reflected in S-phase fraction, which differed in LG-G1 compared with LG-G2 and in HG-G2 compared with HG-G3.
Conclusion
S-phase fraction was a good test for predicting both invasiveness and cancer-specific survival. Using both WHO 1999 and 2004 classifications, rather than one system alone, had a higher predictive value of cancer-specific survival.
Introduction
Prognostic markers complementing stage and grade are needed for risk stratification and prediction of cancer-specific survival in upper tract urothelial carcinoma (UTUC), to enable targeted treatment and follow-up regimens. Although the correlation between grade and stage is known to be strong [Citation1,Citation2], this is mostly true for WHO 1999 grades 1 and 3. Grade 2 UTUC deviates in this respect but, by the means of combining both WHO 1999 and WHO 2004 grading systems, better prediction of cancer-specific survival has been noted [Citation3–5].
Some prognostic markers are assessable after radical nephroureterectomy (lymphovascular invasion, lymph node positivity). However, to risk-stratify patients for kidney-sparing treatment or neoadjuvant chemotherapy, prognostic markers should be evaluated on their performance at diagnostic work-up. Since 2015, the European Association of Urology (EAU) guideline [Citation6] has sorted UTUC into low- and high-risk categories and, since 2017, it has recommended kidney-sparing treatment to be considered in all patients with low-risk UTUC. In low-grade non-invasive UTUC, equal survival has been shown after radical nephroureterectomy and kidney-sparing treatment [Citation7,Citation8]. However, despite radical surgery and increased use of adjuvant chemotherapy [Citation9], survival of patients with high-risk UTUC is still poor and has not substantially improved [Citation10,Citation11]. Although survival is much higher in low-risk UTUC, also 10–20% of those patients will die from UTUC. Within the respective risk group we do not know which individuals will have recurrence, progression or will even die from UTUC, or why.
In a previous study, we examined tumour characteristics associated with invasiveness and cancer-specific survival [Citation12] and found that, in addition to the previously known prognostic markers, the tumour stage and grade, proliferation rate determined by the proportion of cells in S-phase of the cell cycle (S-phase fraction) using flow cytometry, was strongly associated with cancer-specific survival. S-phase fraction has not been much studied in UTUC. Flow cytometry is a relatively inexpensive and objective method that can be used to measure S-phase fraction in tumour cells from both radical nephroureterectomy specimens and from in-situ barbotage. The latter is easy to secure at diagnostic ureterorenoscopy and provides ‘pre-radical nephroureterectomy’ risk assessment. To further evaluate the usefulness of S-phase fraction as a predictor of invasiveness and of cancer-specific survival, we investigated S-phase fraction in an extended cohort of patients with non-metastatic UTUC treated with radical nephroureterectomy, with long-term follow-up.
Patients and methods
The study design was a prediction study, with retrospective analysis of a previously published cohort of consecutive patients (n = 43) treated with radical nephroureterectomy due to UTUC after diagnostic ureterorenoscopy [Citation4,Citation12] pooled with a consecutive series of patients (n = 72) who had undergone radical nephroureterectomy during the same period of time (2005–2013). Both series included open, conventional and robot-assisted laparoscopic radical nephroureterectomies performed with different techniques of bladder cuff removal due to non-metastatic UTUC. This study was approved by the Regional Board of Ethics and was conducted in line with the Declaration of Helsinki.
Histology of radical nephroureterectomy specimens were reassessed by a single specialized uropathologist (GJ) and served as the reference test [Citation13]. Patients were excluded if data from the reference test were missing: diagnosis other than UTUC, no remaining cancer in the specimen or specimen not available for reassessment. Tumours with histologic heterogeneity in the radical nephroureterectomy specimen were categorized as the higher grade present. S-phase fraction was the index test [Citation13]. Patients with missing or indeterminate data in the index test were excluded from analysis of that specific test only. Ploidy (DNA content) and S-phase fraction were determined using flow cytometry of tumour cells from radical nephroureterectomy specimens in paraffin-embedded tissue blocks. Flow cytometry was performed between 2011 and 2014, as previously described [Citation4,Citation12,Citation14], with samples from paraffin-embedded tumour specimens at least 100 µm thick in order to have enough intact cell nuclei for photospectrometry, performed at a rate of 200 cells/s. Samples were assessed with microscopy looking for the amount of inflammatory cells, collecting and analysing urothelial cells after Percoll® separation when necessary. The uropathologist did not have information on S-phase fraction when reassessing the radical nephroureterectomy specimen for histology; however, the pathologist interpreting S-phase by flow cytometry had information on the histology. Cause of death was verified by examining the patients’ charts and death certificates.
Statistical analysis
The patients were observed from the date of diagnosis until death or censoring. Differences in S-phase fraction were calculated among stages (non-invasive: pTa-1, CIS; and invasive: pT2 tumours), grades using both the WHO 1999 (grade 1, 2 and 3) and the 2004 (low- and high-grade) classifications and between diploid and aneuploid tumours. The difference in S-phase fraction was also calculated between patients who died from UTUC and those who did not (i.e. those who died of other causes or who were still alive at the end of the study). Tests of significance were performed using t-test, Mann–Whitney U-test, Kruskal–Wallis test or analysis of variance (ANOVA) as appropriate. We calculated and compared 5- and 10-year cancer-specific survival using the Kaplan–Meier method, while the log-rank test was used to test significance. Receiver operating characteristic (ROC) curves and areas under the curve (AUCs) with 95% confidence intervals were calculated to determine S-phase fraction in relation to tumour stage and death from UTUC, respectively. We used the non-parametric Spearman rank correlation to estimate the effects of non-linear relationship between S-phase fraction and risk of death from UTUC. Multiple Cox regression was performed to analyse whether the parameters of stage, grade, ploidy, and S-phase fraction were independently related to survival. Statistical analysis was performed using SPSS (IBM, version 27).
Results
Of the 115 patients, 99 patients had radical nephroureterectomy specimens eligible after reassessment of histology and 96 of these were assessable with flow cytometry. Survival was analysed in 99 patients. Patients were diagnosed between 2005 and 2013 and were followed-up until death or until 20 November 2020. No patient was lost to follow-up. Patients with short follow-up time died shortly after inclusion. During the follow-up of up to 14.4 years, 61 patients died, of these 32 died from UTUC. Patient and tumour characteristics are presented in .
Table 1. Participant characteristics: All participants, superficial and invasive UTUC, death from UTUC and ploidy.
Median follow-up time of all 99 patients was 7.6 (IQR = 3.1–11.9) years from diagnosis. The majority, 29/32 (91%), of the deaths from UTUC occurred within 5 years from diagnosis. The 5- and 10-year cancer-specific survival rates for all patients were 69% (95% CI = 60–79%) and 67% (95% CI = 60–79%), respectively. Kaplan–Meier curves depicting cancer-specific survival stratified by stage, grade and ploidy are presented in . The 5-year cancer-specific survival rates were 84% (95% CI = 75–95%) for papillary pTa-1 UTUC, 42% (95% CI = 29–62%) for pT2 UTUC, 100% for G1 UTUC, 71% (95% CI = 57–88%) for G2 UTUC and 53% (95% CI = 40–71%) for G3, 84% (95% CI = 71–100%) for low-grade (LG) UTUC and 64% (95% CI = 53–76%) for high-grade (HG) UTUC, 81% (95% CI = 70–92%) for diploid UTUC and 56% (95% CI = 43–74%) for aneuploid UTUC. The 10-year cancer-specific survival rates were equal to the 5-year cancer-specific survival for papillary pTa-1 UTUC and 39% (95% CI = 26–59%) for
pT2 UTUC, equal to the 5-year cancer-specific survival for both G1 and G2 UTUC, 47% (95% CI = 34–66%) for G3 UTUC, 77% (95% CI = 61–98%) for LG UTUC and 60% (95% CI = 50–73%) for HG UTUC, 75% (95% CI = 63–89%) for diploid UTUC and 53% (95% CI = 40–71%) for aneuploid UTUC.
Figure 1. (a) Differences in survival were statistically significant, log-rank test, p ≪ 0.001. The number of deaths from UTUC was 10 in patients with CIS, pTa-1 UTUC (one with CIS only) and 22 in patients with pT2 UTUC. (b) The difference in survival was statistically significant for WHO 1999 grades 1–3, log-rank test: p = 0.001, however not for WHO 2004 low- and high-grade tumours: p = 0.065 (not significant). The number of deaths from UTUC was one G1 patient, 10 G2 patients, 21 G3 patients, five patients with low-grade UTUC, and 27 patients with high-grade UTUC. The mean estimated time to death for WHO 2004 LG UTUC was 11.5 years and for WHO 2004 HG UTUC was 9.8 years. The difference was not statistically significant (log-rank test, p = 0.065). The mean estimated time to death for WHO 1999 G1 UTUC was 13.1 years, that for G2 was 10.7 years and that for G3 was 8.3 years. The difference was statistically significant (log-rank test, p = 0.001). The mean estimated times to death for low-grade and high-grade G2 UTUC were 5.1 years and 11.5 years, respectively. The difference was statistically significant (log-rank test, p = 0.027). The mean estimated times to death from high-grade G2 and high-grade G3 were 11.5 years and 8.3 years, respectively, and the difference was statistically significant (log-rank test, p = 0.011). (c) Differences in survival were statistically significant (log-rank test, p = 0.007). The number of deaths from UTUC was 12 patients with diploid UTUC and 19 with aneuploid UTUC.
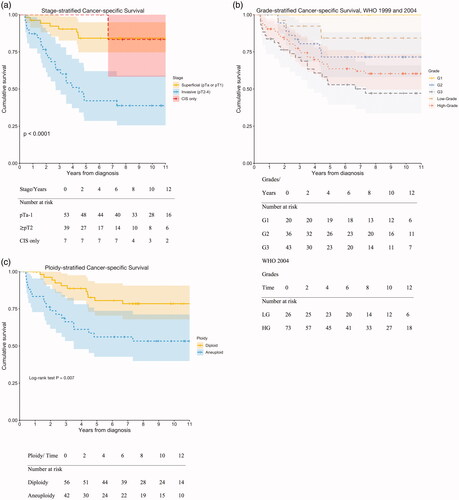
Using Cox regression, stage (HR = 5.00, 95% CI = 2.35–10.63), p ≪ 0.001), WHO 1999 grade (HR = 2.81, 95% CI = 1.56–5.06, p = 0.001), ploidy (HR = 2.60, 95% CI = 1.26–5.35, p = 0.01) and S-phase fraction (HR = 1.17, 95% CI = 1.10–1.25, p ≪ 0.001) were significantly associated with cancer-specific mortality. Using multiple Cox regression, the only two independent prognostic markers of death from UTUC were S-phase fraction (HR = 1.13, p = 0.012) and stage (HR = 2.65, p = 0.043).
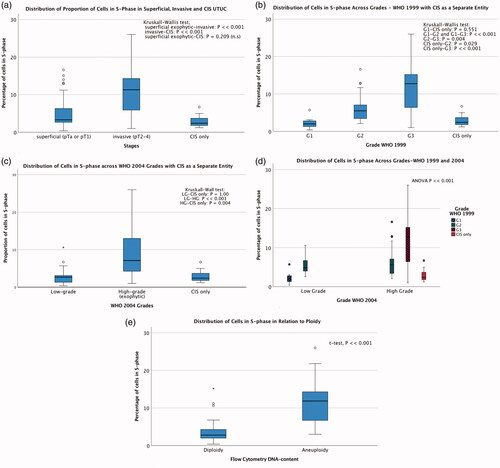
Distributions of S-phase fraction across stages, grades, ploidy and cancer-specific mortality are shown in . Predictive accuracies of S-phase fraction for prediction of invasiveness (≥pT2) and death from UTUC, measured by areas under the ROC curves, were 0.8 (95% CI = 0.705–0.894) and 0.77 (95% CI = 0.67–0.87), respectively. The risk of dying from UTUC was 17% greater with every 1% increase in S-phase fraction (HR = 1.17, 95% CI = 1.10–1.25, p < 0.001), Spearman’s rho ρ = 0.65, i.e. the correlation between S-phase fraction and risk of dying from UTUC was strong.
Figure 2. Distributions of the proportions of cells in S-phase in relation to stage, grade, ploidy and death from UTUC. (a) Median percentage of cells in S-phase (IQR) pTa-1: 3.3 (2.65–6.35), pT2 11.3 (5.9–14.3) and CIS only 2.4 (1.8–3.7). (b) Median percentage of cells in S-phase (IQR) using WHO 1999 classification: grade 1: 2 (1.3–2.8), grade 2: 5.5 (3.4–7.1), grade 3: 12.8 (6.3–15.2) and CIS only: 2.4 (1.3–5). (c) Median percentage of cells in S-phase (IQR) using WHO 2004 classification: low-grade 2.7 (1.3–3.3), high-grade 7.1 (4.2–13.0) and CIS only 2.4 (1.3–5.0). (d) Median percentage of cells in S-phase (IQR) combining WHO 1999 and 2004 classification systems: low-grade G1: 2 (1.3–2.8), low-grade G2: 4.9 (3.7–7.7), high-grade G2: 5.6 (3.3–7.3), high-grade G3: 12.8 (6.3–15.2) and CIS only: 2.4 (1.3–5.0). Test of significance: t-test LG-G1 compared with LG-G2: p ≪ 0.001, LG-G1 compared with CIS only: p = 0.061 (not significant), LG-G2 compared with HG-G2: p = 0.46 (not significant). Kruskal–Wallis test HG-G2 compared with HG-G3: p ≪ 0.001, HG-G2 compared with CIS only: p = 0.046, exophytic HG-G3 compared with CIS only: p ≪ 0.001. (e) Median percentage of cells in S-phase (IQR): diploid 2.8 (2-4.3) and aneuploid: 11.9 (6.7–14.5). (f) Median percentage of cells in S-phase (IQR): death from UTUC 10.9 (5.7–14.6) and others 3.45 (2.4–6.7).
Discussion
In the present study, most deaths from UTUC occurred early in the follow-up period and almost exclusively within the first 5 years. Five-year cancer-specific survival for all patients was 69% (95% CI = 60–79%). Comparable cancer-specific survival rates (> 70%) have been reported in studies by other research groups [Citation15–17].
In a previous study [Citation12,Citation14], we found that the risk of death from UTUC increased by 25% for every percent increase in S-phase fraction in pTa-T1 and CIS UTUC (p = 0.027), but no further increase in risk of death from UTUC with higher S-phase fraction was seen in > pT2 UTUC (p = 0.969). S-phase fraction was significantly higher in > pT2 than in pTa-T1 and CIS UTUC (p = 0.002). Since the number of patients in that study was relatively small (43 patients), we analysed this further by pooling that patient cohort with the additional cohort in the present study. We found that the correlation between S-phase fraction and risk of dying from UTUC was strong (Spearman’s ). This correlation was statistically significant (p ≪ 0.001) and is clinically relevant.
In univariable analysis, we found that ploidy was a predictor of death from urothelial carcinoma, similarly to the findings of a study on bladder cancer [Citation18]. However, in multiple Cox regression, ploidy was not found to be an independent predictor. In the multiple Cox regression, S-phase fraction was an independent predictor of cancer-specific mortality. In studies of flow cytometry, aneuploidy and high S-phase fraction have been found to predict both metastases and lower cancer-specific survival in bladder cancer [Citation19]. The mean S-phase fraction in our patient cohort (7%, range = 0.4–26) was level with that reported in bladder cancer patients [Citation20]: 6.6% (range = 1–35) but lower than the mean 10.3% (range = 2.7–20.3) in the 11 UTUC patients investigated by Oldbring et al. [Citation21]. Although a small study, Oldbring et al. also observed that aneuploid grade 2 UTUC differed from aneuploid grade 3 UTUC regarding the level of S-phase fraction (4.6% vs. 17.3%). Although smaller, a difference was also seen in our study: mean S-phase fraction was 8.1% and 12.9% in aneuploid grade 2 and grade 3, respectively.
Although S-phase fraction increased with higher stage and grade, in this regard CIS was more similar to pTa-1 low-grade tumours than to papillary high-grade or G3 UTUC. S-phase fraction did not differ between CIS and G1 UTUC, although CIS is histologically a grade 3 lesion. In the seven patients with only CIS, the tumours contained a low S-phase fraction, median 2.4% (IQR = 1.8–3.7), whereas S-phase fraction in invasive G3 was median 12.8% (IQR = 6.3–15.2) (). This low S-phase fraction in CIS could explain why CIS tumours progress slowly and why it seems safe to create a nephrostomy tract for BCG therapy in CIS-only patients, whereas in patients with invasive high-grade UTUC, the risk of tumour seeding is high [Citation22,Citation23]. However, the representativeness of the analysed specimen is harder to ascertain in CIS that is less distinct macroscopically than a papillary tumour.
Data were collected during a time before kidney-sparing treatment was more widely offered, consequently, all stages, grades and sizes were represented in the present study. This gives a good representation of the naturally occurring stages and grades and makes the results generalizable. The chosen time frame enabled long-term follow-up. Flow cytometry is a more objective method of assessing proliferation than histology. We have previously shown that it is feasible and easy to use in situ barbotage to determine grade, ploidy and S-phase fraction [Citation4]. However, this requires fresh barbotage, which was not available from all patients in the present study. Although there might be concerns about quality when cell specimens have been prepared from deparaffinated archival tissue blocks, the radical nephroureterectomy specimens provided sufficient good quality material for flow cytometry [Citation14].
Estimated survival differed significantly between patients with low-grade G1 and low-grade G2 tumours and between those with high-grade G2 and high-grade G3 tumours. This was also reflected in S-phase fraction. van Rhijn et al. [Citation5] analysed a large bladder cancer cohort and showed that the combination of WHO 1973 and 2004 classifications was superior for predicting prognosis to either system used alone, due to better assessment of grade 2 when it was divided into low and high grades. This was also found in the present study. When the WHO 2004 classification was used, tumours with different properties were pooled together and no statistically significant difference in survival was found between low- and high-grade UTUC. However, a significant difference was indeed found when the WHO 1999 classification was used. Differences between HG G2 and HG G3 UTUC have also been found when analysing genetic profiles of the tumours [Citation24].
Analysis of S-phase fraction was performed on archival radical nephroureterectomy specimens in the present study, in order to obtain a large material with long-term follow-up time. However, S-phase fraction can be analysed in ureterorenoscopic barbotages [Citation4] and thus be considered in the preoperative work-up of UTUC. Ureterorenoscopic biopsies are generally very small and not always possible to obtain. Barbotage is easier to collect and may, at least theoretically, represent a larger part of the tumour than a biopsy. Biopsies taken can be prioritised for analysis of histology.
Conclusion
We confirmed that S-phase fraction was an independent prognostic marker. S-phase fraction was a good test for predicting both invasiveness and cancer-specific mortality, as indicated by the area under the ROC curve. Accordingly, to improve the risk stratification of UTUC, this could be an add-on test performed together with in situ barbotage cytology and endoscopic biopsy histology or histology of radical nephroureterectomy specimens. Furthermore, we found that using both the WHO 1999 and 2004 classifications for tumour grade could better predict prognosis.
Geolocation information
The authors and the patient cohorts are located in Stockholm, Sweden.
Author contributions
C. Malm: project development, data collection and management, data analysis, manuscript writing. G. Jaremko: data collection, histopathology analysis, manuscript editing. M. Brehmer: project development, data collection and manuscript editing.
Compliance with ethical standards
Conflict of interest
The authors declare that they have no conflict of interest.
Ethical approval
This study was approved by the Regional Board of Ethics and was conducted in line with the Declaration of Helsinki.
Informed consent
Informed consent was obtained from all individuals participating in the study.
Additional information
Funding
References
- Keeley FX, Kulp DA, Bibbo M, et al. Diagnostic accuracy of ureteroscopic biopsy in upper tract transitional cell carcinoma. J Urol. 1997;157(1):33–37. Jan
- Williams SK, Denton KJ, Minervini A, et al. Correlation of Upper-Tract cytology, retrograde pyelography, ureteroscopic appearance, and ureteroscopic biopsy with histologic examination of Upper-Tract transitional cell carcinoma. J Endourol. 2008;22(1):71–76. Jan
- Holmäng S, Johansson SL. Urothelial carcinoma of the upper urinary tract: Comparison between the who/isup 1998 consensus classification and who 1999 classification system. Urology. 2005;66(2):274–278. Aug
- Malm C, Grahn A, Jaremko G, et al. Diagnostic accuracy of upper tract urothelial carcinoma: How samples are collected matters. Scand J Urol. 2017;51(2):137–145.
- van Rhijn BWG, Hentschel AE, Bründl J, et al. Prognostic value of the Who1973 and Who2004/2016 classification systems for grade in primary ta/t1 Non-Muscle-invasive bladder cancer: a multicenter european association of urology Non-Muscle-invasive bladder cancer guidelines panel study. Eur Urol Oncol. 2021; 044(2):182–191.
- Rouprêt M, Babjuk M, Burger M, et al. European association of urology guidelines on upper urinary tract urothelial carcinoma: 2020 update. Eur Urol. 2021; 0179(1):62–79.
- Cutress ML, Stewart GD, Zakikhani P, et al. Ureteroscopic and percutaneous management of upper tract urothelial carcinoma (utuc): systematic review. BJU Int. 2012;110(5):614–628. Sep
- Seisen T, Peyronnet B, Dominguez-Escrig JL, et al. Oncologic outcomes of Kidney-Sparing surgery versus radical nephroureterectomy for upper tract urothelial carcinoma: a systematic review by the eau Non-Muscle invasive bladder cancer guidelines panel. Eur Urol. 2016; 1270(6):1052–1068.
- Birtle A, Johnson M, Chester J, et al. Adjuvant chemotherapy in upper tract urothelial carcinoma (the pout trial): a phase 3, Open-Label, randomised controlled trial. Lancet. 2020; 04 18395(10232):1268–1277.
- Almås B, Halvorsen OJ, Johannesen TB, et al. Higher than expected and significantly increasing incidence of upper tract urothelial carcinoma. A population based study. World J Urol. 2021;39(9):3385–3391. Sep
- van Doeveren T, van der Mark M, van Leeuwen PJ, et al. Rising incidence rates and unaltered survival rates for primary upper urinary tract urothelial carcinoma: a dutch population‐based study from 1993 to 2017. BJU Int. 2021;128(3):343–351.
- Malm C, Grahn A, Jaremko G, et al. Predicting invasiveness and Disease-Specific survival in upper tract urothelial carcinoma: Identifying relevant clinical tumour characteristics. World J Urol. 2019;37(11):2335–2342.
- Bossuyt PM, Reitsma JB, Bruns DE, STARD Group, et al. Stard 2015: an updated list of essential items for reporting diagnostic accuracy studies. Clin Chem. 2015;61(12):1446–1452. Dec
- Heiden T, Wang N, Tribukait B. An improved hedley method for preparation of Paraffin-Embedded tissues for flow cytometric analysis of ploidy and S-Phase. Cytometry. 1991;12(7):614–621.
- Margulis V, Shariat SF, Matin SF, the Upper Tract Urothelial Carcinoma Collaboration, et al. Outcomes of radical nephroureterectomy: a series from the upper tract urothelial carcinoma collaboration. Cancer. 2009;115(6):1224–1233. Mar 15
- Rosiello G, Palumbo C, Knipper S, et al. Contemporary conditional Cancer-Specific survival after radical nephroureterectomy in patients with nonmetastatic urothelial carcinoma of upper urinary tract. J Surg Oncol. 2020;121(7):1154–1161. Jun
- Rouprêt M, Hupertan V, Seisen T, French National Database on Upper Tract Tumors, et al. Prediction of cancer specific survival after radical nephroureterectomy for upper tract urothelial carcinoma: Development of an optimized postoperative nomogram using decision curve analysis. J Urol. 2013; May189(5):1662–1669.
- Deliveliotis C, Georgoulakis J, Skolarikos A, et al. DNA ploidy as a prognostic factor in muscle invasive transitional cell carcinoma of the bladder. Urol Res. 2005;33(1):39–43.
- Lipponen PK, Eskelinen MJ, Nordling S. Progression and survival in transitional cell bladder cancer: a comparison of established prognostic factors, S-Phase fraction and DNA ploidy. Eur J Cancer. 1991;27(7):877.
- Lipponen PK, Eskelinen MJ, Collan Y, et al. DNA ploidy and S phase fraction in human bladder cancer. Relation to survival and histological grade (who). Urol Int. 1990;45(1):4–9.
- Oldbring J, Hellsten S, Lindholm K, et al. Flow DNA analysis in the characterization of carcinoma of the renal pelvis and ureter. Cancer. 1989;64(10):2141–2145.
- Thalmann GN, Markwalder R, Walter B, et al. Long-Term experience with bacillus Calmette-Guerin therapy of upper urinary tract transitional cell carcinoma in patients not eligible for surgery. J Urol. 2002;168(4 Part 1):1381–1385. Oct
- Schwartzmann I, Pastore AL, Sacca A, et al. Upper urinary tract urothelial carcinoma tumor seeding along percutaneous nephrostomy track: Case report and review of the literature. Urol Int. 2017;98(1):115–119.
- Grahn A, Eisfeldt J, Malm C, et al. Genomic profile - a possible diagnostic and prognostic marker in upper tract urothelial carcinoma. BJU Int. 2022;130(1):92–101.