
ABSTRACT
The Afromontane forests of southwest Ethiopia are high in endemism and biodiversity. However, the increasing human population and expansion of agricultural land have led to deforestation. We evaluated the effects of land use change on species composition, species diversity and soil fertility. Woody and herbaceous plant species were recorded in natural forest, agroforestry and cropland at different altitudes, using 15 plots with three replicates. A total of 90 soil samples were taken. In total, 77 woody and herbaceous species have been recorded. The selective felling of trees and shrubs in the agroforestry system to favor coffee growth through enhanced light penetration also favors grass and herb diversity. A Factor Analysis based on the soil characteristics shows a gradient in soil fertility from both forests and agroforestry to croplands. The bulk density, pH, organic C, total N, available P, cation exchange capacity and base cations saturation of the forest soil are equivalent with that of agroforestry. However, forests and agroforestry are significantly different from croplands regarding those soil characteristics. Therefore, this study suggests that the agroforestry practices are important for keeping biodiversity and soil fertility at levels which are similar to the natural forest.
Introduction
The Afromontane forests of southwest Ethiopia are known for their high biodiversity and endemism of wild plant species (Assefa, Sebsebe, and Zerihun Citation2014; Feyera Citation2006; Gebre-Egziabher Citation1991). The region is the original site providing Coffea arabica L. (Tadesse Citation2003). Inmigration, population growth and expansion of plantation agriculture have led to significant deforestation (e.g. Getahun et al. Citation2013). In this regard, Gibbs et al. (Citation2010) reported that the conversion of natural forest to agriculture exacerbates biodiversity loss, and threatens ecosystem functioning.
The southwestern Ethiopia highlands were covered by dense natural forest at the beginning of 19th century (Kassa et al. Citation2017). However, large parts of the natural forest have been converted to other land use types, mainly to agriculture, agroforestry and settlement land (Kassa et al. Citation2017). For instance, Bonga forest declined by 24% and 28% in between 1967 and 2001, Sheko forest declined by 23% between 1973 and 2005, forests in Bench, Keffa and Sheka declined by 15% between 1973 and 2009, while agriculture land increased by 56% in Bonga; 14% in Bench, Keffa and Sheka between 1973 and 2005 (Kassa et al. Citation2017).
In the upper Gacheb catchment (ca. 450 km2; ), parts of dense montane forest have persisted. However, since the mid-20th century, large parts of this forest have been converted to agroforestry and cropland for mixed plants (cash-food-spice-fruit and legume) and cereal production, as shown in (Dereje Citation2007; Hansen et al. Citation2013). In this regard, several studies in the humid tropics of Africa reported that deforestation has a significant impact on species diversity, composition and ecological function (Gibson et al. Citation2011; Schmitt Citation2006). However, studies reported that the magnitude of the impact on biodiversity and soil varies with climate and land use management practices Gibson et al. Citation2011; Gijsman Citation1992; McCracken et al. Citation2012). For instance, proper land management practice on agriculture land (Gray et al. Citation2014) and agroforestry (Atangana et al. 2013) contributed to significant biodiversity conservation and ecosystem services.
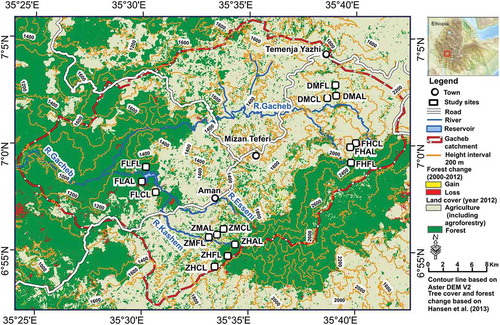
Figure 1. Land cover and location of the study sites in the Gatcheb catchment, southwest Ethiopia.
Most of the previous studies on the impact of deforestation on biodiversity focus on comparing the tree species diversity and composition between forest and cropland (Gibson et al. Citation2011). Yet, little is known about the impact of conversion to agroforestry. Further, little is known about the impact of conversion to cropland and agroforestry on shrub and herb species despite their importance for species diversity and ecosystem functioning (Mulatu, Hunde, and Kissi 2014; Tynsong and Tiwari Citation2010). Therefore, it is fundamental to quantify the impact of deforestation on tree, shrub and herb diversity and soil fertility in the upper reaches of such tropical forest catchments. The objective of this study was therefore: (i) to evaluate the tree, shrub and herb species composition and diversity of forests, agroforestry and croplands, and (ii) to assess the effects of land-use changes on the soil fertility and hence sustainability of the farming systems. The hypothesis was that the biodiversity in agroforestry would be less high than in the forest, but larger than in the cropland. Likewise, it was expected that the soil fertility under agroforestry would be comparable to the one under forest, while it would be less in croplands.
Materials and methods
Study area and data collection
The study area is the upper Gacheb catchment, located in the headwaters of the White Nile in Bench Maji Zone, southwest Ethiopia. Altitudes range from 1000 to 2600 m a.s.l. (, ) and the outcropping lithology comprises Tertiary basalt traps and rhyolites (GSE Citation2005; Mengesha, Tadiwos, and Workineh Citation1996). The annual rainfall pattern is unimodal with a rainy season from mid-March to mid-November. The average annual rainfall depth in Mizan Teferi (1440 m a.s.l.) is 1780 ± 270 mm/year and the annual reference evapotranspiration depth amounts to 1259 ± 12 mm/year (Grieser, Gommes, and Bernardi Citation2006); the average air temperature ranges from 13 to 27°C (Tadesse et al. Citation2006). The harmonized soil map of Africa (Dewitte et al. Citation2013) indicates that Leptosols are dominant on crests, while Nitisols are dominant on the hill slopes (lower, middle and upper parts), to which Alisols and Cambisols are associated locally. Fluvisols are found in the flat valley bottoms, where meandering rivers occur. The dominant texture of the study area is silt (51%), followed by clay (25%) and sand (24%).
Table 1. Location of soil sampling points in the Gacheb catchment, Bench Maji Zone, southwest Ethiopia.
In April and May 2013, vegetation records were made and soil samples were taken. Five study sites (Faketen high (FH), Dakin middle (DM), Zemika high (ZH), Zemika middle (ZM) and Fanika low (FL)) have been selected along three altitudinal transects and stratified according to the land use type (forest, agroforestry, cropland) and three elevation zones (high, 2300–1800 ma.s.l.; middle, 1800–1500 m a.s.l., and low, 1500–1200 m a.s.l.) (; ). In our context deforestation was defined in two ways: Deforestation as complete removal of forest and subsequent change into another land use (i.e. cropland); and forest fragmentation and/or (gradual) detrimental change in density and composition of forest cover (i.e. degraded forest or/and agroforestry). The plots that were under agroforestry and cropland had been under forest 15 to 25 years earlier, as reported by farmers and confirmed by satellite images. The main plots were 20 × 20 m with 3 replications at 20 m interval. Trees with a diameter at breast height > 2 cm and above 1.5 m height were counted inside the 20 × 20 m plots, shrubs were counted in subplots of 5 × 5 m at the four corners of the main plot, and herbaceous species inside 3 × 3 m subplots at the four corners of the main plot. Species which were difficult to be identified in the field were collected, pressed and taken to Mizan-Tepi University for further identification. The species richness (S), that is the number of different species represented in an ecological community, was obtained by simple tallying. The Shannon diversity index and species’ evenness were calculated based on the equations by Magurran (Citation1988):
where, H = the Shannon diversity index, Pi = fraction of the entire population made up of species i, s = numbers of encountered species.
The evenness (E′) was calculated based on:
where, E′ represents evenness, H = Shannon diversity index, Hmax = the maximum level of diversity possible within a given population, which equals lnS.
Topsoil (0–20 cm) samples were collected from each of the 20 × 20 m plots, from where the vegetation sample had been taken (; ). A total of 90 soil samples were taken from all vegetation sampling plots of the three land use types. Separate soil samples were taken at the middle of each plot for soil bulk density determination. Standard analytical procedures were followed in order to determine the soil texture (Sedigraph III plus Particle Size Analyzer), bulk density (using 100 cm3 Kopecky rings), soil pH (1:2.5 H2O), organic carbon contents (Walkley and Black Citation1934), total nitrogen (Kjeldahl method) (Bremner and Mulvaney Citation1982), and available phosphorus (Olsen et al. Citation1954); exchangeable bases (Ca, Mg, K and Na) in the soils were estimated by the ammonium acetate (1M NH4OAc at pH 7) extraction method. The extracted Ca and Mg were then defined utilizing an atomic absorption spectrophotometer. The exchangeable K and Na were measured using a flame photometer. The cation exchange capacity (CEC) was determined by the ammonium acetate method (Hesse Citation1972). The base cation saturation (BS) was calculated based on the standard formula:
Data analysis
Floristic composition and species association of the 15 sites were analyzed based on the frequency of occurrence of all species with a two-way indicator species analysis (TWINSPAN) and a factor analysis with PC-ORD (McCune and Melford Citation2011). We applied TWINSPAN with the following parameters: Cut-off levels set at 0, 2, 5, 10 and 20; the minimum group size for division 5; the maximum number of indicators per division 5, the maximum number of species in the final table. The differences in Shannon species diversity, richness and evenness between the three vegetation groups had been tested by one-way ANOVA using SPSS. The topsoil physico-chemical soil characteristics’ ordination was determined by Factor Analysis (FA) with PC-ORD. Since the soil samples were collected from vegetation recorded plots of three land use types, the Spearman’s correlation analysis was used to evaluate the correlation between the FA axis and the topsoil variables. Whether there are differences in soil physico-chemical characteristics between the forest, agroforestry and cropland at different sites was tested by the one-way analysis of variance (ANOVA) using SPSS (software version 20).
Results
Vegetation characteristics
Overall, 77 plant species belonging to 40 families were recorded in the 45 studied plots. With TWINSPAN, the vegetation could be sorted, classified into evergreen forest, disturbed forest or/and agroforestry and cropland (). Out of the 77 species (trees, shrubs, herbs and grasses), the evergreen forest holds 58 species (75%), belonging to 28 families. However, the disturbed forest or/and agroforestry holds 51 species (66%) belonging to 29 families and cropland 19 species (25%) belonging to 16 families.
Table 2. Frequency of occurrence and species composition in evergreen forest, disturbed forest or/and agroforestry and cropland.
The identification of the common species on the basis of species frequency of occurrence in each vegetation group shows that the evergreen forest holds eight species, which belong to seven families, the disturbed or/and agroforestry holds 15 species which belong to 12 families, whereas the cropland holds seven common species, which belong to five families ().
Table 3. Most common species in the three vegetation groups.
The endemic species identification on the basis of IUCN categories shows that the three vegetation groups in the Gacheb catchment hold endemic species. The evergreen forest holds six endemic species out of which three belong to the category of least concern species, near threatened and vulnerable species under the IUCN species category, whereas the disturbed or/and agroforestry holds two endemic species which belongs to the vulnerable and least concern species category of IUCN. The cropland holds one endemic species which belongs to least concern species category of IUCN ().
Table 4. Endemic plant species on the three vegetation groups in Gacheb catchment. (IUCN categories; CR = Critically endangered; EN = Endangered; VU = Vulnerable NT = Near Threatened; LC = Least Concern; NE = Not Evaluated.)
The Shannon species’ diversity index for trees of the evergreen forest (2.3) is significantly different from disturbed forest or/and agroforestry (2.0) (P < 0.05), as well as from the cropland (0.5) (P < 0.00001). The Shannon’s diversity index for shrubs in the evergreen forest (1.9) is significantly different from the disturbed forest or/and agroforestry (1.1) (P < 0.001), as well as from cropland (0.7) (P < 0.00001). The Shannon species’ diversity index for herbs in the evergreen forest (2.2) is similar to the disturbed forest or/and agroforestry (2.0). However, the Shannon’s index for herbs in evergreen forest is significantly different from that for cropland (1.8) (P < 0.005). Similarly, the tree, shrub and herb Shannon’s diversity index of the disturbed forest or/and agroforestry is significantly different from cropland (P < 0.01). In contrast, the tree, herb and total species’ richness and evenness in the disturbed forest or/and agroforestry is similar to the evergreen forest’s. However, the tree and herb richness, tree evenness and total species richness and evenness of the evergreen forest is significantly different from that of cropland ().
Table 5. Vegetation indices of evergreen forest, disturbed forest or/and agroforestry and cropland.
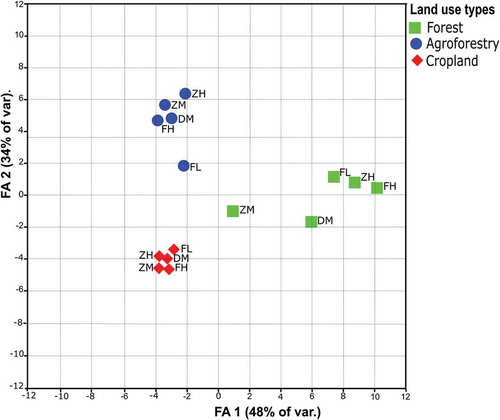
The ordination, based on the FA analysis of frequency of occurrence of all species shows differences in species composition between the three land use types. The first FA axis (48% of the variance) corresponds to a gradient from the evergreen forest to the disturbed forest or/and agroforestry and a gradient from the evergreen forest to cropland. The second FA axis (34%) matches a gradient from the disturbed forest or/and agroforestry to cropland; and a gradient from the evergreen forest to cropland. However, the disturbed forest or/and agroforestry and evergreen forest were similar (). Further, the second FA shows that the forest in middle elevation (ZM and DM) are different from the forests at high and low elevations (FH, ZH and FL) ().
Figure 2. Ordination of the study sites with FA based on the vegetation composition in the three land use types at 5 topographic positions: FH = Faketen high, DM = Dakin middle, ZH = Zemika high, ZM = Zemika middle and FL = Fanika low. The first (FA 1) and second FA axes (FA 2) of the vegetation composition explain 82% of the variation between individual sites.
Comparison between the three land- use types soil characteristics
The biplots of the topsoil show that the first factor axis (FA-1) corresponds to a gradient of plots from forest to cropland, whereby the plots under agroforestry are similar to those under forest. The soil physico-chemical characteristics N, pH, Mg2+, Ca2+, P and CEC are also higher under forest and agroforestry than under cropland. Most importantly, all cropland topsoils are sandy, but soil organic carbon is low in some and high in other cropland. The second factor axis (FA-2) is independent from the gradient between forest and cropland. This sets aside the three plots studied at low elevation (FL site) that have lower soil organic carbon than the high (FH and ZH) and middle elevation (DM and ZM) sites. This corresponds to a gradient from high soil organic carbon to low soil organic carbon ().
Figure 3. Biplot of topsoil physico-chemical characteristics of 5 study sites. Land use types: forest, agroforestry and cropland. Study sites: FH = Faketen high, DM = Dakin middle, ZH = Zemika high, ZM = Zemika middle and FL = Fanika low. Soil physico-chemical characteristics: BD = bulk density, Soil texture (sand, silt and clay), OC = organic carbon, N = total nitrogen, CEC = cation exchange capacity, P = available phosphorus, K = available potassium, Mg = exchangeable magnesium, Ca = exchangeable calcium, N a = exchangeable sodium. The arrow represents the direction of high weighting of soil physico-chemical characteristics in the first factor axis (FA-1) and in the second factor axis (FA-2). The first and second PCA of the topsoil explains 87% of the variation between individuals.
Topsoil characteristics in relation to vegetation
The Spearman’s correlation coefficient was determined for the vegetation FA axes and soil variables (). The first FA axis of the vegetation, which corresponds to the gradient from forest to agroforestry and forest to cropland, is significantly correlated with the clay content (0.41), organic carbon (0.43), nitrogen (0.57), exchangeable sodium (0.56), potassium (0.46), calcium (0.52), magnesium (0.47), cation exchange capacity (0.51), bulk density (−0.53) and sand (−0.59) (P < 0.05) (). The second FA axis, which corresponds to a gradient from agroforestry to cropland and forest to cropland, is significantly correlated with the clay (0.45), bulk density (−0.39), organic carbon (−0.43), nitrogen (0.5), available phosphorus (0.43), exchangeable potassium (0.38), exchangeable calcium (0.51) (). Overall, the first and second FA share the same significant correlation with clay, BD, OC, N, K and Ca. However, sand, Na, Mg and CEC are only significant in the first FA axis, whereas P is only significant in the second FA ().
Table 6. Spearman’s correlation between FA axes of the vegetation and soil variables.
The soil texture, as expressed by the proportion of sand, silt and clay, shows variation among the land use classes. The topsoil sand content was significantly higher in cropland (36%) than in forest (20%) and agroforestry (22%) (P < 0.0001) at the ZH site. Similar high sand fractions were recorded on cropland at the FH, DM, ZM and FL sites. The proportion of clay in forest soils (25%) is significantly higher than in agroforestry (23%) (P < 0.01) and cropland (14%) (P < 0.0001) at ZH. Similar high clay fractions have been recorded at all sites. The soil bulk density in cropland (1.2 g/cm3) is considerably larger than in both the forest (0.9 g/cm3) and agroforestry (0.9 g/cm3) (P < 0.0001) at ZH site and similar high soil bulk density was recorded on the cropland at all other sites ().
Figure 4. Soil physico-chemical characteristics of the top soil (0 – 20 cm) under cropland, agroforestry and forest. Mean values with different letters at the same site are significantly different from each other (p < 0.05). Sites: FH = Faketen high; DM = Dakin middle; ZH = Zemika high; ZM = Zemika middle; FL = Fanika low.
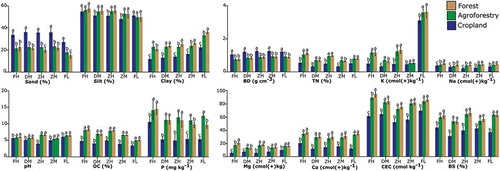
The total nitrogen (0.96%), soil pH (5.7), organic carbon (7.9%), available phosphorus (10.9 mg/kg), exchangeable magnesium (30 cmol/kg) and calcium (18 cmol/kg) contents of forest soil are significantly higher in comparison to the cropland at the ZH sites. Similar significant differences were recorded at all sites. However, the agroforestry is similar in those soil characteristics with the natural forest (). Similarly, higher soil cation exchange capacity (75 cmol/kg and 72 cmol/kg) was recorded in forest and agroforestry respectively, yet less in cropland soils (52 cmol/kg) at ZH, a trend that is representative for all sites. Like the CEC, larger base saturation was recorded in both the forest (66%) and agroforestry soils (64%) at the ZH site. Likewise, a higher BS was recorded in the forest and agroforestry at all other sites ().
Discussion
Vegetation patterns
The vegetation composition of woody and herbaceous plants reveals the presence of indigenous, modified and planted vegetation at the study sites. The evergreen forest group is state-managed natural and plantation forest, which fundamentally resembles in species richness and composition the Afromontane rainforests and the transitional rainforest of southwest Ethiopia (Friis Citation1992). The disturbed forest or/and agroforestry vegetation group is farmer-owned modified and planted vegetation, which corresponds to the semi-forest coffee, forest coffee (Schmitt Citation2006) and home garden agroforestry (Bishaw and Abdelkadir Citation2003). The cropland vegetation group is farmer-owned planted vegetation, which corresponds to the recently introduced cereal-based farming system (Mekuria Citation2005).
The number of common species in the disturbed or/and agroforestry group is 30% higher than in the evergreen forest and 36% higher than in cropland. This is due to the presence of commonly adopted crops (coffee, fruits, shade trees and food crops (e.g. enset, taro and cabbage)) in the agroforestry land. Similarly, Cruz-Angón, Sillett, and Greenberg (Citation2008) reported high numerical dominance of common species in agroforestry compared to natural forest. Yet, both evergreen and disturbed or/and agroforestry groups have 33% similarity in common species. This reveals the role of disturbed or/and agroforestry groups in conservation of indigenous species in the agroforestry system. Similarly, Vallejo-Ramos, Moreno-Calles, and Casas (Citation2016) reported the conservation of indigenous species in agroforestry.
The presence of a relatively larger number of endemic species in evergreen forest reveals the importance of the evergreen forest in conservation of endemic species, in line with observations by Feyera (Citation2006) and Schmitt (Citation2006) elsewhere in the Afromontane forest of southwest Ethiopia. The disturbed or/and agroforestry have a relatively medium number of endemic species, yet implies that the disturbed forest or/and agroforestry play an important role in conservation of endemic species. In contrast, García‐Fernández, Casado, and Pérez (Citation2003) and Laurance et al. (Citation2006) reported high loss and poor endemic species in agroforestry. The presence of a low number of endemic species in cropland is attributed to management intervention.
The difference in tree species Shannon’s diversity index between forest and disturbed forest or/and agroforestry reveals the occurrence of management interventions for coffee productivity: farmers selectively felled trees to enhance light exposure for the coffee plants, in line with findings by Mengistu and Asfaw (Citation2016), Schmitt (Citation2006) and Steffan-Dewenter et al. (Citation2007).
The occurrence of relatively lower values for shrub species Shannon diversity index, richness and evenness under the disturbed forest or/and agroforestry (as compared to the evergreen forest), as also observed by Hall, Gillespie and Mwangoka (2011) and Schmitt (Citation2006), may be related to the dominance of coffee and the removal of competing shrubs. In contrast, the herb species Shannon diversity index and richness under the disturbed forest or/and agroforestry is similar to the evergreen forest’s. This can be due to the fact that the removal of herbs, which is less frequent than the removal of shrubs, is offset by the enhanced light exposure and the nutrient contents of these soils. Kessler et al. (Citation2012) and Steffan-Dewenter et al. (Citation2007) found an even greater herb species diversity and richness under agroforestry than under the natural forest in a nearby study area.
The cropland has lower tree, shrub and herb species Shannon diversity indeces and richness, which is related to the dominance of maize cropping and defined management interventions. This study coincides with the findings of Tadesse (Citation2007), who discussed the dominance of this single cereal crop and the cultivation of monocultures in the study area.
Interactions between vegetation and topsoil characteristics of the land use
The influence of vegetation and its litter on topsoil characteristics has been observed by authors such as Aweto (Citation2013), Ruggiero et al. (Citation2002) or Runyan, D’Odorico, and Lawrence (Citation2012), and is evidenced here by the strong correlation between the first and second FA axes and these topsoil characteristics. Furthermore, forest and agroforestry are distinct in vegetation composition, as reflected by the first FA axis of vegetation and by Shannon’s index (i.e. tree and shrub life forms) (). Nevertheless, forest and agroforestry exhibit an equivalent topsoil fertility, since clay, OC, N, K, Ca, Na, Mg, CEC and BS were both significantly higher in both forest and agroforestry. This implies that the tree species composition in agroforestry plays a significant role in soil fertility restoration and maintenance. Particularly the presence of a large number of leguminous plants (Albizia gummifera, Millettia ferruginea, Sesbania sesban, and Leucaena leucocephala) in the agroforestry of the study area (), has enhanced the nutrient cycling and litter decomposition, as also highlighted by Sharma (Citation2011).
The presence of relative higher clay, pH, OC, N, P, CEC and BS both under forest and agroforestry is most likely related to high organic matter contents, linked to the litter fall from the trees and the protection from soil erosion provided by the trees. Islam and Weil (Citation2000) and Nsabimana et al. (Citation2008) have already demonstrated that forests play an important role in the improvement of soil pH, OC, N, P, CEC, BS and in reducing the risk of soil erosion by its crown, litter and root support. The corresponding lower values of these properties in cropland may be related to a decline in organic matter due to the continuous cultivation without supplementary input, loss by leaching and soil erosion, as shown by Nardi, Concheri, and Dell’Agnola (Citation1996) and Poudel and West (Citation1999). Also, the higher bulk density in cropland can be attributed to the low aggregate stability, because of the lower organic carbon contents, as shown by Islam and Weil (Citation2000).
Conclusion
The presence of relatively high tree, shrub and herb species Shannon’s diversity indices (and richness in the disturbed forest or/and agroforestry vegetation group) is a sign of potential indigenous vegetation restoration and conservation in the study area. This biodiversity in both the evergreen forest and the disturbed forest or/and agroforestry also determines good topsoil fertility. Remarkably, the topsoil fertility under disturbed forest or/and agroforestry is equivalent to the natural forest’s, while the species composition, diversity and richness (for trees, shrubs and herbs) and soil fertility under cropland are much lower. Most importantly, both forest and agroforestry are conserving endemic plant species that are listed in the endangered category of IUCN. Therefore, in the upper Gacheb catchment and most probably in the larger part of southwest Ethiopia- agroforestry plays a similar role in forest biodiversity sustenance, conservation and topsoil fertility maintenance. Inversely, cereal-based open field cropping shows a negative impact on species composition and diversity, as well as on soil fertility.
Funding
This work was supported by the Netherlands Organization for International Cooperation in Higher Education(Strongbow Project).
Additional information
Funding
References
- Assefa, A., D. Sebsebe, and W. Zerihun. 2014. Floristic composition, structure and regeneration status of Masha forest, south-west Ethiopia. African Journal of Ecology 52:151–62.
- Atangana, A., D. Khasa, S. Chang, and A. Degrande. 2014. Major agroforestry systems of the humid tropics. In Tropical Agroforestry, 49–93. Netherlands: Springer.
- Aweto, A. O. 2013. Shifting cultivation and secondary succession in the Tropics. Wallingford, UK: Technology and Engineering, CABI.
- Bishaw, B., and A. Abdelkadir. 2003. Agroforestry and Community Forestry for Rehabilitation of Degraded Watersheds on the Ethiopian Highlands. Paper presented at the International Conference on Contemporary Development Issues, July 11–12, Addis Ababa, Ethiopia.
- Bremner, J. M., and C. S. Mulvaney. 1982. Nitrogen-Total. In Methods of soil analysis, eds A. L. Page, R. H. Miller, and D. R. Keeney, 595–624. Madison, USA: ASA-SSSA.
- Cruz-Angón, A., T. S. Sillett, and R. Greenberg. 2008. An experimental study of habitat selection by birds in a coffee plantation. Ecology 89:921–27.
- Dereje, T. 2007. Forest cover change and socio-economic drivers in southwest Ethiopia. Doctoral dissertation, MSc. thesis, University of Munchen, Germany.
- Dewitte, O., A. O. Jones, H. Spaargaren, M. Breuning-Madsen, A. Brossard, J. Dampha, T. Deckers, S. Gallali, R. Hallett, M. Jones, P. Kilasara, E. Le Roux, L. Michéli, L. Montanarella, E. Thiombiano, M. Van Ranst, A. Yemefack, and R. Zougmore. 2013. Harmonization of the soil map of Africa at the continental scale. Geoderma 211–212:138–53.
- Feyera, S. 2006. Biodiversity and ecology of Afromontane rainforests with wild Coffea arabica L. populations in Ethiopia. Doctoral Thesis, ZEF-Ecology and Development Series, University of Bonn, Germany.
- Friis, I. 1992. Forests and forest trees of Northeast Tropical Africa: Their naturalhabitats and distribution patterns in Ethiopia, Djibouti and Somalia. London: Royal Botanical Gardens, Kew Bulletin Additional Series XV.
- García‐Fernández, C., M. A. Casado, and M. R. Pérez. 2003. Benzoin gardens in North Sumatra, Indonesia: Effects of management on tree diversity. Conservation Biology 17:829–36.
- Gebre-Egziabher, T. 1991. Diversity of the Ethiopian Flora. In Plant genetic resources of Ethiopia, eds. J. M. M. Engels, J. G. Hawkes, and M. Worede, 75–81. Cambridge, UK: Cambridge University Press.
- Getahun, K., A. Van Rompaey, P. Van Turnhout, and J. Poesen. 2013. Factors controlling patterns of deforestation in moist evergreen Afromontane forests of Southwest Ethiopia. Forest Ecology and Management 304:171–81.
- Gibbs, H. K., A. S. Ruesch, F. Achard, M. K. Clayton, P. Holmgren, N. Ramankutty, and J. A. Foley. 2010. Tropical forests were the primary sources of new agricultural land in the 1980s and 1990s. Proceedings of the National Academy of Sciences 107:16732–37.
- Gibson, L., T. M. Lee, L. P. Koh, B. W. Brook, T. A. Gardner, J. Barlow, C. A. Peres, C. J. Bradshaw, W. F. Laurance, T. E. Lovejoy, and N. S. Sodhi. 2011. Primary forests are irreplaceable for sustaining tropical biodiversity. Nature 478:378.
- Gijsman, A. J. 1992. Deforestation and land use: Changes in physical and biological soil properties in relation to sustainability. Wageningen: Tropenbos Foundation.
- Gray, C. L., E. M. Slade, D. J. Mann, and O. T. Lewis. 2014. Do riparian reserves support dung beetle biodiversity and ecosystem services in oil palm-dominated tropical landscapes? Ecology and Evolution 4(7):1049–1060.
- Grieser, J., R. Gommes, and M. Bernardi. 2006. New LocClim–the local climate estimator of FAO. In Geophysical research abstracts, 8: 08305. EGU.
- GSE, 2005. Geology of Ethiopia, with vectorised geological map. Ethiopian ministry of mines, geological survey of Ethiopia. Accessed January 12, 2016. http://extra.geus.info/cet/ethiopia/Ethiopia_Map.pdf.
- Hall, J. M., T. W. Gillespie, and M. Mwangoka. 2011. Comparison of agroforests and protected forests in the East Usambara Mountains, Tanzania. Environmental Management 48:237–47.
- Hansen, M. C., P. V. Potapov, R. Moore, M. Hancher, S. Turubanova, S. Tyukavina, D. Thau, S. V. Stehman, S. J. Goetz, T. R. Loveland, and A. Kommareddy. 2013. High-resolution global maps of 21st-century forest cover change. Science 342:850–53.
- Hesse, P. R. 1972. A textbook of soil chemical analysis. New York, USA: Chemical publishing Co.
- Islam, K. R., and R. R. Weil. 2000. Land use effects on soil quality in a tropical forest ecosystem of Bangladesh. Agriculture, Ecosystems & Environment 79:9–16.
- Kassa, H., S. Dondeyne, J. Poesen, A. Frankl, and J. Nyssen. 2017. Transition from forest‐based to cereal‐based agricultural systems: A review of the drivers of land use change and degradation in Southwest Ethiopia. Land Degradation & Development 28:431–49.
- Kessler, M., D. Hertel, H. F. Jungkunst, J. Kluge, S. Abrahamczyk, and M. Bos. 2012. Can joint carbon and biodiversity management in tropical agroforestry landscapes be optimized? PLoS ONE 7:e47192.
- Laurance, W. F., H. E. Nascimento, S. G. Laurance, A. Andrade, J. E. Ribeiro, J. P. Giraldo, T. E. Lovejoy, R. Condit, J. Chave, K. E. Harms, and S. D’Angelo. 2006. Rapid decay of tree-community composition in Amazonian forest fragments. Proceedings of the National Academy of Sciences 103:19010–14.
- Magurran, A. E. 1988. Ecological diversity and its measurement. London: Chapman and Hall.
- McCracken, D. I., L. J. Cole, W. Harrison, and D. Robertson. 2012. Improving the farmland biodiversity value of riparian buffer strips: Conflicts and compromises. Journal of Environmental Quality 41:355–63.
- McCune, B., and M. J. Melford. 2011. PC-ORD. Multivariate analysis of ecological data. Version 6.0.MjM software, Gleneden Beach, Oregon, USA.
- Mekuria, A. 2005. Forest conversion-Soil degradation-Farmers’ Perception Nexus: Implications for sustainable land use in the Southwest of Ethiopia. Doctoral Thesis, ZEF-Ecology and Development Series, University of Bonn, Germany.
- Mengesha, T., C. Tadiwos, and H. Workineh. 1996. Explanation of the geological map of Ethiopia. Scale 1:2.000.000. Addis Ababa: Ethiopian Institute of Geological Survey Bull, ed. EIGS.
- Mengistu, B., and Z. Asfaw. 2016. Woody species diversity and structure of agroforestry and adjacent land uses in Dallo Mena district, South-East Ethiopia. Natural Resources 7(10): 515–34.
- Mulatu, K., D. Hunde, and E. Kissi. 2014. Impacts of wetland cultivation on plant diversity and soil fertility in South-Bench District, Southwest Ethiopia. African Journal of Agricultural Research 9:2936–47.
- Nardi, S., G. Concheri, and G. Dell’Agnola. 1996. Biological activity of humus. Humic substances in terrestrial ecosystems, 361–406. Amsterdam: Elsevier.
- Nsabimana, D., L. Klemedtson, B. A. Kaplin, and G. Wallin. 2008. Soil carbon and nutrient accumulation under forest plantations in southern Rwanda. African Journal of Environmental Science and Technology 2:142–49.
- Olsen, S. R., C. V. Cole, F. S. Watanabe, and L. A. Dean. 1954. Estimation of available phosphorus in soil by extraction with sodium bicarbonate. Washington, DC, USA: U.S. Department of Agriculture.
- Poudel, D. D., and L. T. West. 1999. Soil development and fertility characteristics of a volcanic slope in Mindanao, the Philippines. Soil Science Society of America Journal 63:1258–73.
- Ruggiero, P. G. C., M. A. Batalha, V. R. Pivello, and S. T. Meirelles. 2002. Soil-vegetation relationships in cerrado (Brazilian savanna) and semideciduous forest, Southeastern Brazil. Plant Ecology 160:1–16.
- Runyan, C. W., P. D’Odorico, and D. Lawrence. 2012. Physical and biological feedbacks of deforestation. Review of Geophysics 50.
- Schmitt, C. B., 2006. Montane rainforest with wild Coffea arabica in the Bonga region, South West Ethiopia: Plant diversity, wild coffee management and implications for conservation. Doctoral Thesis, ZEF-Ecology and Development Series, University of Bonn, Germany.
- Sharma, K. L. 2011. Effect of agroforestry systems on soil quality–monitoring and assessment. Accessed March 10, 2016. http://www.crida.in/DRM1-WinterSchool/KLS.pdf.
- Steffan-Dewenter, I., M. J. Kessler, M. M. Barkmann, D. Bos, H. Buchori, S. Erasmi, G. Faust, K. Gerold, S. R. Glenk, E. Gradstein, and E. Guhardja. 2007. Tradeoffs between income, biodiversity, and ecosystem functioning during tropical rainforest conversion and agroforestry intensification. Proceedings of the National Academy of Sciences 12:4973–78.
- Tadesse, M., B. Alemu, G. Bekele, T. Tebikew, J. Chamberlin, and T. Benson. 2006. Atlas of the Ethiopian rural economy. Addis Ababa, Ethiopia: CSA and IFPRI.
- Tadesse, W. 2003. Vegetation Ecology of the Yayu forest in SW Ethiopia: Impacts of human use and implications for in situ conservation of wild Coffea arabica L. populations. Germany: Ecology and Development Series, University of Bonn.
- Tadesse, W. 2007. The impacts of land use/land cover changes on biodiversity in Mash and Anderacha Woredas of Sheka Zone, SNNP Regional State. In Forests of Sheka: Multidisciplinary case studies on impact of land use/land cover change, ed. M. Fetene. Addis Ababa: MELCA Mahiber.
- Tynsong, H., and B. K. Tiwari. 2010. Diversity of plant species in arecanut agroforests of south Meghalaya, north-east India. Journal of Forestry Research 21:281–86.
- Vallejo-Ramos, M., A. I. Moreno-Calles, and A. Casas. 2016. TEK and biodiversity management in agroforestry systems of different socio-ecological contexts of the Tehuacán Valley. Journal of Ethnobiology and Ethnomedicine 12:31.
- Walkley, A., and I. A. Black. 1934. An examination of the degtjareff method for determining soil organic matter and a proposed modification of the chromic acid titration method. Soil Science 37:29–38.