
ABSTRACT
Colonic epithelial cells move up along the crypt villus axis and are differentiated into absorptive or secretory cells. Claudin-7 (CLDN7), a tight junctional protein, is mainly located at the surface of crypt, whereas CLDN2 is located at the bottom. However, the expression mechanism and function of these CLDNs are not fully understood. The expression levels of CLDN2 and CLDN7 were altered depending on the culture days in MCE301 cells derived from mouse colon. The nuclear levels of transcriptional factors p53 and hepatocyte nuclear factor 4α (HNF4α) at day 21 were higher than those at day 7. Tenovin-1 (TEN), a p53 activator, increased the nuclear levels of p53 and HNF4α. The mRNA level and promoter activity of CLDN7 were increased by TEN, whereas those of CLDN2 were decreased. The changes of CLDNs expression were inhibited by p53 and HNF4α siRNAs. The association between p53 and HNF4α was elevated by TEN. In addition, the binding of p53 and HNF4α to the promoter region of CLDN2 and CLDN7 was enhanced by TEN. Transepithelial electrical resistance was decreased by TEN, but paracellular fluxes of lucifer yellow and dextran were not. In the Ussing chamber assay, TEN increased dilution potential and the ratio of permeability of Cl− to Na+. Both p53 and HNF4α were highly expressed at the surface of mouse colon crypt. We suggest that p53 and HNF4α alter the paracellular permeability of Cl− to Na+ mediated by the inverse regulation of CLDN2 and CLDN7 expression in the colon.
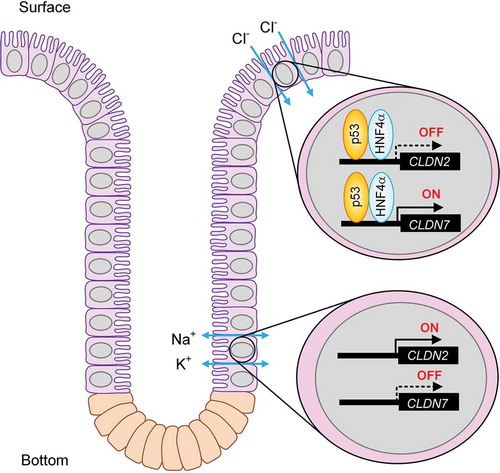
GRAPHICAL ABSTARCT
Introduction
The major function of the colon is the construction of favorable environment for the growth of colonic microorganisms, storage reservoir of fecal matter, and absorption and secretion of mineral ions from the lumen. The wall of the colon is composed of four layers of the serosa, muscularis propria, submucosa, and mucosa.Citation1 The mucosa of large intestine has many crypts of Lieberkühn; however unlike the small intestine, there are no villi. Stem cells are found near the bottom of the crypts and differentiated to epithelial cells during moving up toward the luminal surface.Citation2 The bottom of crypt consisting of undifferentiated cells functions as secretory mode of NaCl, whereas the middle and surface cells play a role in absorptive mode in the distal colon.Citation3
Mineral ions such as sodium, potassium, and chloride are transported through the differentiated epithelial cells of the crypts. The absorption/secretion rates vary according to their concentration in the lumen and electrochemical gradient.Citation4 In addition to the transcellular pathway through specific transporters and channels expressed in the apical and basolateral membrane, mineral ions can pass through the paracellular route in the epithelial monolayer.Citation5
Tight junctions (TJs) are cell-cell adhesion complexes and located at the most upper region of the lateral membrane of epithelial cells. The TJs compose a large complex including the membrane integral proteins such as claudins (CLDNs), occludin, and junctional adhesion molecules, and the scaffolding proteins such as zonula occludens (ZO)-1, ZO-2, and ZO-3.Citation6 So far, over twenty CLDN subtypes have been identified and their expression pattern is specific for each tissue. CLDN1, 2, 3, 4, 7, 8, 9, 12, 14, 15, 17, 20, and 23 are endogenously expressed in the colon.Citation7 Paracellular permeability to ions are different in each CLDNs. CLDN1 and 3 do not form ion-permeable pore.Citation8 CLDN2 and 15 make cation permeable pore,Citation9,Citation10 whereas CLDN4 and 7 make anion permeable pore.Citation11 We recently reported that CLDN2 and CLDN7 are localized at the bottom and surface of crypt in mice, respectively.Citation12,Citation13 Knockdown experiments show that CLDN2 and CLDN7 form cation pore and Cl− pore in MCE301 cells derived from mouse colon, respectively. Therefore, both CLDN2 and CLDN7 may be involved in the regulation of mineral ions homeostasis. So far, hepatocyte nuclear factor 4α (HNF4α) has been reported to be involved in the regulation of CLDN7 expression during intestinal epithelial differentiation.Citation14 However, the regulatory mechanism of inverse expression of CLDN2 and CLDN7 in the crypts has not been clarified well.
The transcription factor p53 is known as a negative regulator of the cell cycle and a tumor suppressor. p53 has very short half-life in normal cells and the function is tightly controlled by its protein stability. The degradation of p53 is regulated by the ubiquitin-proteasome system.Citation15 Murine double minute 2, an E3 ubiquitin ligase, binds to the transcriptional activation domain of p53 and blocks its transactivation activity in the proliferative and cancer cells. Once activated, p53 selectively turns on the transcriptional activity of its target genes that function in cell cycle arrest, DNA damage repair, or apoptosis. Microarray analysis shows that TP53, a gene which codes for p53, is highly expressed in the basal crypt,Citation16 but the involvement of p53 in the regulation of CLDNs expression has not been investigated.
In the present study, we found that the mRNA level of CLDN2 reaches at the peak on day 7 and gradually declines, whereas that of CLDN7 is elevated depending on the culture days in MCE301 cells derived from mouse colon. The nuclear levels of p53 and HNF4α were increased depending on the culture days. Therefore, we investigated whether both p53 and HNF4α are involved in the regulation of CLDN2 and CLDN7 expression. The mRNA level, protein level, transcriptional activity, and cellular localization were examined by real time polymerase chain reaction (PCR), Western blotting, promoter assay, and immunofluorescence measurement, respectively. In addition, the function of CLDN2 and CLDN7 was estimated by transepithelial electrical resistance (TER), paracellular permeability to lucifer yellow (LY), and dilution potential assay. Our data indicate that the expression of CLDN2 and CLDN7 may be inversely regulated by the complex of p53 and HNF4α in the colon.
Materials and methods
Materials
Anti-CLDN2 and anti-CLDN7 antibodies were obtained from Thermo Fisher Scientific (Waltham, MA, USA). Anti-HNF4α and anti-p53 antibodies were from Cell Signaling Technology (Beverly, MA, USA). Anti-nucleoporin p62 and anti-β-actin antibodies were from Becton Dickinson Biosciences (San Jose, CA, USA) and Santa Cruz Biotechnology (Santa Cruz, CA, USA), respectively. Tenovin-1 (TEN) was from Cayman Chemical (Ann Arbor, MI, USA). FITC-labeled dextran MW 4,000 (FD4) and MW 20,000 (FD20) were Sigma-Aldrich (St. Louis, MO, USA). All other reagents were of the highest grade of purity available.
Cell culture
Mouse colonic MCE301 cell line was established by Tabuchi et al.Citation17 Cells were grown in Dulbecco’s Modified Eagle’s Medium (FUJIFILM Wako Pure Chemical, Osaka, Japan) supplemented with fetal calf serum, 0.07 mg/ml penicillin-G potassium, and 0.14 mg/ml streptomycin sulfate in a 5% CO2 atmosphere at 37°C. The cultured cells were imaged using differential interference contrast (DIC) by an inverted EVOS M5000 microscope (Thermo Fisher Scientific). The confluency was measured using software attached to the device and represented as percentage of covered area.
Animals and tissue preparation
Male C57BL/6JJcl mice (8 weeks) were obtained from CLEA Japan SLC (Tokyo, Japan). All animal experiments were approved by the Animal Care and Use Committee of the University of Shizuoka (No.195236), and conducted in accordance with the Guidelines and Regulations for the Care and Use of Experimental Animals by the University of Shizuoka. The mucosal-submucosal preparation, consisting of the mucosa, muscularis mucosa, and submucosal layers was obtained as described previously.Citation12
RNA isolation and quantitative RT-PCR
The colon crypt of mice was divided into three segments and named as surface, middle, and bottom. Total RNA was isolated from the colon crypt or MCE301 cells using ISOGEN II (NIPPON GENE, Toyama, Japan). Reverse transcription and real time PCR were carried out as described previously.Citation12 The primer pairs are listed in .
Table 1. Primer pairs for real time PCR
Immunofluorescence
The segments of mouse distal colon and MCE301 cells were prepared and immunostained as described previously.Citation12 The samples were incubated with anti-CLDN2, anti-CLDN7, anti-p53, or anti-HNF4α antibody (1:100) for 16 h at 4°C. They were then incubated with Alexa Fluor 488- or 549-conjugated antibodies (1:100) including 4ʹ,6-diamidino-2-phenylindole (DAPI) for 1.5 h at the room temperature. Immunolabelled cells were visualized on LSM 700 confocal microscope (Carl Zeiss, Oberkochen, Germany). The degree of cellular localization was calculated using ImageJ software (http://rsbweb.nih.gov/ij/index.html).
SDS-polyacrylamide gel electrophoresis (SDS-PAGE) and immunoblotting
The cytoplasmic extracts including plasma membrane and cytosolic proteins were prepared from MCE301 cells. Nuclear extracts were prepared using NE-PER nuclear and cytoplasmic extraction reagents (Thermo Fisher Scientific) according to the manufacturer’s instructions. In immunoprecipitation assay, protein G-sepharose beads were incubated with the cytoplasmic extracts and anti-p53 or anti-HNF4α antibody. Samples were applied to SDS-PAGE and blotted onto a polyvinylidene fluoride membrane. Western blotting was performed as described previously.Citation12 The band intensity of each protein was quantified by ImageJ. The expression of proteins in cytoplasmic and nuclear extracts were normalized by β-actin and nucleoporin p62, respectively.
Luciferase reporter assay
The reporter vectors of the CLDN2 and CLDN7 gene were made as described previouslyCitation18 and gifted from Dr. Ikenouchi (Kyushu University, Japan), respectively. A Renilla construct, pRL-TK vector (Promega), was used for normalizing transfection efficiency. Cells were transfected with plasmid DNA using HilyMax (Dojindo laboratories, Kumamoto, Japan). Luciferase reporter activity was measured as described previouslyCitation12 and represented relative to control.
Chromatin immunoprecipitation-quantitative PCR (ChIP-qPCR) assay
ChIP-qPCR assay was carried out as described previously.Citation18 To co-immunoprecipitate the DNA, anti-p53 and anti-HNF4α antibodies were used. The eluted DNA was amplified by quantitative real time PCR. The primer pairs are listed in . Values were normalized by input DNA and represented relative to control.
Table 2. Primer pairs for ChIP-qPCR assay
Paracellular permeability
Cells were cultured on transwells with polyester membrane inserts (Corning Incorporated-Life Sciences, Acton, MA). Paracellular permeability was estimated by TER and the paracellular diffusion of LY (MW 457), FD4, and FD20. An apparent permeability coefficient (Papp) was calculated as the following equation.
Papp (cm/s) = (dC/dt) x V/C0/A
Whereby dC/dt is the change of basal concentration for 30 min (μg/ml/s); V is the volume of the chamber, C0 is the initial concentration of LY, FD4, and FD20 in the apical solution, and A is the area of the chambers (cm2).
Dilution potential and PCl/PNa was measured by Ussing chamber assay as described previously.Citation13 In brief, both apical and basal chambers were filled with Hank’s Balanced Salt Solution (HBSS). Amiloride (100 μM), niflumic acid (100 μM), and 4,4ʹ-diisothiocyanatostilbene-2,2ʹ-disulfonic acid (100 μM) were added to the solution to block the effects of transcellular ion transport of Na+ and Cl− channels. To measure dilution potential, the basal HBSS was replaced with HBSS containing half NaCl concentration in which osmolarity was balanced with mannitol. PCl/PNa was calculated as described elsewhere.Citation19
Statistical analysis
Results are presented as means ± S.E.M. Differences between groups were analyzed with a one-way analysis of variance, and corrections for multiple comparison were made using Tukey’s and Dunnett’s multiple comparison tests. Comparisons between two groups were made using Student’s t test. Significant differences were assumed at p < .05.
Results
Effects of culture periods on CLDNs and transcriptional factors expression
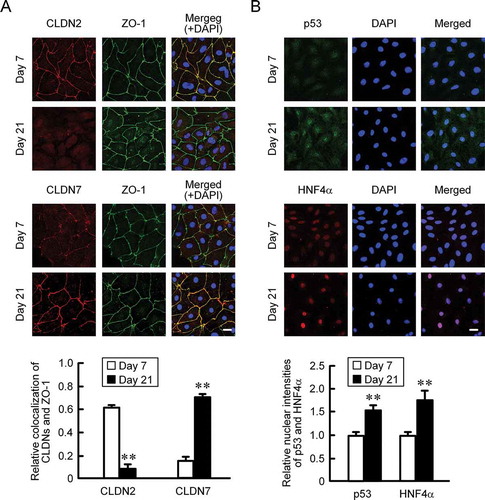
MCE301 cells were cultured for 1, 7, 14, 21, and 28 days. The cell confluency was calculated using DIC images (). Cells reached at confluent state at day 7 after plating. The mRNA levels of CLDN2 and CLDN7 were examined by real-time PCR measurement. The mRNA level of villin-1, a marker of differentiated cells, was increased, whereas that of Lgr5, a maker of undifferentiated cells, was decreased depending on the culture periods (). The mRNA level of CLDN2 was peaked at day 7 and decreased depending on the culture periods. In contrast, that of CLDN7 was gradually increased. Immunofluorescence analysis showed that the signal of CLDN2 co-localized with ZO-1 was decreased at day 21, whereas that of CLDN7 was increased (). The florescence signals of nuclear p53 and HNF4α were slightly detected in the nuclei at day 7, and they were significantly increased at day 21 (). These results indicate that the expression of CLDN2 and CLDN7 may be regulated by p53 and HNF4α.
Figure 1. Effects of culture periods on CLDNs expression. (a) MCE301 cells were cultured for 1, 7, 14, 21, 28 days. DIC images were obtained using an EVOS M5000. The confluency was shown as percentage of covered area. Scale bar represents 500 μm. n = 8. (b) Real time PCR was performed using primer pairs of mouse villin-1, Lgr5, CLDN2, CLDN7, and β-actin. The mRNA contents were represented relative to the values in day 1. n = 4
Figure 2. Effects of culture periods on the cellular localization of CLDNs and transcriptional factors. (a) MCE301 cells cultured for 7 and 21 days were immunostained with CLDN2, CLDN7, and ZO-1 in the presence of DAPI. The scale bar represents 20 μm. The colocalization of CLDNs and ZO-1 in the TJ was represented relative to the total fluorescence values. (b) The cells were immunostained with p53 and HNF4α in the presence of DAPI. The nuclear localization of p53 and HNF4α was represented relative to the fluorescence values in day 7. ** P < .01 significantly different from day 7
Effect of TEN on CLDN2, CLDN7, p53, and HNF4α expression
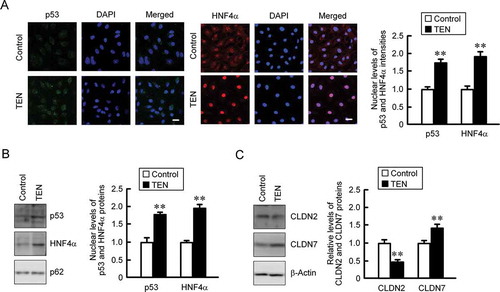
Western blotting and immunofluorescence analyses showed that TEN, a small-molecule activator of p53, increased the nuclear levels of p53 and HNF4α (). The protein level of CLDN2 was decreased by TEN, whereas that of CLDN7 was increased (). These results support the idea that the expression of CLDN2 and CLDN7 is regulated by p53 and HNF4α.
Figure 3. Effect of TEN on the expression of CLDNs and transcriptional factors. (a) MCE301 cells cultured for 7 days were incubated in the absence (control) and presence of 10 μM TEN for 6 h. The cells were immunostained with p53 and HNF4α in the presence of DAPI. The scale bar represents 20 μm. The nuclear localization of these proteins was represented relative to the fluorescence values of control. (b) The cells were incubated with 10 μM TEN for 6 h. Nuclear extracts were immunoblotted with anti-p53, anti-HNF4α, or anti-nucleoporin p62 (p62) antibody. The contents of p53 and HNF4α normalized by p62 were represented relative to the values of control. (c) The cells were incubated with 10 μM TEN for 24 h. Cytoplasmic extracts including membrane and cytoplasmic proteins were immunoblotted with anti-CLDN2, anti-CLDN7, or anti-β-actin antibody. The contents of CLDN2 and CLDN7 normalized by β-actin were represented relative to the values of control. ** P < .01 significantly different from control
Involvements of p53 and HNF4α in the regulation of CLDN2 and CLDN7 expression
The mRNA level of CLDN2 was decreased by TEN, whereas that of CLDN7 was increased (). Similar changes in promoter activities of CLDN2 and CLDN7 were observed by TEN (). These results coincide with the data of Western blotting. The mRNA level of CLDN2 was not decreased by the overexpression of CLDN7 (). In addition, the mRNA level of CLDN7 was not increased by the knockdown of CLDN2 (). These results indicate that CLDN2 and CLDN7 are not involved in the regulation of expression each other. Next, we examined the effect of small interference RNA (siRNA) for p53 or HNF4α on the expression of CLDN2 and CLDN7. The TEN-induced increase in the mRNA level of CLDN7 was significantly inhibited by the knockdown of p53 and HNF4α (). Similarly, the TEN-induced response of CLDN2 mRNA was inhibited by their knockdown. These results indicate that p53 and HNF4α may regulate CLDN2 and CLDN7 expression negatively and positively, respectively.
Figure 4. Effect of TEN on reporter activity and mRNA expression of CLDNs. (a) MCE301 cells were incubated in the absence (control) and presence of 10 μM TEN for 6 h. Real time PCR was performed using primer pairs for CLDN2, CLDN7, and β-actin. The contents of CLDNs were represented relative to the values of control. n = 4. (b) Promoter luciferase construct of CLDN2 or CLDN7 was co-transfected with pRL-TK vector into the cells. After 40 h of transfection, the cells were incubated in the absence and presence of 10 μM TEN for 6 h. After normalizing transfection efficiency with Renilla luciferase, the relative promoter activities of CLDNs was represented as the values of control. (c) The cells were transfected with mock or CLDN7 expression vector. After two days of transfection, total RNA was isolated. Real time PCR was performed using primer pairs of CLDN2, CLDN7, and β-actin. The mRNA contents of CLDNs were represented relative to the values of mock. (d) The cells were transfected with negative or CLDN2 siRNA. Real time PCR was performed using primer pairs of CLDN2, CLDN7, and β-actin. After two days of transfection, total RNA was isolated. the mRNA contents of CLDNs were represented relative to the values of negative siRNA (Neg). (e) The cells were transfected with negative (Neg), p53, or HNF4α siRNA. After two days of transfection, the cells were incubated in the absence and presence of TEN for 6 h. Real time PCR was performed using primer pairs of CLDN2, CLDN7, and β-actin. The mRNA contents of CLDNs were represented relative to the values of negative siRNA. n = 4
Association of p53 and HNF4α
The association of p53 with HNF4α was increased by TEN in the immunoprecipitation assay (). The complex of p53 and HNF4α was not detected by rabbit IgG (). The presumable binding sites of p53 and HNF4α were detected in the promoter region of mouse CLDN2 and CLDN7 by a transcriptional factor binding prediction program, TFBIND (http://tfbind.hgc.jp/). The binding of p53 and HNF4α on the promoter region of CLDN7 was increased by TEN in the ChIP-qPCR assay (). Similar results were observed using the promoter region of CLDN2. These results indicate that p53 and HNF4α may form dimer and bind to the promoter region of CLDN2 and CLDN7.
Figure 5. Binding of p53 and HNF4α to CLDN2 and CLDN7 promoter by TEN. (a) MCE301 cells were incubated in the absence and presence of 10 μM TEN for 6 h. The cell lysates were immunoprecipitated with anti-p53 or anti-HNF4α antibody and then blotted with anti-HNF4α or anti-p53 antibody. The amount of association of p53 with HNF4α protein was represented relative to the values of control. (b) The cell lysates were immunoprecipitated with rabbit IgG and then blotted with anti-p53 or anti-HNF4α antibody. Input was shown in the right side. (c) Nuclear proteins were prepared from the cells incubated in the absence and presence of 10 μM TEN for 6 h. After immunoprecipitation of genomic DNA by anti-p53 or anti-HNF4α antibody, real time PCR was performed using the primer pairs amplifying the putative p53 and HNF4α binding sites of CLDN2 and CLDN7 promoter. Input chromatin was used as a normalizer. ** P < .01 and * P < .05 significantly different from control. n = 4
Effect of TEN on paracellular permeability
Paracellular permeability was estimated using MCE301 cells cultured on transwell inserts. TER was slightly but significantly decreased by TEN (). In contrast, LY, FD4, and FD20 fluxes were unchanged by TEN (). Ion selectivity of paracellular pathway was estimated by the Ussing chamber assay. TEN increased dilution potential and the ratio of permeability to Cl− and permeability to Na+ (Cl−/Na+) (). Similar results were observed in the CLDN2 knockdown and CLDN7 overexpression cells (). These results indicate that TEN may increase paracellular Cl− permeability mediated by the decrease in CLDN2 expression and increase in CLDN7 expression.
Figure 6. Effects of TEN on paracellular permeability. (a-c) MCE301 cells were cultured on transwell inserts. Then the cells were incubated in the absence and presence of 10 μM TEN for 24 h. (a) TER was measured using a volt ohmmeter. (b) LY (50 μg/ml), FD4 (50 μg/ml), or FD20 (50 μg/ml) were applied to the apical compartment. The buffer in the basal compartment was collected after 30 min, and fluorescence intensity was measured. Papp was calculated as described in the method. (c and d) Transwell inserts were mounted on the Ussing chamber. Dilution potential was measured by exchanging the bathing solution to the solution containing half NaCl concentration. PCl/PNa was calculated by the Goldman-Hodgkin-Katz equation. (e and f) Dilution potential and PCl/PNa were measured using the cells transfected with mock (negative siRNA plus empty vector) or CLDN2 siRNA (si-CLDN2) plus CLDN7-expressing vector (CLDN7OE). n = 4. ** P < .01 significantly different from control or mock. NS P > .05 not significantly different from control
Effect of CLDN1 overexpression on paracellular permeability
To clarify the involvements of other CLDN subtypes, we investigated the effect of TEN on mRNA levels of CLDNs. The mRNA level of CLDN1 was increased by TEN, whereas that of CLDN8 was decreased (). In contrast, TEN had no effect on the mRNA levels of CLDN3, 4, 12, 15, 23. In Western blot analysis, the protein level of CLDN1 was increased by TEN, but that of CLDN8 was under detection limit (). Therefore, we determined to examine the effect of CLDN1 overexpression on paracellular permeability. Dilution potential and the ratio of Cl−/Na+ were not significantly changed by CLDN1 overexpression. CLDN1 may not contribute to the TEN-induced alteration of paracellular permeability.
Figure 7. Effect of CLDN1 overexpression on paracellular permeability. (a) MCE301 cells were incubated with 10 μM TEN for 6 h. Real time PCR was performed using primer pairs for indicated genes. The mRNA contents of CLDNs were represented relative to the values of control. (b) The cells were incubated with 10 μM TEN for 24 h. Cytoplasmic extracts were immunoblotted with anti-CLDN1, anti-CLDN8, or anti-β-actin antibody. The protein contents of CLDN1 were represented relative to the values of control. The protein expression of CLDN8 was under detection limit (ND). (c and d) The cells cultured on transwell inserts were transfected with mock or CLDN1-expressing vector. Then, the cells were mounted on the Ussing chamber. Dilution potential and PCl/PNa were measured. n = 4. ** P < .01 significantly different from control. NS P > .05
Localization of p53 and HNF4α in the colon crypt of mice
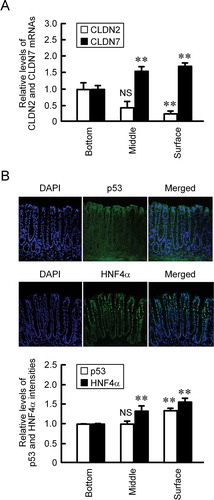
So far, we reported that CLDN7 protein is localized at the surface in the colon crypt of mice, whereas that of CLDN2 is located at the bottom.Citation12,Citation13 The mRNA levels of CLDN2 and CLDN7 showed similar expression pattern to the protein levels of these CLDNs (). Both p53 and HNF4α proteins were highly expressed at the surface of the crypts (). The expressions of both p53 and HNF4α are correlated with CLDN7 expression and CLDN2 expression positively and negatively, respectively.
Figure 8. Localization of CLDNs and transcriptional regulatory factors in the mice crypt. (a) The crypt of distal colon was divided into three sections; surface, middle, and bottom. After isolation of total RNA, real time PCR was performed using primer pairs of mouse CLDN2, CLDN7, and β-actin. The mRNA contents of CLDNs were represented relative to the values in the bottom. n = 4. (b) The segments of distal colon were immunostained with p53 and HNF4α in the presence of DAPI, a nuclear marker. The fluorescence intensities of p53 and HNF4α were represented relative to the values in the bottom. n = 3–4. ** P < .01 significantly different from bottom. NS P > .05
Discussion
The major fraction of Na+ is absorbed via electrogenic route of epithelial Na+ channels (ENaCs) in the distal colon and electroneutral routes of Na+/H+-exchanger (NHE) in the proximal colon. ENaCs consist of three homologous subunits, α, β, and γ are abundantly expressed at the surface of crypt in the rats with low-salt diets.Citation20 The driving force of Na+-coupled transport systems is delivered by Na+/K+-ATPase in the basolateral membrane.Citation21 Absorption of Na+ is accompanied by the counter ion Cl−, which may be taken up mediated through cystic fibrosis transmembrane conductance regulator (CFTR) Cl− channel and/or a paracellular route. The direction of Cl− transport is different in the segments of crypt. Cl− may be absorbed through CFTR Cl− channel and Cl−/HCO3− exchanger in the upper crypt.Citation3 On the other hand, the epithelial cells in the bottom crypt have a high Cl− secretory activity. The physical barrier via TJs interactions is necessary to maintain the efficient absorption or secretion electrolytes. The mRNA level of CLDN2 reached at the peak on day 7 and gradually declines, whereas that of CLDN7 was elevated depending on the culture days in MCE301 cells (). Similar expression pattern was observed at the protein levels of CLDN2 and CLDN7.Citation12 Stem cells are differentiated to epithelial cells during moving up toward the luminal surface in the colon, leading to cell death at the top of crypt. Therefore, we hypothesized that p53, a critical regulator of lifespan, may be involved in the regulation of CLDN2 and CLDN7 expression.
The nuclear level of p53 protein was increased depending on the culture days in MCE301 cells (), which is positive correlation with CLDN7 and negative correlation with CLDN2. In addition, the nuclear level of HNF4α was also increased depending on the culture days. Immunofluorescence and Western blotting analyses showed that the nuclear levels of p53 and HNF4α proteins are up-regulated by TEN (). The expression levels of CLDN2 and CLDN7 proteins were decreased and increased by TEN, respectively. In contrast, the mRNA levels of CLDN3 and 15, which are endogenously expressed in MCE301 cells, were not significantly changed by TEN (data not shown). The involvement of HNF4α in the regulation of CLDN7 has been reported using human colon carcinoma cell lines Caco-2 and HT29/B6.Citation14 However, the mechanism how the expression of HNF4α is regulated still remains unknown. Our data suggest that p53 may be involved in the elevation of HNF4α expression in the nuclei.
The promoter activities of CLDN2 and CLDN7 were decreased and increased by TEN (), respectively, which coincide with the data of real time PCR () and Western blotting (). Therefore, both CLDN2 and CLDN7 expression may be primarily regulated by TEN at the transcriptional step. Deficiency of CLDN15 did not cause an increase in the endogenous expression of other CLDN subtypes in the small intestine.Citation22 On the other hand, the tight junctional expression of CLDN3 and CLDN7 is increased in the renal tubular epithelial cells and urothelium of CLDN4 knockout mice.Citation23 Therefore, the expression of CLDN2 and CLDN7 is possible to be regulated by the compensation mechanism. However, CLDN7 overexpression did not decrease the mRNA level of CLDN2, and CLDN2 knockdown did not increase the mRNA level of CLDN7 (). The expression of CLDN2 and CLDN7 may be regulated by common factors but with inverse directions.
Immunoprecipitation assay showed that the association of p53 with HNF4α is increased by TEN (). In addition, ChiP-qPCR assay revealed the binding of p53 and HNF4α to the promoter regions of CLDN2 and CLDN7 is exaggerated by TEN (). Both p53 and HNF4α are highly expressed in the surface of mouse crypt (). There results suggest that the complex of p53 with HNF4α is involved in the transcriptional regulation of CLDN2 and CLDN7 genes. The inverse correlation between p53 and CLDN2 is also reported in the mouse colon tissues with dextran sulfate sodium-induced colitis.Citation24 p53 may be involved in the regulation of CLDN2 and CLDN7 expression in the colon under both physiological and pathophysiological conditions.
We recently reported that colonic CLDN2 and CLDN7 expressions are up-regulated in mice fed with NaCl-depleted diets.Citation12,Citation13 CLDN2 is highly expressed in leaky epithelia such as renal proximal tubules and the small intestine, and increases paracellular Na+ and water permeability.Citation25 CLDN2 may not be involved in the absorption of Na+ in the distal colon because of a luminal negative potential.Citation26 CLDN7-deficient mice cause renal Na+, Cl−, and K+ wasting, resulting in chronic dehydration.Citation27 The knockdown of CLDN7 by siRNA decreases the permeability of Cl− in LLC-PK1, derived from porcine renal tubule, whereas it increases the permeability to Na+ in Madin-Darby canine kidney type II cells.Citation11 The association of CLDN4 with CLDN8 is required for the function of CLDN4 as an anion-selective pore in the collecting duct.Citation28 The partner of CLDN7 has not been clarified, but the phenomenon of ion permeability of CLDN7 may be altered by the interaction with endogenous CLDNs. In the MCE301 cells, the ratio of PCl/PNa was increased by the overexpression of CLDN7, which was enhanced by the knockdown of CLDN2. We suggest that the inverse regulation of CLDN2 and CLDN7 expression may induce switch from cation permeable mode in the bottom of crypt to anion permeable mode in the surface. Over ten CLDN types are endogenously expressed in the colon.Citation7 At present, we cannot deny the possibility that other CLDNs is involved in the regulation of paracellular ion permeability in the crypt. The putative regulatory model of CLDN2 and CLDN7 expression in the colon is shown in .
Figure 9. A putative regulatory model of CLDN2 and CLDN7 expression in the colon. The complex of p53 and HNF4α controls the expression of CLDN2 and CLDN7 in the crypt of colon, leading to alteration of paracellular fluxes of Na+, K+, and Cl

Conclusion
The expression of CLDN2 and CLDN7 in MCE301 cells was altered depending on the culture days. TEN induced the increase in CLDN7 expression and decrease in CLDN2 expression, which were inhibited by siRNAs for p53 and HNF4α. The complex of p53 and HNF4α was increased by TEN and they bound to the promoter region of CLDN2 and CLDN7. PCl/PNa was increased by TEN, knockdown of CLDN2, or overexpression of CLDN7. We suggest that p53 and HNF4α contribute to the determination of paracellular permeability mediated through the alteration of CLDN2 and CLDN7 expression in the colon.
Author contributions
C. Hirota, Y. Takashina, N. Ikumi, and N. Ishizuka performed experiments and analyzed the data. H. Hayashi, Y. Tabuchi, Y. Yoshino, and T. Matsunaga contributed the experiment plan and discussion of the manuscript. A. Ikari contributed to supervision of the project, interpretation of the data and writing the paper.
Conflicts of interest
The authors declare that they have no conflicts of interest.
Supplemental Material
Download JPEG Image (643.5 KB)
Supplemental data
Supplemental data for this paper can be accessed on the publisher’s website.
Additional information
Funding
References
- Vadlamudi HC, Raju YP, Yasmeen BR, Vulava J. Anatomical, biochemical and physiological considerations of the colon in design and development of novel drug delivery systems. Curr Drug Deliv. 2012;9:1–15. doi:10.2174/156720112803529774.
- Hermiston ML, Gordon JI. Organization of the crypt-villus axis and evolution of its stem cell hierarchy during intestinal development. Am J Physiol-Renal Physiol. 1995;268:G813–G822. doi:10.1152/ajpgi.1995.268.5.G813.
- Kunzelmann K, Mall M. Electrolyte transport in the mammalian colon: mechanisms and implications for disease. Physiol Rev. 2002;82:245–289. doi:10.1152/physrev.00026.2001.
- Dolman D, Edmonds CJ. The effect of aldosterone and the renin-angiotensin system on sodium, potassium and chloride transport by proximal and distal rat colon in vivo. J Physiol. 1975;250:597–611. doi:10.1113/jphysiol.1975.sp011072.
- Wills NK, Lewis SA, Eaton DC. Active and passive properties of rabbit descending colon: a microelectrode and nystatin study. J Membr Biol. 1979;45:81–108. doi:10.1007/bf01869296.
- Tsukita S, Furuse M, Itoh M. Multifunctional strands in tight junctions. Nat Rev Mol Cell Biol. 2001;2:285–293.
- Oshima T, Miwa H. Gastrointestinal mucosal barrier function and diseases. J Gastroenterol. 2016;51:768–778. doi:10.1007/s00535-016-1207-z.
- Garcia-Hernandez V, Quiros M, Nusrat A. Intestinal epithelial claudins: expression and regulation in homeostasis and inflammation. Ann N Y Acad Sci. 2017;1397:66–79. doi:10.1111/nyas.13360.
- Colegio OR, Van Itallie CM, McCrea HJ, Rahner C, Anderson JM. Claudins create charge-selective channels in the paracellular pathway between epithelial cells. Am J Physiol Cell Physiol. 2002;283:C142–C147. doi:10.1152/ajpcell.00038.2002.
- Amasheh S, Meiri N, Gitter AH, Schoneberg T, Mankertz J, Schulzke JD, Fromm M. Claudin-2 expression induces cation-selective channels in tight junctions of epithelial cells. J Cell Sci. 2002;115:4969–4976. doi:10.1242/jcs.00165.
- Hou J, Gomes AS, Paul DL, Goodenough DA. Study of claudin function by RNA interference. J Biol Chem. 2006;281:36117–36123. M608853200 [pii]. doi:10.1074/jbc.M608853200.
- Furukawa C, Ishizuka N, Hayashi H, Fujii N, Manabe A, Tabuchi Y, Matsunaga T, Endo S, Ikari A. Up-regulation of claudin-2 expression by aldosterone in colonic epithelial cells of mice fed with NaCl-depleted diets. Sci Rep. 2017;7:12223. doi:10.1038/s41598-017-12494-1.
- Takashina Y, Ishizuka N, Ikumi N, Hayashi H, Manabe A, Hirota C, Tabuchi Y, Matsunaga T, Ikari A. Upregulation of claudin-7 expression by angiotensin II in colonic epithelial cells of mice fed with NaCl-depleted diets. Int J Mol Sci. 2020:21. doi:10.3390/ijms21041442.
- Farkas AE, Hilgarth RS, Capaldo CT, Gerner-Smidt C, Powell DR, Vertino PM, Koval M, Parkos CA, Nusrat A. HNF4alpha regulates claudin-7 protein expression during intestinal epithelial differentiation. Am J Pathol. 2015;185:2206–2218. doi:10.1016/j.ajpath.2015.04.023.
- Brooks CL, Gu W. Ubiquitination, phosphorylation and acetylation: the molecular basis for p53 regulation. Curr Opin Cell Biol. 2003;15:164–171. doi:10.1016/s0955-0674(03)00003-6.
- Kosinski C, Li VS, Chan AS, Zhang J, Ho C, Tsui WY, Chan TL, Mifflin RC, Powell DW, Yuen ST, et al. Gene expression patterns of human colon tops and basal crypts and BMP antagonists as intestinal stem cell niche factors. Proc Natl Acad Sci U S A. 2007;104:15418–15423. doi:10.1073/pnas.0707210104.
- Tabuchi Y, Ohta S, Arai Y, Kawahara M, Ishibashi K, Sugiyama N, Horiuchi T, Furusawa M, Obinata M, Fuse H, et al. Establishment and characterization of a colonic epithelial cell line MCE301 from transgenic mice harboring temperature-sensitive simian virus 40 large T-antigen gene. Cell Struct Funct. 2000;25:297–307. doi:10.1247/csf.25.297.
- Ikari A, Sato T, Watanabe R, Yamazaki Y, Sugatani J. Increase in claudin-2 expression by an EGFR/MEK/ERK/c-Fos pathway in lung adenocarcinoma A549 cells. Biochim Biophys Acta. 2012;1823:1110–1118. doi:10.1016/j.bbamcr.2012.04.005.
- Yu AS. Electrophysiological characterization of claudin ion permeability using stably transfected epithelial cell lines. Methods Mol Biol. 2011;762:27–41. doi:10.1007/978-1-61779-185-7_3.
- Coric T, Hernandez N, Alvarez de la Rosa D, Shao D, Wang T, Canessa CM. Expression of ENaC and serum- and glucocorticoid-induced kinase 1 in the rat intestinal epithelium. Am J Physiol Gastrointest Liver Physiol. 2004;286:G663–G670. doi:10.1152/ajpgi.00364.2003.
- Bachmann O, Juric M, Seidler U, Manns MP, Yu H. Basolateral ion transporters involved in colonic epithelial electrolyte absorption, anion secretion and cellular homeostasis. Acta Physiol (Oxf). 2011;201:33–46. doi:10.1111/j.1748-1716.2010.02153.x.
- Tamura A, Kitano Y, Hata M, Katsuno T, Moriwaki K, Sasaki H, Hayashi H, Suzuki Y, Noda T, Furuse M, et al. Megaintestine in claudin-15-deficient mice. Gastroenterology. 2008;134:523–534. doi:10.1053/j.gastro.2007.11.040.
- Fujita H, Hamazaki Y, Noda Y, Oshima M, Minato N. Claudin-4 deficiency results in urothelial hyperplasia and lethal hydronephrosis. PLoS One. 2012;7:e52272. doi:10.1371/journal.pone.0052272.
- Kim HY, Jeon H, Bae CH, Lee Y, Kim H, Kim S. Rumex japonicus Houtt. alleviates dextran sulfate sodium-induced colitis by protecting tight junctions in mice. Integr Med Res. 2020;9:100398. doi:10.1016/j.imr.2020.02.006.
- Rosenthal R, Gunzel D, Krug SM, Schulzke JD, Fromm M, Yu AS. Claudin-2-mediated cation and water transport share a common pore. Acta Physiol (Oxf). 2017;219:521–536. doi:10.1111/apha.12742.
- Orlando RC, Powell DW, Croom RD, Berschneider HM, Boucher RC, Knowles MR. Colonic and esophageal transepithelial potential difference in cystic fibrosis. Gastroenterology. 1989;96:1041–1048. doi:10.1016/0016-5085(89)91621-1.
- Tatum R, Zhang Y, Salleng K, Lu Z, Lin JJ, Lu Q, Jeansonne BG, Ding L, Chen YH. Renal salt wasting and chronic dehydration in claudin-7-deficient mice. Am J Physiol-Renal Physiol. 2010;298:F24–34. doi:10.1152/ajprenal.00450.2009.
- Hou J, Renigunta A, Yang J, Waldegger S. Claudin-4 forms paracellular chloride channel in the kidney and requires claudin-8 for tight junction localization. Proc Natl Acad Sci U S A. 2010;107:18010–18015. doi:10.1073/pnas.1009399107.