
ABSTRACT
The validity and relevance of histologic disease activity in Crohn’s disease (CD) is unclear, owing to disconnects with endoscopic pathology. Here, we explore relationships between endoscopic, histologic, and molecular activity. This post hoc analysis of the Phase 2 FITZROY trial (NCT02048618) assessed baseline and week 10 (W10) inflammation across matched ileal and colonic segments in CD patients receiving filgotinib 200 mg (n = 42) vs placebo (n = 18). Macroscopic and microscopic disease were assessed by Simple Endoscopic Score for CD ulceration subscore (uSES-CD) and Global Histologic Activity Score activity subscore (aGHAS), respectively. Molecular activity was quantified by phosphorylated signal transducer and activator of transcription (pSTAT)1 and pSTAT3 in epithelium and nonepithelium. Segments were classified as “low” or “high” activity; correlations and concordance were calculated. Logistic regression identified W10 outcome predictors. Overall, 300 segments in 60 patients were assessed. Baseline uSES-CD and aGHAS correlations were 0.72 and 0.53 in colon and ileum, respectively. pSTAT levels had poor-to-moderate concordance with uSES-CD (κ range, 0.11–0.49) but moderate-to-good concordance with aGHAS (0.43–0.77). With filgotinib vs placebo, uSES-CD and aGHAS decreased in significantly more segments with high baseline uSES-CD and aGHAS, and significantly more segments with high baseline pSTAT improved at W10. pSTAT1 was more sensitive to change than uSES-CD and aGHAS. Low baseline pSTAT3 in colon nonepithelium predicted W10 low uSES-CD (P = .044). There was better concordance between histologic and molecular disease activity associated with higher sensitivity to change vs endoscopic severity in ileocolonic CD. Our results suggest histologic activity be included in the assessment of CD inflammatory burden.
Introduction
Understanding the relationship between endoscopic, histologic, and molecular measures of disease activity and their responsiveness to treatment may offer insight into the pathophysiology and depth of treatment response in Crohn’s disease (CD), a chronic inflammatory disorder characterized by the loss of the intestinal tissue barrier integrity. In the Phase 2 FITZROY study, once daily filgotinib 200 mg induced clinical remission (Clinical Disease Activity Index <150) in patients with moderately to severely active CD at significantly higher rates than placebo and improved endoscopic and histologic activity after 10 weeks.Citation1 This post hoc analysis of FITZROY data assessed endoscopic, histologic, and Janus kinase (JAK) pathway activity at the level of the intestinal segment. Further analyses were conducted to explore if improvement in endoscopic disease activity occurred in conjunction with histologic improvement and to evaluate how those measures of disease activity relate to pharmacodynamic effects of filgotinib through the JAK-signal transducer and activator of transcription (JAK-STAT) pathway.
Background
In patients with CD, intestinal inflammation can be assessed macroscopically and microscopically. Absence of macroscopic ulcerations (endoscopic healing) is a critical goal for treatment;Citation2–4 however, some patients may still show microscopic inflammation.Citation5,Citation6 The significance of histologic disease activity in CD is unknown, though it may predict relapse during clinical remission, as in ulcerative colitis.Citation6–9 Histologic healing in CD was observed following ustekinumab and vedolizumab treatment,Citation10–12 and the Simple Endoscopic Score for CD (SES-CD) and Global Histologic Activity Score (GHAS) scores are correlated in patients undergoing CD treatment.Citation5,Citation10,Citation13,Citation14 However, no published reports to date have linked underlying molecular mechanisms of treatment, at the level of the mucosa, to histologic and endoscopic responses to CD treatment.
Filgotinib is an oral preferential JAK1 inhibitor that blocks proinflammatory cytokine activity.Citation15 When activated, JAKs facilitate phosphorylation and activation of the STAT proteins, which then bind to regulatory DNA elements promoting immune system activation and inflammation.Citation16 Filgotinib modulates STAT1 and STAT3 phosphorylation.Citation15,Citation17,Citation18 Levels of phosphorylated STAT1 (pSTAT1) and pSTAT3 are higher in the intestinal mucosa of patients with inflammatory bowel disease.Citation19–21 Consequently, pSTAT1 and pSTAT3 are key molecular markers of filgotinib activity and JAK1-related signaling in CD. Levels of pSTAT1 and pSTAT3 in patients with CD could therefore be used as molecular surrogates to assess inflammatory status and response to treatment.
Methods
Study design
The FITZROY Phase 2 multicenter, double-blind, randomized, placebo-controlled trial (NCT02048618, registered January 2014) compared filgotinib 200 mg vs placebo over 20 weeks (3:1 randomization for 10 weeks and then rerandomized based on responder status for 10 weeks) in patients with moderately to severely active CD and ulceration at screening.Citation1 Patients were enrolled from Feb 2014 until Dec 2015. The study was approved by relevant ethics committees and performed in accordance with the Declaration of Helsinki and Good Clinical Practice guidelines.Citation1 All patients provided written informed consent.Citation1
Disease activity assessment procedures and definitions for segmental-level analysis
Endoscopic disease activity of 5 bowel segments (terminal ileum, right/left/transverse colon, and rectum) was evaluated from centrally read colonoscopies,Citation1 performed at screening and week 10 (W10) using SES-CD.Citation22 Total SES-CD scores for the ileum and colon and scores for each segment were generated. At screening and W10, standard pinch tissue biopsies were taken from the macroscopically most and least affected areas of each segment and scored centrally for histologic activity using the GHAS.Citation23 Total GHAS, scores for the ileum and colon, and scores for each segment were generated. Baseline disease activity (endoscopic and histologic) assessed at screening was used as baseline.
For the mucosal tissue samples used in the current analysis, biopsies were taken from areas representative of worst disease in that segment (“most-affected” biopsy). When examining segments that showed no evidence of active inflammation, we previously observed that one source of discordance between microscopic and macroscopic assessments is the percent affected surface subscore of the SES-CD.Citation24 Therefore, when comparing activity on a segmental level between measures, we focused on the subscores of the SES-CD that were relative to the degree of observable ulceration (uSES-CD) for endoscopy and the GHAS components that were reflective of active inflammation (aGHAS) for histology.
Normal segments were defined as those with SES-CD = 0 and GHAS = 0. A description of disease categories is presented in Table S1. Patients with baseline total uSES-CD >2 or baseline total aGHAS >2 were considered uSES-CD or aGHAS responders if they had a ≥50% decrease in total uSES-CD or total aGHAS at W10.
The threshold for low vs high molecular activity was determined empirically using the distribution of pSTAT labeling values obtained for normal segments and quantified as the percent of nuclei staining positive for pSTAT. High molecular activity for pSTAT1 and pSTAT3 was defined as a percent of positive nuclei greater than the percent of positive nuclei in 75% of all normal segments for the epithelial and nonepithelial zones.
Histologic methods
Formalin-fixed, paraffin-embedded 5-µm biopsy tissue sections were incubated with rabbit monoclonal antibodies to pSTAT1 (clone Tyr701, 58D6) or pSTAT3 (clone TYR705, D3A7; Cell Signaling Technology, Danvers, MA). Sections were processed on a Leica Bond Max automated staining system (Leica Biosystems, Buffalo Grove, IL) and visualized with diaminobenzidine using a Bond Polymer Refine Detection kit (Leica Biosystems, Buffalo Grove, IL).
Whole slide images of immunohistochemistry-stained tissue sections were captured using an Aperio AT2 scanner at 20× magnification and analyzed with Visiopharm software version 2019.06 (Visiopharm, Hoersholm, Denmark). Using a trained U-Net deep learning algorithm,Citation25 epithelial and nonepithelial compartments were identified. Levels of pSTAT1 and pSTAT3 were quantified in 2 ways: counting positive nuclei in each compartment and then normalizing against total nuclei (% positive nuclei) and determining the positively stained area in the tissue sample and normalizing against total tissue area (Figure S1). Values were similar using both methods (Figure S2); therefore, only % positive nuclei levels were reported.
Statistical methods
All available paired patient data were used for the correlation between GHAS or aGHAS and SES-CD or uSES-CD. Spearman’s rank correlation assessed the relationship between histologic and endoscopic activity in filgotinib and placebo groups. Correlations were generated between total SES-CD and total GHAS for all segments combined and for aGHAS with uSES-CD components separately in the colon and the ileum. Only patients with a complete set of segmental scores at baseline and W10 were included in the per-segment analyses. Spearman’s rank correlation assessed the relationship between pSTAT quantification methods. Concordance between measures of molecular and endoscopic or histologic activity was calculated per segment using percent concordance and Cohen’s kappa (κ). Paired t-tests assessed change in uSES-CD, aGHAS, and pSTAT1 and pSTAT3 levels between baseline and W10. A one-sided Fisher’s exact test assessed the difference in the proportion of segments that improved or worsened between filgotinib and placebo. One-sided Wilcoxon signed-rank tests compared uSES-CD and aGHAS values at baseline vs W10 for segments with high and low molecular activity in the colon and ileum separately. The predictive value of high vs low pSTAT1 or pSTAT3 for achievement of low endoscopic or histologic activity per segment at W10 for segments with baseline uSES-CD >2 was evaluated using a logistic regression model incorporating sex, age, treatment, molecular disease activity, and molecular activity by treatment. Statistical analyses were performed using SAS® version 9.4 (SAS Institute Inc., Cary, NC) and R computing software (R Core Team, Vienna, Austria).
Results
Subanalysis populations
Seventy-six patients receiving filgotinib 200 mg and 23 patients receiving placebo were included in the endoscopic efficacy analysis (SES-CD analysis set). The histology efficacy analysis (GHAS analysis set) included 54 filgotinib and 21 placebo patients. The segmental analysis set included 42 filgotinib and 18 placebo patients who had a full set of scores for all 5 intestinal segments at baseline and W10; a total of 300 segments were included in the analysis. Demographic and baseline disease characteristics for patients included in each analysis set (SES-CD, GHAS, and segmental) were similar to those in the total safety analysis population ().Citation1
Table 1. Baseline demographics and clinical characteristics of patients included in subanalyses.
Relationship between macroscopic, microscopic, and molecular activity
In general, histologic activity by total GHAS correlated well with total SES-CD activity at both baseline and W10 for all segments (Figure S3). This relationship also applied to histology activity subscore and ulceration observed via endoscopy and was more pronounced in the colon than the ileum. Across all 5 segments, concordance between endoscopic and histologic activities at baseline and W10 was fair to moderate (κ range 0.33–0.53; Table S2).
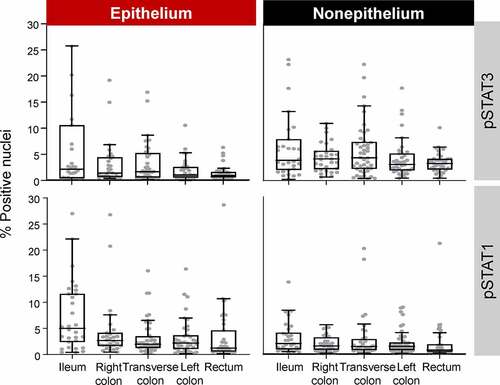
In all normal segments, pSTAT1 and pSTAT3 were present in ≤5% of nuclei in the epithelium and the nonepithelium (range, 0.70–5.01); in general, basal pSTAT3 levels were higher in nonepithelium than in epithelium, whereas pSTAT1 was higher in epithelium than in nonepithelium (; Table S3). Segments with >5.1% and >3.1% pSTAT1-positive nuclei in epithelium and nonepithelium, respectively, and >3.3% and >6.0% pSTAT3-positive nuclei in epithelium and nonepithelium, respectively, fell within the top 75th percentile of pSTAT level values and were determined to have high disease activity. The number of segments with low and high molecular activity at baseline and W10 are presented in Table S4.
Figure 1. Basal pSTAT level from normal segments (SES-CD = 0 and GHAS = 0). Outliers >30% not shown. W10 segment categories are not shown. Boxes represent Q1, median, and Q3 values. The upper whisker is either the maximum value or 1.5 times the IQR above Q3, whichever is smaller, and the lower whisker is either the minimum value or 1.5 times the IQR below Q1, whichever is larger.
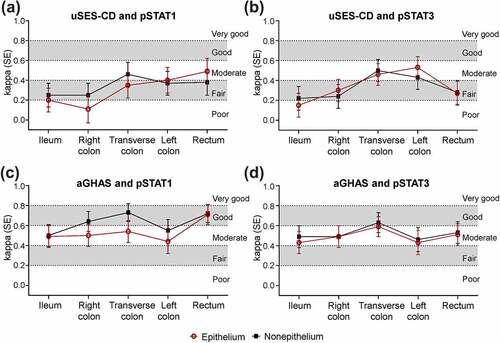
Molecular activity had poor-to-moderate concordance with endoscopic activity but moderate-to-good concordance with histologic activity at baseline, though concordance of pSTAT level with endoscopic and histologic activity varied across segments. Within the transverse colon, left colon, and rectum, concordance of pSTAT1 level with endoscopic disease activity at baseline was fair-to-moderate and was higher relative to other segments ()); concordance of pSTAT3 level with endoscopic disease activity at baseline was moderate in the transverse colon and left colon and was higher relative to other segments ()). Concordance of pSTAT1 and pSTAT3 with histologic activity at baseline was moderate-to-good and was greater in the transverse colon than in other segments ()). Similar results were observed between the epithelium and nonepithelium, although pSTAT1 had higher concordance with histologic activity in the nonepithelium vs epithelium for all segments, except the rectum and ileum. Percent agreement at baseline between pSTAT1 and pSTAT3 levels with endoscopic and histologic activity had a similar pattern to κ across segments and for nonepithelium and epithelium (Figure S4). At W10, κ between molecular activity was also higher with histology vs endoscopy (Figure S5).
Figure 2. Agreement (κ) at baseline between molecular disease activity and endoscopy a, b) or histology c, d) by bowel segment. Concordance was defined as poor (κ <0.2), fair (κ = 0.21–0.40), moderate (κ = 0.41–0.60), good (κ = 0.61–0.80), or very good (κ = 0.81–1.00).
When evaluating data from baseline and W10, molecular activity measured with pSTAT labeling increased with uSES-CD and aGHAS scores per segment (Figure S6). In segments with high uSES-CD or aGHAS, both pSTAT1 and pSTAT3 levels were elevated compared with segments with lower scores. This relationship was more pronounced for aGHAS scores, particularly in the nonepithelium.
Effect of filgotinib on macroscopic, microscopic, and molecular inflammatory status
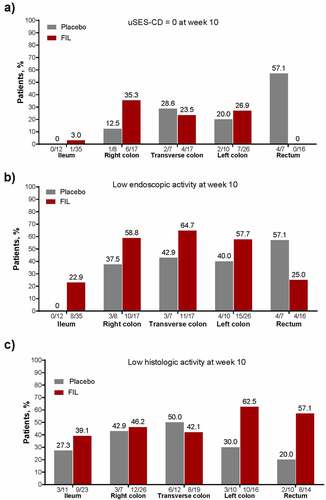
Overall, filgotinib treatment resulted in low histologic and endoscopic activity in numerically more segments vs placebo (). At W10, a numerically larger proportion of segments with high endoscopic activity (uSES-CD >2) at baseline achieved uSES-CD = 0 in the ileum, right colon, and left colon with filgotinib vs placebo ()), and there was a trend toward greater achievement of low endoscopic disease activity (uSES-CD ≤2) in all segments, except the rectum, with filgotinib vs placebo ()). For segments with high histologic activity at baseline, a numerically larger proportion of segments reached low histologic activity in the ileum, right colon, left colon, and rectum with filgotinib ()). Though only a small number of segments had both high histologic and endoscopic activity at baseline, more of these segments improved to uSES-CD = 0, low endoscopic activity (uSES-CD ≤2), low histologic activity, or both low endoscopic and low histologic activity at W10 with filgotinib vs placebo, except for uSES-CD in the rectum (Figure S7).
Figure 3. In patients with active macroscopic or histologic disease at baseline, proportion of patients achieving (a) uSES-CD = 0, (b) low endoscopic activity, and (c) low histologic activity. For uSES-CD analyses, only patients without missing data for all 5segments at baseline and week 10 and with baseline ulcer subscore >2 in each segment were included in the analysis. For aGHAS analyses, only patients with nonmissing data for all 5 segments at baseline and week 10 and with high histologic activity at baseline in each segment were included in the analysis. Normal segments were defined as those with SES-CD = 0 and GHAS = 0. Low and high endoscopic activity were defined as scores ≤2 and >2, respectively, for uSES-CD. Low histologic activity was defined as not normal or high activity; high histologic activity was defined as an aGHAS ulcer/erosion subscore = 1, or if aGHAS ulcer/erosion subscore = 0, then aGHAS epithelial damage, lamina propria neutrophils, and neutrophils in the epithelium all >0. For proportions under the bars, the numerator shows patients achieving the disease activity threshold by segment, and the denominator shows total number of patients included.
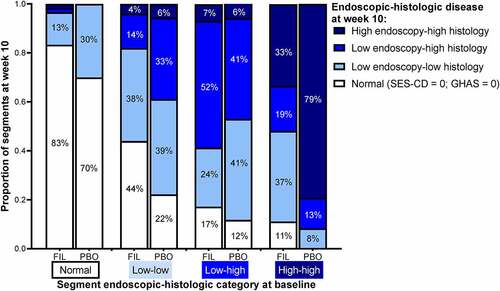
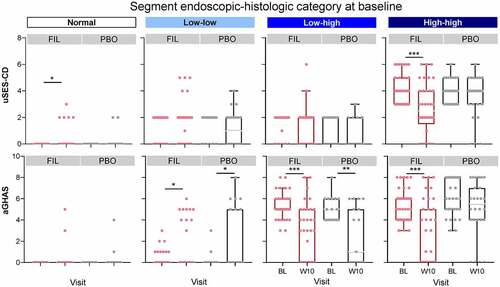
From baseline to W10, the total number of segments with normal disease activity increased, and the number of high disease activity segments decreased (Table S1). The effect of filgotinib on endoscopic and histologic activity per segment is presented in . At W10, disease activity was significantly reduced with filgotinib vs placebo in segments with the highest disease activity (high endoscopic–high histologic activity) at baseline, while placebo treatment was associated with shifts to higher disease activity. At W10, 67% of segments from patients receiving filgotinib with the highest disease activity at baseline shifted to a lower disease category; in contrast, 21% of segments in patients receiving placebo that were classified as high disease activity at baseline showed improvement at W10 (P < .001; ). Of the segments classified with high endoscopic–high histologic activity at baseline, 11% improved to normal at W10 with filgotinib vs 0% with placebo.
Figure 4. Proportion of segments in each endoscopic and histologic disease category at baseline and week 10. Normal segments were defined as those with SES-CD = 0 and GHAS = 0. Low and high endoscopic activity were defined as scores ≤2 and >2, respectively, for uSES-CD. Low histologic activity was defined as not normal or high activity; high histologic activity was defined as an aGHAS ulcer/erosion subscore = 1, or if aGHAS ulcer/erosion subscore = 0, then aGHAS epithelial damage, lamina propria neutrophils, and neutrophils in the epithelium all >0.
These shifts in disease activity category at W10 were due to changes in both uSES-CD and aGHAS (). At W10, filgotinib significantly decreased endoscopic (P < .001) and histologic activity (P < .001) in segments categorized with the highest disease activity at baseline compared with placebo. In contrast, patients receiving placebo had a significant decrease in histologic activity at W10 only in segments with high histologic and low endoscopic disease activity at baseline (P < .05). Median change from baseline in aGHAS at W10 was greater for segments with uSES-CD response vs those without a response, and median change from baseline in uSES-CD at W10 was greater for segments with aGHAS response vs those without a response (Figure S8).
Figure 5. Baseline and W10 endoscopic and histologic disease scores per disease category at baseline. *P < .05, **P < .01, ***P < .001 using a paired t-test between baseline and W10. Normal segments were defined as those with SES-CD = 0 and GHAS = 0. Low and high endoscopic activity were defined as scores ≤2 and >2, respectively, for uSES-CD. Low histologic activity was defined as not normal or high activity; high histologic activity was defined as an aGHAS ulcer/erosion subscore = 1, or if aGHAS ulcer/erosion subscore = 0, then aGHAS epithelial damage, lamina propria neutrophils, and neutrophils in the epithelium all >0. W10 segment categories are not shown. Boxes represent Q1, median, and Q3 values. The upper whisker is either the maximum value or 1.5 times the IQR above Q3, whichever is smaller, and the lower whisker is either the minimum value or 1.5 times the IQR below Q1, whichever is larger.
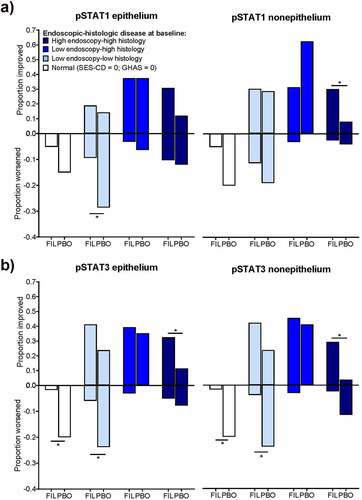
Changes in molecular activity per segment as measured with pSTAT1 and pSTAT3 levels were associated with shifts in endoscopic and histologic activity from baseline to W10. Filgotinib was associated with a significantly larger proportion of segments with high histologic and endoscopic activity improving from high to low pSTAT level at W10 compared with segments treated with placebo for all pSTAT measures except pSTAT1 in the epithelium (P < .05) (). In contrast, a significantly larger proportion of segments with low histologic and endoscopic activity at baseline in patients receiving placebo shifted to higher molecular activity compared with segments in patients receiving filgotinib for all measures except pSTAT1 in the nonepithelium (P < .05). There was a numeric trend toward worsening disease activity as measured with pSTAT1 in the nonepithelium with placebo. Segments that were histologically and endoscopically normal at baseline were also significantly more likely to shift to high molecular activity (pSTAT3) in patients receiving placebo compared with filgotinib (P < .05). Within segments with the highest disease activity at baseline that showed endoscopic and histologic improvements at W10 with filgotinib, both pSTAT1 and pSTAT3 levels in the epithelium and nonepithelium were significantly reduced from baseline (P < .05; Figure S9).
Figure 6. Molecular disease activity in epithelial and nonepithelial regions of all segments combined at W10 for (a) pSTAT1 and (b) pSTAT3. *P < .05 using a one-sided Fisher’s exact test. Data shown are proportion of segments that had a change in category (worsened or improved) from baseline. Normal segments were defined as those with SES-CD = 0 and GHAS = 0. Low and high endoscopic activity were defined as scores ≤2 and >2, respectively, for uSES-CD. Low histologic activity was defined as not normal or high activity; high histologic activity was defined as an aGHAS ulcer/erosion subscore = 1, or if aGHAS ulcer/erosion subscore = 0, then aGHAS epithelial damage, lamina propria neutrophils, and neutrophils in the epithelium all >0.
In segments that had low endoscopic and high histologic activity at baseline and did not change in uSES-CD score at W10, pSTAT1 significantly decreased in both the epithelium and nonepithelium in segments with no change in aGHAS or decreased aGHAS score at W10 (Figure S10). No significant changes in pSTAT3 were observed in these segments.
Predictive power of pSTAT for endoscopic and histologic response
The potential for molecular activity quantified by high vs low pSTAT levels to predict endoscopic and histologic outcomes was investigated using logistic regression. Only pSTAT3 level at baseline in nonepithelial colonic segments was predictive of uSES-CD ≤2 at W10 (odds ratio [95% confidence interval], 0.07 [0, 0.75]; P = .044) (Table S5; Figure S11). In the regression model, no factors were predictive of uSES-CD ≤2 at W10 in the ileum. For histologic outcome, neither pSTAT1 nor pSTAT3 level at baseline was significantly predictive for low histologic activity at W10 (Table S6; Figure S12).
Discussion
CD primarily affects the integrity of the intestinal tissue barrier as assessed by endoscopic disease severity and histologic disease activity. Here, in addition to the relationship between macroscopic and microscopic disease activity, we investigated the concordance of these with the mucosal expression of pSTAT1/3 as surrogates of molecular activity across 5 intestinal segments in patients with CD and evaluated the response to filgotinib 200 mg vs placebo. Across all segments, concordance between endoscopic and histologic activities at baseline and W10 was fair to moderate, with a stronger relationship in colonic segments, perhaps due to a better delineation of macroscopic lesions in the colon as compared with the terminal ileum. Conversely, molecular activity had moderate-to-good concordance with histologic activity. As the same biopsies were used to evaluate histologic and molecular activity, the close relationship between these 2 measures suggests pSTAT levels are an appropriate surrogate of inflammatory response. This finding also suggests that endoscopy alone is not sufficient to assess the mucosal inflammatory load, either due to the presence of nonspecific endoscopic lesions or the underestimation of microscopic involvement. Microscopic and molecular activity may also be more rapidly responsive to treatment than endoscopic assessment, as demonstrated here by the decrease in aGHAS and pSTAT1 over 10 weeks in segments with low baseline endoscopic disease activity without change in uSES-CD. While there were no obvious changes at the endoscopic level, microscopic and molecular disease activity may already indicate differences resulting from treatment at 10 weeks.
Filgotinib was associated with a significant reduction in the proportion of segments with high endoscopic and histologic activity; segments with normal or low endoscopic and histologic activity at baseline in patients receiving placebo were significantly more likely to show higher disease activity at W10. At W10, filgotinib significantly lowered pSTAT1 and pSTAT3 levels in segments with high endoscopic and histologic activity at baseline compared with placebo. In contrast, a significantly larger proportion of segments with low endoscopic and histologic activity or low endoscopic and high histologic activity at baseline shifted from low to high molecular disease activity at W10 in patients receiving placebo vs filgotinib. Filgotinib thus improved disease activity on all 3 levels: macroscopic, microscopic, and molecular.
Both basal pSTAT1 and pSTAT3 levels differed across intestinal segments in epithelium vs nonepithelium. For pSTAT1, concordance with aGHAS was higher in the nonepithelium and lower in the ileum and left colon than in other segments. For pSTAT3, however, the concordance with aGHAS was similar between the epithelium and nonepithelium. The difference between pSTAT levels in epithelial and nonepithelial zones may be attributed to differing cytokine and growth factor activators of pSTAT1 and pSTAT3 in these compartments but is more likely due to increased cellularity of the nonepithelium indicative of inflammatory cell infiltration. However, the underlying reasons for the difference in pSTAT expression across segments are unknown, and additional studies are required. The location of inflammation in CD can predict disease severityCitation2,Citation26 and response to treatmentCitation27 and has been linked to distinct gene-expression profiles, suggesting underlying molecular differences contribute to disease activity in different locations of the intestinal tract.Citation28 Here, higher pSTAT3 levels relative to pSTAT1 in segments may suggest that measurement of pSTAT3 levels could be indicative of larger diagnostic breadth and provide greater and faster sensitivity to change. Using logistic regression, we identified low pSTAT3 at baseline in the nonepithelium of the colon was a significant predictor of uSES-CD ≤2 at W10, suggesting segments with less inflammatory infiltration at baseline were primed to improve at W10. These results are compelling, and research with larger samples should be done on the potential of baseline pSTAT3 level to predict response to treatment.
Limitations of this analysis include that the samples used to establish basal pSTAT levels and thresholds for activity came from patients with CD, so they may reflect a quiescent disease state rather than truly normal homeostatic pSTAT levels. Additionally, the sample size of the current analysis is relatively small. Discrepancy between endoscopic and histologic activity is likely impacted by sampling error during colonoscopy, which may be amplified by categorizing segments based on dichotomous disease scores. However, as there is no consensus on where and how many biopsies should be taken to evaluate histologic disease during CD treatment, we sampled specimens from 5 intestinal segments, from which the concordance between histology and molecular disease activity presented here supports the value of standardized microscopic assessment in CD. Finally, longer-term follow-up data are needed to identify the consequences of histologic and pharmacodynamic activity for disease course.
Histologic healing as an outcome and its correlation to endoscopic disease assessment is a topic of growing interest in CD. Other reports also support a correlation between SES-CD and GHAS scores in patients undergoing CD treatment.Citation5,Citation13 Histologic healing has also been used as a clinical outcome in trials of new CD treatments, including ustekinumab and vedolizumab.Citation10–12 In a study of patients with CD treated with ustekinumab, histologic response at W8 was significantly associated with clinical response, clinical remission, mucosal healing, and endoscopic remission at W44, while endoscopic response at W8 was significantly associated with only long-term endoscopic outcomes.Citation10 Patients with both histologic and endoscopic responses at W8 were more likely to have positive long-term histologic, endoscopic, and clinical outcomes than patients with only histologic or endoscopic responses at W8.Citation10 Those results, together with findings presented here, support a more holistic assessment of mucosal disease activity rather than assessing macroscopic, microscopic, and molecular levels of disease activity as single, independent measures. Additionally, more advanced and artificial intelligence–supported endoscopic techniques may allow more robust assessment of mucosal healing that correlates better with histology.Citation29
Here, we show that histologic activity better associates with JAK-STAT signaling activity than endoscopic outcomes in CD. Treatment with filgotinib resulted in improvements in all 3outcomes. Combining endoscopy, histology, and molecular disease activity scoring could provide a more robust assessment of mucosal disease activity in CD and a more accurate prediction of the course of disease with JAK inhibitors.
Abbreviations
aGHAS, activity subscore of GHAS; BMI, body mass index; CD, Crohn’s disease; CDAI, Clinical Disease Activity Index; CRP, C-reactive protein; GHAS, Global Histology Activity Score; IQR, interquartile range; JAK, Janus kinase; κ, Cohen’s kappa; pSTAT, phosphorylated STAT; uSES-CD, ulceration subscore of SES-CD; STAT, Signal transducer and activator of transcription; SES-CD, Simple Endoscopy Score for CD; TNF, tumor necrosis factor; Q1, first quartile; Q3, third quartile; W, week.
Authors’ contributions
AS and WR conceived the research question. AS, EG, and CT contributed to the study design. AS and EG oversaw the conduct of the study. XH, TK, MK, XR, and SV participated in the conduct of the study. JB and SZ performed the immunohistochemistry analysis. KE and OKY performed the statistical analysis. All authors contributed to the interpretation of the results, critically reviewed the manuscript during writing, and approved the final draft for submission.
Supplemental Material
Download MS Word (4.7 MB)Acknowledgments
We thank Gert De Hertogh for the original histologic scoring used in these analyses. Medical writing support was provided by Kathleen Pieper, PhD, and Helen Rodgers, PhD, of AlphaScientia, LLC, and was funded by Gilead Sciences, Inc.
Data availability statement
Anonymized individual patient data will be shared upon request for research purposes dependent upon the nature of the request, the merit of the proposed research, the availability of the data, and its intended use. The full data-sharing policy for Gilead Sciences, Inc. can be found at https://www.gilead.com/science-andmedicine/research/clinical-trials-transparency-and-data-sharing-policy.
Disclosure statement
Walter Reinisch reports lecture fees from AbbVie, Actelion, Alpha Wasserman, AstraZeneca, Cellerix, Cosmo Pharmaceuticals, Ferring, Genentech, Grunenthal, Johnson & Johnson, Millennium, Merck, NovoNordisk, Nycomed, Pfizer, Pharmacosmos, Schering-Plough, Salix, Takeda, UCB Pharma, and Vifor; consultant fees from AbbVie, Actelion, Alpha Wasserman, AstraZeneca, Cellerix, Cosmo Pharmaceuticals, Ferring, Genentech, Grunenthal, Johnson & Johnson, Millennium, Merck, NovoNordisk, Nycomed, Pfizer, Pharmacosmos, Schering-Plough, Salix, Takeda, UCB Pharma, and Vifor; and serves as an advisory board member for AbbVie, Actelion, Alpha Wasserman, AstraZeneca, Cellerix, Cosmo Pharmaceuticals, Ferring, Genentech, Grunenthal, Johnson & Johnson, Millennium, Merck, NovoNordisk, Nycomed, Pfizer, Pharmacosmos, Schering-Plough, Salix, Takeda, UCB Pharma, and Vifor. Adrian Serone and Ethan Grant are former employees of Gilead Sciences, Inc. and may hold shares. Jens Brodbeck, Kim Etchevers, OhKyu Yoon, and Shiva Zaboli are employees and stockholders of Gilead Sciences, Inc. René Galien and Chantal Tasset are employees and stockholders of Galapagos. Xavier Hébuterne reports clinical research funding from AbbVie; Abivax; Alphasigma; Celgene; Gilead Science, Inc; Eli Lilly; Enterome, Janssen; InDex Pharmaceuticals; Pfizer; Roche; Salix; Sangamo; Takeda; Theravance; serving on advisory boards for AbbVie, Arena Pharmaceuticals, Janssen, Pfizer, Roche, Takeda; and participating in lectures and educational activities for AbbVie, Baxter, Janssen, MSD, Mylan, Nutricia, Pfizer, Tillots, and Takeda. Tanja Kühbacher reports personal fees from Arena Pharmaceuticals, lecture fees and advising from AbbVie; Celgene; Falk; Ferring; Gilead Sciences, Inc.; Janssen; Mundipharma; MSD; Pfizer; and Takeda. Maria Kłopocka reports research funding from Galapagos; speaker fees from AbbVie, Alvogen, Ferring, and Takeda; and support to attend congresses from AbbVie, Alvogen, and Ferring. Xavier Roblin reports relationships with AbbVie, MSD, Janssen Cilag, and Takeda. Séverine Vermeire reports financial support for research from AbbVie, Johnson & Johnson, MSD, Pfizer, and Takeda; lecture fees from AbbVie, Centocor, Ferring, Genentech/Roche Hospira, Johnson & Johnson, MSD, Pfizer, and Takeda; and consulting fees from AbbVie; Celgene; Celltrion; Centocor; Ferring; Galapagos; Genentech/Roche; Gilead Sciences, Inc.; Hospira; Johnson & Johnson; Mundipharma; MSD; Pfizer; ProDigest; Prometheus; Second Genome; and Takeda.
Supplementary material
Supplemental data for this article can be accessed online at https://doi.org/10.1080/21688370.2022.2088961
Additional information
Funding
References
- Vermeire S, Schreiber S, Petryka R, Keuhbacker T, Hebuterne X, Roblin X, and Klopocka M, et al. Clinical remission in patients with moderate-to-severe Crohn’s disease treated with filgotinib (the FITZROY study): results from a phase 2, double-blind, randomised, placebo-controlled trial. Lancet. 2017;389(10066):179–191. doi:10.1016/S0140-6736(16)32537-5.
- Lichtenstein GR, Loftus EV, Isaacs KL, Regueiro MD, Gerson LB, Sands BE. ACG clinical guideline: Management of Crohn’s disease in adults. Am J Gastroenterol. 2018;113(4):481–517. doi:10.1038/ajg.2018.27.
- White JR, Jairath V, Moran GW. Evolution of treatment targets in Crohn’s disease. Best Pract Res Clin Gastroenterol. 2019;38–39:101599. doi:10.1016/j.bpg.2019.02.001.
- Peyrin-Biroulet L, Sandborn W, Sands BE, Reinisch W, Bemelman W, Bryant RV, D’Haens G, Dotan I, Dubinsky M, Feagan B, et al. Selecting therapeutic targets in inflammatory bowel disease (STRIDE): Determining therapeutic goals for treat-to-target. Am J Gastroenterol. 2015;110(9):1324–1338. doi:10.1038/ajg.2015.233.
- Tajra JB, Calegaro JU, de Paula AP, Bachour D, Silveira D, Lozi M, Cavalcanti H. Correlation and concordance measures between clinical, endoscopic and histological scores activity in Crohn’s disease under treatment. Scand J Gastroenterol. 2019;54(4):441–445. doi:10.1080/00365521.2019.1596305.
- Brennan GT, Melton SD, Spechler SJ, Feagins LA. Clinical implications of histologic abnormalities in ileocolonic biopsies of patients with Crohn’s Disease in remission. J Clin Gastroenterol. 2017;51(1):43–48. doi:10.1097/MCG.0000000000000507.
- Park S, Abdi T, Gentry M, Laine L. Histological disease activity as a predictor of clinical relapse among patients with ulcerative colitis: Systematic review and meta-analysis. Am J Gastroenterol. 2016;111(12):1692–1701. doi:10.1038/ajg.2016.418.
- Calafat M, Lobaton T, Hernandez-Gallego A, Mañosa M, Torres P, Cañete F, Cabré E, Ojanguren I, Domènech E. Acute histological inflammatory activity is associated with clinical relapse in patients with ulcerative colitis in clinical and endoscopic remission. Dig Liver Dis. 2017;49(12):1327–1331. doi:10.1016/j.dld.2017.08.041.
- Ponte A, Pinho R, Fernandes S, Rodrigues A, Alberto L, Silva JC, Silva J, Rodrigues J, Sousa M, Silva AP, et al. Impact of histological and endoscopic remissions on clinical recurrence and recurrence-free time in ulcerative colitis. Inflamm Bowel Dis. 2017;23(12):2238–2244. doi:10.1097/MIB.0000000000001275.
- Li K, Friedman JR, Chan D, Pollack P, Yang F, Jacobstein D, Brodmerkel C, Gasink C, and Feagan BG, et al. Effects of ustekinumab on histologic disease activity in patients with Crohn’s disease. Gastroenterology. 2019;157(4):1019–1031 e7. doi:10.1053/j.gastro.2019.06.037.
- Lowenberg M, Vermeire S, Mostafavi N, Hoentjen F, Franchimont D, Bossuyt P, Hindryckx P, Rispens T, and de Vries A, et al. Vedolizumab induces endoscopic and histologic remission in patients with Crohn’s disease. Gastroenterology. 2019;157(4):997–1006 e6. doi:10.1053/j.gastro.2019.05.067.
- Danese S, Sandborn WJ, Colombel JF, Vermeire S, Glover SC, Rimola J, Siegelman J, Jones S, and Bornstein JD, et al. Endoscopic, radiologic, and histologic healing with vedolizumab in patients with active Crohn’s disease. Gastroenterology. 2019;157(4):1007–1018 e7. doi:10.1053/j.gastro.2019.06.038.
- Gong W, Guo K, Zheng T, Fang M, Xie H, Li W, Hong Z, Ren H, and Gu G, et al. Correlation between endoscopic and histological validated scoring indices in Crohn’s disease. Dig Liver Dis. 2019;51(6):812–817. doi:10.1016/j.dld.2019.01.010.
- Christensen B, Erlich J, Gibson PR, Turner JR, Hart J, Rubin DT. Histologic healing is more strongly associated with clinical outcomes in ileal Crohn’s disease than endoscopic healing. Clin Gastroenterol Hepatol. 2019. doi:10.1016/j.cgh.2019.11.056.
- Van Rompaey L, Galien R, van der Aar EM, Clement-Lacroix P, Nelles L, Smets B, Lepescheux L, Christophe T, and Conrath K, et al. Preclinical characterization of GLPG0634, a selective inhibitor of JAK1, for the treatment of inflammatory diseases. J Immunol. 2013;191(7):3568–3577. doi:10.4049/jimmunol.1201348.
- Villarino AV, Kanno Y, O’Shea JJ. Mechanisms and consequences of JAK-STAT signaling in the immune system. Nat Immunol. 2017;18(4):374–384. doi:10.1038/ni.3691.
- Namour F, Diderichsen PM, Cox E, Vayssière B, Van der Aa A, Tasset C, Van‘t Klooster G. Pharmacokinetics and pharmacokinetic/pharmacodynamic modeling of filgotinib (GLPG0634), a selective JAK1 inhibitor, in support of phase IIB dose selection. Clin Pharmacokinet. 2015;54(8):859–874. doi:10.1007/s40262-015-0240-z.
- Lee J, Lee J, Kwok SK, Baek S, Jang SG, Hong S-M, Min J-W, Choi SS, Lee J, Cho M-L, et al. JAK −1 inhibition suppresses interferon-induced BAFF production in human salivary gland. Arthritis Rheumatol. 2018;70(12):2057–2066. doi:10.1002/art.40589.
- Chiriac MT, Buchen B, Wandersee A, Hundorfean G, Günther C, Bourjau Y, Doyle SE, Frey B, Ekici AB, Büttner C, et al. Activation of epithelial signal transducer and activator of transcription 1 by interleukin 28 controls mucosal healing in mice with colitis and is increased in mucosa of patients with inflammatory bowel disease. Gastroenterology. 2017;153(1):123–138 e8. doi:10.1053/j.gastro.2017.03.015.
- Ostvik AE, Svendsen TD, Granlund AVB, Doseth B, Skovdahl HK, Bakke I, Thorsvik S, Afroz W, and Walaas GA, et al. Intestinal epithelial cells express immunomodulatory ISG15 during active ulcerative colitis and Crohn’s disease. J Crohns Colitis. 2020. doi:10.1093/ecco-jcc/jjaa022.
- Tang Y, Tan SA, Iqbal A, Li J, Glover SC. STAT3 genotypic variant rs744166 and increased tyrosine phosphorylation of STAT3 in IL-23 responsive innate lymphoid cells during pathogenesis of Crohn’s disease. J Immunol Res. 2019;2019:9406146. doi:10.1155/2019/9406146.
- Daperno M, D’Haens G, Van Assche G, Baert F, Bulois P, Maunoury V, Sostegni R, Rocca R, and Pera A, et al. Development and validation of a new, simplified endoscopic activity score for Crohn’s disease: The SES-CD. Gastrointest Endosc. 2004;60(4):505–512. doi:10.1016/s0016-5107(04)01878-4.
- D’Haens GR, Geboes K, Peeters M, Baert F, Penninckx F, Rutgeerts P. Early lesions of recurrent Crohn’s disease caused by infusion of intestinal contents in excluded ileum. Gastroenterology. 1998;114(2):262–267. doi:10.1016/s0016-5085(98)70476-7.
- Reinisch W, De Hertogh G, D’Haens G, Li W, Serone A, Tasset C, Van der Aa A, Vermeire S. P633 concordance between endoscopy and histology scores at baseline and following induction therapy with the JAK1 inhibitor filgotinib in active Crohn’s disease: Results from FITZROY study. J Crohns Colitis. 2018;12(supplement_1):S430. doi:10.1093/ecco-jcc/jjx180.760.
- Ronneberger O, Fischer P, Brox T. U-Net: Convolutional networks for biomedical image segmentation. arXiv:150504597 [csCV]; 2015.
- Gomollon F, Dignass A, Annese V, Tilg H, Assche GV, Lindsay JO, Peyrin-Biroulet L, Cullen GJ, and Daperno M, et al. 3rd European evidence-based consensus on the diagnosis and management of Crohn’s disease 2016: Part 1: Diagnosis and medical management. J Crohns Colitis. 2017;11(1):3–25. doi:10.1093/ecco-jcc/jjw168.
- Billiet T, Cleynen I, Ballet V, Ferrante M, Van Assche G, and Gils A, et al. Prognostic factors for long-term infliximab treatment in Crohn’s disease patients: A 20-year single centre experience. Aliment Pharmacol Ther. 2016;44(7):673–683. doi:10.1111/apt.13754.
- Weiser M, Simon JM, Kochar B, Tovar A, Israel JW, Robinson A, Gipson GR, Schaner MS, Herfarth HH, Sartor RB, et al. Molecular classification of Crohn’s disease reveals two clinically relevant subtypes. Gut. 2018;67(1):36–42. doi:10.1136/gutjnl-2016-312518.
- Nardone OM, Cannatelli R, Zardo D, Ghosh S, Iacucci M. Can advanced endoscopic techniques for assessment of mucosal inflammation and healing approximate histology in inflammatory bowel disease? Therap Adv Gastroenterol. 2019;12:1756284819863015. doi:10.1177/1756284819863015.