
 ?Mathematical formulae have been encoded as MathML and are displayed in this HTML version using MathJax in order to improve their display. Uncheck the box to turn MathJax off. This feature requires Javascript. Click on a formula to zoom.
Abstract
In this study, it was aimed to investigate characteristics and intracellular delivery of two different-sized PLGA nanoparticles in ouzo region by considering number of nanoparticles. To determine the effect of formulation parameters on average particle size, Dil labeled nanoparticles were prepared using a three-factor, two-level full factorial statistical experimental design. PLGA230 (230.8 ± 4.32 nm) and PLGA160 (157.9 ± 6.16 nm) nanoparticles were obtained by altering polymer amount based on experimental design results and characterized. Same number of PLGA230 and PLGA160 nanoparticles per cell were applied onto HEK293 cells; then, cytotoxicity, uptake kinetics and mechanism were evaluated by flow cytometry and fluorescent microscopy. Also same weight of PLGA230 and PLGA160 nanoparticles were applied and cellular uptake of these nanoparticles was evaluated. It was found that PLGA230 nanoparticles had higher encapsulation efficiency and slower dye release compared to PLGA160 nanoparticles. When they were applied at same counts per cell, PLGA230 nanoparticles displayed faster and higher intracellular dye transfer than PLGA160 nanoparticles. On the other hand, PLGA160 appeared to be a more effective vehicle than PLGA230 when applied at the same weight concentration. It was also shown that for both nanoparticles, HEK293 cells employed macropinocytic, caveolae- and clathrin-mediated endocytic pathways.
Introduction
Nanoparticles provide several advantages such as improved drug release, drug stability, and drug cellular uptake (Panyam and Labhasetwar Citation2003). One of the most common investigated polymers to prepare nanoparticles is poly lactic-co-glycolic acid (PLGA), which is approved by the United States Food and Drug Administration (FDA) because of its biodegradable and biocompatible properties (Danhier et al. Citation2012). Different methods have been described to prepare PLGA nanoparticles, one of which is nanoprecipitation (or solvent displacement, or solvent shifting) that is an easier and a faster method than others (Lepeltier et al. Citation2014). In this method, polymer is dissolved in a semi-polar organic solvent and the resulting solution is added onto the aqueous phase, thereafter the polymer is precipitated as colloidal particles. The interfacial turbulences between these two phases which are governed by the Marangoni effect explain the mechanism of particle formation (Beck-Broichsitter et al. Citation2010, Sternling and Scriven Citation1959). In spite of all advantages of nanoprecipitation method, a major limitation of this process is that nanoparticles’ size were restricted only to a narrow region, so-called “Ouzo region” (50–300 nm) (Beck-Broichsitter et al. Citation2015, Lepeltier et al. Citation2014, Schubert et al. Citation2011).
Interaction between cells and nanoparticles is critical to understand the mechanisms of targeted drug delivery. Various studies showed the endocytic uptake as an effective route for the internalization of various types of nanoparticles where size, surface characteristics and shape have been determined as critical factors. For internalizing nanoparticles, major endocytic pathways are described as caveolae mediated endocytosis, clathrin-mediated endocytosis, and macropinocytosis (Hillaireau and Couvreur Citation2009, Prabha et al. Citation2016, Sahay et al. Citation2010, Yameen et al. Citation2014). To determine endocytic pathways, usage of pharmacological inhibitors is a well-established approach and various chemical inhibitors of endocytosis have been identified and evaluated (Chang et al. Citation2014, Dutta and Donaldson Citation2012, Sahay et al. Citation2010). Chlorpromazine can be inhibit clathrin mediated endocytosis that blocks the assembly of coated pits through anchoring clathrin and adaptor protein 2 complex to endosomes (Wang et al. Citation1993). Alternatively, arachidonate accumulation induced by indomethacin rapidly inhibits caveolae mediated endocytosis (Smart et al. Citation1995). Macropinocytosis inhibition is obtained with amiloride; though mechanism of inhibition is not well defined, blockage of Na+/H+ exchangers can be partly involved (Koivusalo et al. Citation2010). Furthermore, for determining cellular uptake of nanoparticles, selection of an ideal tracer is essential. To obtain fluorescent-labeled nanoparticles, nanoprecipitation is the most preferred method enabling efficient loading of various dyes (Reisch and Klymchenko Citation2016). 1,1′-dioctadecyl-3,3,3′3′-tetramethylindocarbocyanine perchlorate (Dil) is a hydrophobic dye and nanoparticles labeled with Dil are frequently used for uptake studies by fluorescence microscopy and flow cytometry (Abdel-Mottaleb et al. Citation2015, Chang et al. Citation2012).
Effect of nanoparticles’ size on intracellular delivery was investigated in various studies (He et al. Citation2010, Prabha et al. Citation2016, Sahay et al. Citation2010, Win and Feng Citation2005). Besides, investigation of nanoparticles’ number effects on cell culture studies become promising approach (Mendes et al. Citation2015, Unciti-Broceta et al. Citation2015). To date, the effect of PLGA nanoparticles’ size found in ouzo region and number impacts of these nanoparticles on intracellular delivery has not been tested. The aim of this study was to investigate characteristics and intracellular delivery of two different-sized PLGA nanoparticles in ouzo region by considering number of nanoparticles. To achieve this goal, we prepared and characterized different-sized Dil-labeled PLGA nanoparticles. These nanoparticles were applied onto HEK293 cells and cytotoxicity, kinetics and mechanisms of cellular uptake were investigated with flow cytometry and fluorescence microscopy.
Materials and methods
Materials
Dil, PLGA RG503, ethanol, dimethyl sulfoxide (DMSO), acetone, formaldehyde solution, poly(vinyl alcohol) (PVA) (87–90% hydrolyzed, average mol wt 30,000–70,000), sodium dodecyl sulfate (SDS), sodium azide (AZD), amiloride hydrochloride hydrate (AMD), indomethacin (IND) and chlorpromazine hydrochloride (CPZ), 2-(4-amidinophenyl)-6-indolecarbamidine dihydrochloride, 4′,6-Diamidino-2-phenylindole dihydrochloride (DAPI) were obtained from Sigma Aldrich (MO, USA). Tween 20 was purchased from Merck KGaA (Darmstadt, Germany). DRAQ7 cell viability dye was purchased from Biolegend (CA, USA). High Glucose Dulbecco’s modified Eagle’s medium (DMEM), Fetal bovine serum (FBS), l-glutamine and penicillin–streptomycin were obtained from Lonza (Basel, Switzerland). All the products were either chromatography grade or extra pure.
Preparation and optimization of nanoparticles
PLGA nanoparticles were prepared by nanoprecipitation (Barichello et al. Citation1999). Briefly, PLGA and fluorescent dye, 20 μg Dil in 100 μl ethanol, were dissolved in acetone as the organic phase. Organic phase was added dropwise into the aqueous phase, containing 10 ml PVA, while continuously stirring (IKA RET Basic, Germany). Following evaporation of the organic phase by magnetic stirring overnight, the obtained suspension was centrifuged at 24,000g for 45 min (Z 383 K, Hermle; Germany). The obtained nanoparticles were washed and dispersed in pure water twice. To screen the process parameters affecting particle size, a three-factor, two-level full factorial statistical experimental design was conducted using Minitab® 16 software (Minitab Inc.; PA, USA). The impact of polymer amount (X1), emulsifier concentration (X2), and organic phase volume (X3) on the average particle size (Y) of nanoparticles were determined (). After defining important process parameters on average particle size, effects of these parameters were analyzed based on the experimental design results. Finally, different-sized PLGA nanoparticles, PLGA230: 230.8 ± 4.32 nm and PLGA160: 157.9 ± 6.16 nm, were prepared as per the above method. 20 μg and 15 μg Dil in 100 μl ethanol were added into the acetone solution for respectively labelling PLGA230 and PLGA160 nanoparticles and in order to obtain the same dye density in the same weight of nanoparticles ().
Table 1. Independent variables and response for three-factor, two-level full factorial statistical experimental design.
Table 2. Characteristics of PLGA230 and PLGA160 nanoparticles.
Nanoparticles characterization
Size and zeta potential of nanoparticles were characterized using a Zetasizer Nano ZS (Malvern instruments, UK). Average particle size was measured by dynamic light scattering (DLS) (at 25 °C temperature and a 173° scattering angle). Size measurements were performed in ultrapure water and after incubation with cell culture medium for 24 h. Zeta potential measurements were performed at 25 °C, after appropriate dilutions in ultrapure water. In order to determine the encapsulation efficiency, 5 mg of nanoparticles were dissolved in DMSO. Then Dil amount in the nanoparticles was determined by UV spectrophotometry (Shimadzu UV-1800 spectrophotometer, Japan) at 555 nm. Encapsulation efficiency was calculated using the following equation:
For evaluation of in vitro dye release rate, same amount of nanoparticles was dispersed into eppendorf tubes in in phosphate-buffered saline (PBS) medium containing 0.5% (w/v) of SDS to provide sink conditions. The tubes were maintained at 37 °C and subjected to shaking at 100 rpm speed on a reciprocal water bath. Samples were taken at predetermined time points and centrifuged at 24,000g for 30 min. Supernatant was analyzed using UV spectroscopy to determine the released dye amount. Average mass of a nanoparticle was estimated by the following equation and counts of nanoparticles were calculated accordingly (Luk et al. Citation2014, Shang and Gao Citation2014):
where Mcore is the weight of a single nanoparticle, r is average nanoparticle radius determined by DLS and ρ = 1.33 g/mL the polymer density. Density of polymer was calculated by helium pycnometry (Quantachrome Ultrapycnometer 1000, Quantachrome Instruments, FL, USA). To evaluate molecular state of Dil labeled PLGA nanoparticles, Fourier-transform infrared (FTIR) spectra of Dil, PLGA, and Dil loaded PLGA nanoparticles were recorded on an ALPHA FTIR Spectrometer (Bruker; MA, USA) using 30 scans with a resolution of 4 cm−1 in 4000–400 cm−1 wavenumber region.
For determining the particle size as well as the morphology and shape of PLGA230 and PLGA160 nanoparticles, transmission electron microscopy (TEM) study was performed using a Tecnai G2 Spirit Biotwin 20–120 kV (FEI Company, Eidhoven, Netherland). Shortly, a drop of nanoparticle suspension in ultrapure water was dropped onto the grid, dried for 24 h and analyzed. Atomic force microscopy (AFM) study was performed using a Veeco MultiMode V (NY, USA) equipped with an AS-12 probe. Similarly, for TEM analyses, a drop of nanoparticle suspension in ultrapure water was dropped onto a microscope slide, dried for 24 h and analyzed.
Cytotoxicity and uptake studies
HEK293 cell line was obtained from American Type Culture Collection (ATCC, LGC promochem, Rockville, MD, USA). Cells were cultured in high glucose DMEM, supplemented with 10% fetal bovine serum, 1% U/ml streptomycin and 1% U/mL penicillin, and maintained at 37 °C in a 5% CO2 humidified atmosphere. Cytotoxicity of nanoparticles was determined as described by Akagi et al. (Akagi et al. Citation2013). Briefly, 106 cells were seeded in 6-well plates and the following day, PLGA230 and PLGA160 nanoparticles were added onto the cells at 1.25 × 10¹⁰/ml, 2.5 × 10¹⁰/ml, 5 × 10¹⁰/ml, 1011/ml, 2 × 10¹¹/ml (particle count/ml) concentration. At the end of incubation period, the cells were collected, washed, and dispersed in PBS solution. The cell suspension was then mixed with DRAQ7 (3 μM final concentration in the tube) cell viability dye and suspension was analyzed by flow cytometry (FACS Aria II, Becton-Dickinson, NJ, USA). Ten thousand events were read for each sample and auto fluorescence was corrected in each experimental group by using an aliquot of the cells which were not incubated with DRAQ7. DRAQ7-negative cells were used to determine the percentage of viable cells.
For determining nanoparticles cellular uptake, a concentration of 1.25 × 10¹⁰ particles/ml (corresponding to a concentration of 107 and 34.3 μg/ml for PLGA230 or PLGA160 nanoparticles) was used as an appropriate nanoparticle quantity since this amount had minimal cytotoxicity on HEK293 cells. Cells were seeded in 6-well plates described above and 1.25 × 10¹⁰ PLGA230 or PLGA160 nanoparticles were added. Following 1.5, 3, 6, 12, 24 h of incubation at 37 °C in 5% CO2 humidified atmosphere, the cells were harvested, washed, and dispersed in PBS. DRAQ7 was also applied to these cells in order to exclude dead cells from the analysis. Percentage of fluorescently stained cells and median fluorescence intensity (MFI) were analyzed by flow cytometry. In order to make a comparative analysis of cellular uptake of nanoparticles applied at the same number (1.25 × 10¹⁰ particles/ml) or at the same weight (34.3 μg/ml), two different assay setups were used. PLGA230 and PLGA160 nanoparticles that were prepared to possess the same weight or the same number were applied onto the cells for 24 h; then, the cells were washed with PBS and fixed with 4% formaldehyde for 20 min. After thoroughly washing, they were stained with DAPI in 0.1% Tween 20 for 30 min. To visualize the kinetics of nanoparticles’ uptake, equal numbers (1.25 × 10¹⁰) of PLGA230 and PLGA160 nanoparticles were also applied for 3, 12, and 24 h. The micrographs were taken using a fluorescent microscope (Leica, Wetzlar, Germany).
In order to investigate the nanoparticles’ uptake mechanisms, HEK293 cells were prepared in 6-well plates as described above and pretreated with the inhibitors (1.25 mM AMD, 45 μM CPZ, 15 μg/ml IND, and 3 μg/ml AZD) for 60 min at 37 °C. For determining dye leakage or contact mediated dye transfer, uptake studies were repeated at +4 °C for PLGA230 or PLGA160 (Ray et al. Citation2016, Snipstad et al. Citation2016). Then the nanoparticles (1.25 × 10¹⁰ particles/ml) were added and cellular uptake was evaluated by flow cytometry following 3 h and 24 h of incubation for PLGA230 or PLGA160 nanoparticles, respectively. These different time points were deliberately selected for each nanoparticle since microscopy analyses showed that nanoparticles were engulfed different time points.
Statistical analysis
At least three independent experiments were performed for every analysis. Data are presented as the mean ± standard deviation. Student’s t-test was used to compare two groups and the comparison of more than two groups were investigated using ANOVA followed by Tukey’s post hoc test with Minitab®16 (Minitab Inc.; State College, PA, USA). The difference between groups was considered statistically significant when p values was <0.05 (*).
Results and discussion
3.1. Influence of different variables on average particle size of PLGA nanoparticles
The average particle size of nanoparticles varied between 107.7 nm and 245.7 nm (Supplement Table 1) and all formulations showed uniform particle size distributions. The polydispersity index (PdI) of the nanoparticles was between 0.1 and 0.3. In experimental design, polymer amount and organic phase volume range were determined as 10 mg–30 mg and 1–3 ml, respectively. Above the upper limits of these ranges, aggregation was observed and below the lower limits, the yield was too low. Also, upper and lower limits of PVA were determined as 0.5% (w/v) and 1% (w/v) in this study, based on previous studies. The important factor effects on the average particle size were determined as polymer amount and organic phase volume based on Pareto charts (Supplement Figure A1). It is known that the incomplete removal of residual solvents from nanoparticle suspension may cause severe aggregation of PLGA nanoparticles during ultracentrifugation, as well as cytotoxicity (Sah and Sah Citation2015). Thus, residual PVA is also an important factor for cellular uptake of nanoparticles, as increased amounts of PVA could decrease nanoparticles’ cellular uptake (Sahoo et al. Citation2002). To obtain minimum cytotoxicity and maximum cellular uptake, PVA concentration and organic phase amount were fixed as the lower amount in the preparation process. Different-sized nanoparticles were obtained with altering polymer amount and the effects of the polymer concentration on average particle size was determined. Experimental design results and further analyses showed that increasing polymer concentration () increased average particle size. It is demonstrated that solvent diffusion into the external phase become more slowly with increasing viscosity of the organic phase, and provokes larger polymer aggregation (Beck-Broichsitter et al. Citation2010). The other critical factor in the preparation process is the emulsifier which plays a key role in separating the polymer containing phase from the dispersion medium. Use of emulsifiers could also affect particle size distribution and encapsulation efficiency of nanoparticles. When preparing PLGA nanoparticles, PVA is the most commonly used emulsifier because it enables preparing small, uniform, and easily dispersible nanoparticles (Saadati and Dadashzadeh Citation2014). In this study, alteration of PVA concentration between 0.5 and 1% (w/v) did not affect the average particle size of Dil-labelled PLGA nanoparticles significantly.
Figure 1. Size and dye release properties of PLGA230 and PLGA160 nanoparticles. (A) Average particle size of Dil-labelled PLGA nanoparticles as a function of the polymer concentration. (B) Release of Dil from PLGA230 and PLGA160 nanoparticles into 0.5% (w/v) SDS containing PBS. AFM (C) and TEM (D) images of PLGA230 nanoparticles and PLGA160 nanoparticles.
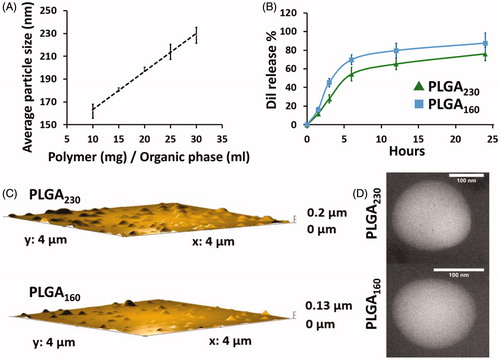
Size distributions of PLGA230 (230.8 ± 4.32 nm) and PLGA160 (157.9 ± 6.16 nm) were highly monodisperse (PdI was less than 0.15) () (Gaudin et al. Citation2014). Zeta potential values of the PLGA230 and PLGA160 nanoparticle formulations were found to be −6.32 (± 0.9) and −11.2 (± 4.7) mV, respectively. These zeta potential values of nanoparticles were not found statistically different (p > .05). Dye encapsulation efficiency of nanoparticles was calculated as 25.7 ± 1.7% for PLGA160 nanoparticles and 57.1 ± 2.9% for PLGA230 nanoparticles. These data showed that higher polymer concentrations increased encapsulation efficiencies (). The reason is that a high viscosity holds back the shear forces of solution, and prevents leakage of Dil (Gao et al. Citation2006). In recent studies, Dil was used as a tracer for nanoparticle uptake but its release in sink conditions was not tested (Abdel-Mottaleb et al. Citation2015, Chang et al. Citation2009, Chang et al. Citation2012). In this study, sink condition was provided for Dil and its release from nanoparticles was determined using a release medium containing 0.5% (w/v) SDS. Release of the dye was found to be bimodal: First, a burst release was observed in 6 h and release continued over 24 h (). This initial burst can be the reason for the surface adsorbed dye diffusion (Mishra et al. Citation2016). These results have to be taken into consideration since such extracellular Dil release may influence the cell uptake results interpretation. In addition, Dil release from PLGA230 nanoparticles was slower than PLGA160 nanoparticles. It has been acknowledged that PLGA160 nanoparticles’ larger surface and shorter distance from the core could cause a faster dye release (Makadia and Siegel Citation2011) TEM and AFM results showed nearly spherical nanoparticles with smooth surface properties (). PLGA230 and PLGA160 nanoparticles displayed clear differences in particle size as confirmed by DLS measurements. The main cause of this difference could be explained by the increasing organic phase’s viscosity and polymer chain association (Mora-Huertas et al. Citation2011). FTIR spectra analyses showed that Dil FTIR displayed bands at 2920, and 2853 cm−1 related to stretching vibrations of the CH2 group (Debnath et al. Citation2015). Specifically, the FTIR spectra of PLGA160 nanoparticles included characteristic peaks of Dil (Supplement Figure A2) indicating that Dil was not completely encapsulated into the nanoparticles core. Additionally, the stability of the nanoparticles’ average particle size was investigated in cell culture media where no aggregation was observed ().
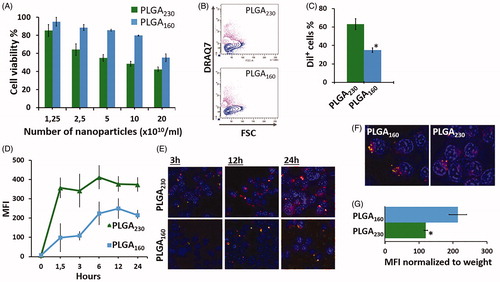
Figure 2. Effect of different-sized PLGA nanoparticle counts (nanoparticle number/ml) on cell viability and cellular uptake. (A) Cytotoxicity of PLGA230 and PLGA160 nanoparticles incubated at different nanoparticles counts with HEK293 cells. Cytotoxicity was determined using DRAQ7 viability dye. Percentage of viable cells is shown. (B) Typical DRAQ7 viability assay flow cytometry contour plots for cells treated with 5 × 10¹⁰/ml PLGA230 and PLGA160 nanoparticles. Purple (or gray) contours represent dead cells that are labelled with DRAQ7 (FSC, forward scatter). (C) Percentage of Dil+ cells that engulfed nanoparticles at the end of 24 h incubation time. (D) Change in the fluorescence intensity at various time points showing uptake kinetics of Dil-labeled PLGA230 and PLGA160 nanoparticles applied at counts number of 1.25 × 10¹⁰/ml. (E) Fluorescence microscopy images of PLGA230 and PLGA160 nanoparticles incubated with cells at same numbers of nanoparticles/ml (1.25 × 10¹⁰/ml). The cell nuclei were stained with DAPI. The Dil-loaded nanoparticles can be observed as inclusion bodies. (F) The fluorescence microscope images of the cells treated with same weight of PLGA230 and PLGA160 nanoparticles (G) The uptake efficiency of nanoparticles when the fluorescence intensity was normalized to the amount of dye encapsulated (i.e. weight of the nanoparticles) into the nanoparticles (1.25 × 10¹⁰/ml, 24 h incubation). (*p < 0.05).
Cytotoxicity and cellular uptake of nanoparticles
Both PLGA230 and PLGA160 engulfed by cells and for all concentrations, PLGA230 nanoparticles were found to be more cytotoxic than PLGA160 nanoparticles (). More than 80% of the cells were viable following 24 h of incubation with 1.25 × 10¹⁰ PLGA230 or PLGA160 nanoparticles (). Higher surface area and higher weight of PLGA230 nanoparticles might account for such increased cytotoxicity (Napierska et al. Citation2009). For further studies, a concentration of 1.25 × 10¹⁰ nanoparticle counts/ml was selected, because it corresponded to the higher nanoparticles concentration without cytotoxicity. Concerning nanoparticles cell internalization, it was found that, 63.1 ± 4.9% and 34.9 ± 8.6% of the cells became fluorescent after 24 h incubation with Dil-labeled PLGA230 and PLGA160 nanoparticles, respectively (). It was also observed that uptake of PLGA230 and PLGA160 nanoparticles reached to a plateau after respectively 1.5 h and 6 h incubation (). Indeed, the size-dependent sedimentation rate and the concentration of the nanoparticles on the cells resting at the bottom of the culture wells might constitute a technical problem leading to heterogeneous results. This has been recognized especially with larger nanoparticles, i.e. PLGA230, that can easily form gravity concentration gradients (Agarwal et al. Citation2013, Cho et al. Citation2011). Accordingly, when the percentage of cells that engulfed nanoparticles and the amount of nanoparticles harbored by these cells (MFI values) were analyzed, it was found that PLGA230 displayed higher and faster uptake than same counts of PLGA160 nanoparticles (). These results that were obtained by flow cytometry were also confirmed by fluorescence microscopy (). In addition, the effect of particle number versus weight on cellular uptake was compared. When applied at the same weight concentration, PLGA160 was more effective than PLGA230 () whereas at the same number concentration, PLGA230 displayed higher cellular uptake than that of PLGA160 nanoparticles (). Normally, the difference in the dye loading capacities of the PLGA230 and PLGA160 may be the simplest explanation for these results. On the other hand, when the fluorescence intensities obtained from the cells that engulfed the nanoparticles were normalized to the amount of dye encapsulated into the nanoparticles. The cellular uptake of PLGA160 at the same weight concentration was still better than that of PLGA230 (). Collectively, our results demonstrated that the efficacy of PLGA160 was not critically affected by the dye-loading capacity. Downsizing nanoparticles results in the increment of the specific surface area that enhances the contact with the cell membrane (Muro et al. Citation2008). Therefore, when used at the same weight concentration, the smaller nanoparticles are superior in interacting with the cell surface.
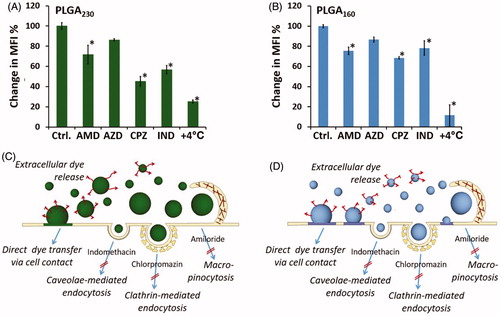
The cellular uptake mechanisms of nanoparticles were then investigated by using pharmacological inhibitors targeting different endocytic pathways. HEK293 is a well-defined cell line, widely used for studying endocytic processes of nanoparticles (Agarwal et al. Citation2013, Chang et al. Citation2014). It was found that chlorpromazine, an inhibitor of clathrin-mediated endocytosis, significantly reduced the uptake of both PLGA230 and PLGA160 nanoparticles (). It was previously demonstrated that nanoparticles with a size less than 200 nm preferentially enter cells via clathrin-mediated endocytosis where corona composition of PLGA such as adsorption of transferrin can activate this pathway (Rejman et al. Citation2004). Additionally, our studies showed that HEK293 cells used macropinocytic (blocked by amiloride) and caveolae-mediated (blocked by indomethacin) pathway for taken up PLGA230 and PLGA160 nanoparticles (). The caveolin-mediated endocytosis may be advantageous since it may allow nanoparticles payload to escape from lysosomal degradation. Interestingly, even though the uptake of PLGA230 and PLGA160 nanoparticles decreased in the presence of sodium azide, at the concentration used, it did not reach the level of statistical significance (). Also, upon incubation at +4 °C which totally impedes all cellular transport dynamics, the cells displayed a slight positivity for the fluorescent dye (, Supplement Figure A3). These results indicated that the leakage from the nanoparticles or the contact-mediated dye transfer were also effective during the in vitro uptake experiments (). Here, inhibition of a single endocytic pathway could not completely abrogate intracellular delivery of PLGA230 or PLGA160 nanoparticles. This might be due to two possible reasons: i) the concentration of endocytosis inhibitors, which did not interfere with cell viability, was not enough to completely stop endocytosis and/or ii) the possible non-specific mechanisms such as extracellular dye release and membrane dye transfer were also responsible. Collectively, various endocytic pathways that were employed at different extents could serve as a salvage system maintaining PLGA nanoparticles’ cellular entry.
Figure 3. Evaluation of endocytic pathways employed in cell uptake of PLGA230 (A and B) and PLGA160 (C and D) nanoparticles. The cells were pre-treated with different endocytosis inhibitors (as shown in B and D) and the same numbers of Dil-labeled nanoparticles were applied onto the cells. The percentage change in median fluorescence intensity values were calculated in comparison to the control cells that were not treated with inhibitors. Schematic representation of possible intracellular drug delivery mechanisms of PLGA230 (B) and PLGA160 (D) nanoparticles are summarized.
Conclusions
In conclusion, PLGA230 nanoparticles had higher encapsulation efficiency and slower dye release compared to that of PLGA160 nanoparticles. In cell culture studies, when they were applied at same counts per cell, PLGA230 nanoparticles displayed faster and higher intracellular dye transfer than PLGA160 nanoparticles. On the other hand, PLGA160 appeared to be a more effective vehicle than PLGA230 when applied at the same weight concentration. In addition, regardless of particle size HEK293 cells used macropinocytic, caveolae- and clathrin- mediated endocytic pathways to uptake both PLGA230 and PLGA160 nanoparticles. Collectively, our findings suggest that a small variation in the average particle size can change the nanoparticles’ characteristics and influence their efficacy for cellular delivery.
Sahin_el_al._supplemental_content.docx
Download MS Word (7.2 MB)Acknowledgements
TEM and AFM analyses were performed in Middle East Technical University Central Laboratory. FTIR analyses were performed in ILKO ARGEM. This research was supported by The Science and Technical Research Council of Turkey (TUBITAK) [grant numbers: 113S119]. Adem Sahin was supported by PhD Scholarship Program (2211-A) of TUBITAK.
Related Research Data
References
- Abdel-Mottaleb MM, Beduneau A, Pellequer Y, Lamprecht A. 2015. Stability of fluorescent labels in PLGA polymeric nanoparticles: quantum dots versus organic dyes. Int J Pharm. 494:471–478.
- Agarwal R, Singh V, Jurney P, Shi L, Sreenivasan SV, Roy K. 2013. Mammalian cells preferentially internalize hydrogel nanodiscs over nanorods and use shape-specific uptake mechanisms. Proc Natl Acad Sci U S A. 110:17247–17252.
- Akagi J, Kordon M, Zhao H, Matuszek A, Dobrucki J, Errington R, et al. 2013. Real-time cell viability assays using a new anthracycline derivative DRAQ7®. Cytometry A. 83:227–234.
- Barichello JM, Morishita M, Takayama K, Nagai T. 1999. Encapsulation of hydrophilic and lipophilic drugs in PLGA nanoparticles by the nanoprecipitation method. Drug Dev Ind Pharm. 25:471–476.
- Beck-Broichsitter M, Nicolas J, Couvreur P. 2015. Solvent selection causes remarkable shifts of the “Ouzo region” for poly(lactide-co-glycolide) nanoparticles prepared by nanoprecipitation. Nanoscale. 7:9215–9221.
- Beck-Broichsitter M, Rytting E, Lebhardt T, Wang X, Kissel T. 2010. Preparation of nanoparticles by solvent displacement for drug delivery: a shift in the “ouzo region” upon drug loading. Eur J Pharm Sci. 41:244–253.
- Chang CC, Wu M, Yuan F. 2014. Role of specific endocytic pathways in electrotransfection of cells. Mol Ther Methods Clin Dev. 1:14058.
- Chang J, Jallouli Y, Kroubi M, Yuan XB, Feng W, Kang CS, Pu PY, Betbeder D. 2009. Characterization of endocytosis of transferrin-coated PLGA nanoparticles by the blood-brain barrier. Int J Pharm. 379:285–292.
- Chang J, Paillard A, Passirani C, Morille M, Benoit JP, Betbeder D, Garcion E. 2012. Transferrin adsorption onto PLGA nanoparticles governs their interaction with biological systems from blood circulation to brain cancer cells. Pharm Res. 29:1495–1505.
- Cho EC, Zhang Q, Xia Y. 2011. The effect of sedimentation and diffusion on cellular uptake of gold nanoparticles. Nat Nanotechnol. 6:385–391.
- Danhier F, Ansorena E, Silva JM, Coco R, Le Breton A, Preat V. 2012. PLGA-based nanoparticles: an overview of biomedical applications. J Control Release. 161:505–522.
- Debnath P, Chakraborty S, Deb S, Nath J, Bhattacharjee D, Hussain SA. 2015. Reversible transition between excimer and J-aggregate of indocarbocyanine dye in Langmuir–Blodgett (LB) films. J Phys Chem C. 119:9429–9441.
- Dutta D, Donaldson JG. 2012. Search for inhibitors of endocytosis: intended specificity and unintended consequences. Cell Logist. 2:203–208.
- Gao H, Yang YW, Fan YG, Ma JB. 2006. Conjugates of poly(DL-lactic acid) with ethylenediamino or diethylenetriamino bridged bis(beta-cyclodextrin)s and their nanoparticles as protein delivery systems. J Control Release. 112:301–311.
- Gaudin A, Yemisci M, Eroglu H, Lepetre-Mouelhi S, Turkoglu OF, Donmez-Demir B, et al. 2014. Squalenoyl adenosine nanoparticles provide neuroprotection after stroke and spinal cord injury. Nat Nanotechnol. 9:1054–1062.
- He C, Hu Y, Yin L, Tang C, Yin C. 2010. Effects of particle size and surface charge on cellular uptake and biodistribution of polymeric nanoparticles. Biomaterials. 31:3657–3666.
- Hillaireau H, Couvreur P. 2009. Nanocarriers’ entry into the cell: relevance to drug delivery. Cell Mol Life Sci. 66:2873–2896.
- Koivusalo M, Welch C, Hayashi H, Scott CC, Kim M, Alexander T, et al. 2010. Amiloride inhibits macropinocytosis by lowering submembranous pH and preventing Rac1 and Cdc42 signaling. J Cell Biol. 188:547–563.
- Lepeltier E, Bourgaux C, Couvreur P. 2014. Nanoprecipitation and the “Ouzo effect”: application to drug delivery devices. Adv Drug Deliv Rev. 71:86–97.
- Luk BT, Jack Hu C-M, Fang RH, Dehaini D, Carpenter C, Gao W, Zhang L. 2014. Interfacial interactions between natural RBC membranes and synthetic polymeric nanoparticles. Nanoscale. 6:2730–2737.
- Makadia HK, Siegel SJ. 2011. Poly Lactic-co-Glycolic Acid (PLGA) as biodegradable controlled drug delivery carrier. Polymers (Basel). 3:1377–1397.
- Mendes LP, Delgado JMF, Costa ADA, Vieira MS, Benfica PL, Lima EM, Valadares MC. 2015. Biodegradable nanoparticles designed for drug delivery: the number of nanoparticles impacts on cytotoxicity. Toxicol Vitro. 29:1268–1274.
- Mishra B, Padaliya R, Patel RR. 2016. Exemestane encapsulated vitamin E-TPGS-polymeric nanoparticles: preparation, optimization, characterization, and in vitro cytotoxicity assessment. Artif Cells Nanomed Biotechnol. [Epub ahead of print]. DOI:10.3109/21691401.2016.1163714
- Mora-Huertas CE, Fessi H, Elaissari A. 2011. Influence of process and formulation parameters on the formation of submicron particles by solvent displacement and emulsification-diffusion methods critical comparison. Adv Colloid Interface Sci. 163:90–122.
- Muro S, Garnacho C, Champion JA, Leferovich J, Gajewski C, Schuchman EH, Mitragotri S, Muzykantov VR. 2008. Control of endothelial targeting and intracellular delivery of therapeutic enzymes by modulating the size and shape of ICAM-1-targeted carriers. Mol Ther. 16:1450–1458.
- Napierska D, Thomassen LC, Rabolli V, Lison D, Gonzalez L, Kirsch-Volders M, Martens JA, Hoet PH. 2009. Size-dependent cytotoxicity of monodisperse silica nanoparticles in human endothelial cells. Small. 5:846–853.
- Panyam J, Labhasetwar V. 2003. Biodegradable nanoparticles for drug and gene delivery to cells and tissue. Adv Drug Deliv Rev. 55:329–347.
- Prabha S, Arya G, Chandra R, Ahmed B, Nimesh S. 2016. Effect of size on biological properties of nanoparticles employed in gene delivery. Artif Cells Nanomed Biotechnol. 44:83–91.
- Qaddoumi MG, Ueda H, Yang J, Davda J, Labhasetwar V, Lee VHL. 2004. The characteristics and mechanisms of uptake of PLGA nanoparticles in rabbit conjunctival epithelial cell layers. Pharmaceut Res. 21:641–648.
- Ray S, Ghosh Ray S, Mandal S. 2016. Development of bicalutamide-loaded PLGA nanoparticles: preparation, characterization and in-vitro evaluation for the treatment of prostate cancer. Artif Cells Nanomed Biotechnol. [Epub ahead of print]. DOI:10.1080/21691401.2016.1196457
- Reisch A, Klymchenko AS. 2016. Fluorescent polymer nanoparticles based on dyes: seeking brighter tools for bioimaging. Small. 12:1968–1992.
- Rejman J, Oberle V, Zuhorn IS, Hoekstra D. 2004. Size-dependent internalization of particles via the pathways of clathrin- and caveolae-mediated endocytosis. Biochem J. 377:159–169.
- Saadati R, Dadashzadeh S. 2014. Marked effects of combined TPGS and PVA emulsifiers in the fabrication of etoposide-loaded PLGA-PEG nanoparticles: in vitro and in vivo evaluation. Int J Pharm. 464:135–144.
- Sah E, Sah H. 2015. Recent trends in preparation of poly(lactide-co-glycolide) nanoparticles by mixing polymeric organic solution with antisolvent. J Nanomater. 2015:22.
- Sahay G, Alakhova DY, Kabanov AV. 2010. Endocytosis of nanomedicines. J Control Release. 145:182–195.
- Sahoo SK, Panyam J, Prabha S, Labhasetwar V. 2002. Residual polyvinyl alcohol associated with poly (D,L-lactide-co-glycolide) nanoparticles affects their physical properties and cellular uptake. J Control Release. 82:105–114.
- Schubert S, Delaney JT, Schubert US. 2011. Nanoprecipitation and nanoformulation of polymers: from history to powerful possibilities beyond poly(lactic acid). Soft Matter. 7:1581–1588.
- Shang J, Gao X. 2014. Nanoparticle counting: towards accurate determination of the molar concentration. Chem Soc Rev. 43:7267–7278.
- Smart EJ, Estes K, Anderson RGW. 1995. Inhibitors that block both the internalization of caveolae and the return of plasmalemmal vesicles. Cold Spring Harb Symp Quant Biol. 60:243–248.
- Snipstad S, Hak S, Baghirov H, Sulheim E, Morch Y, Lelu S, et al. 2016. Labeling nanoparticles: Dye leakage and altered cellular uptake. Cytometry A. [Epub ahead of print]. DOI:10.1002/cyto.a.22853
- Sternling CV, Scriven LE. 1959. Interfacial turbulence: hydrodynamic instability and the marangoni effect. AIChE J. 5:514–523.
- Unciti-Broceta JD, Cano-Cortés V, Altea-Manzano P, Pernagallo S, Díaz-Mochón JJ, Sánchez-Martín RM. 2015. Number of nanoparticles per cell through a spectrophotometric method – a key parameter to assess nanoparticle-based cellular assays. Sci Rep. 5:10091.
- Wang LH, Rothberg KG, Anderson RG. 1993. Mis-assembly of clathrin lattices on endosomes reveals a regulatory switch for coated pit formation. J Cell Biol. 123:1107–1117.
- Win KY, Feng SS. 2005. Effects of particle size and surface coating on cellular uptake of polymeric nanoparticles for oral delivery of anticancer drugs. Biomaterials. 26:2713–2722.
- Yameen B, Choi WI, Vilos C, Swami A, Shi J, Farokhzad OC. 2014. Insight into nanoparticle cellular uptake and intracellular targeting. J Control Release. 190:485–499.