
 ?Mathematical formulae have been encoded as MathML and are displayed in this HTML version using MathJax in order to improve their display. Uncheck the box to turn MathJax off. This feature requires Javascript. Click on a formula to zoom.
Abstract
Incompetence of antiretrovirals (ARV) in complete eradication of HIV from the CNS is the biggest issue in neuro-AIDS treatment. The ineffectiveness is largely due to the poor penetration of ARV. Hence, the present study is attempted to enhance the CNS uptake of efavirenz (EFV) by designing intranasal EFV nanoparticles (EFV-NPs). EFV-NPs were fabricated using chitosan-g-HPβCD by ionic gelation method and optimized using quadratic response surface methodology (RSM) employing two-factor, five-level circumscribed central composite design. NPs containing drug: polymer ratio (1.25:0.79) were spherical with 198 ± 4.4 nm size, 23.28 ± 1.5% drug loading and 38 ± 1.43% entrapment efficiency. NPs showed sustained drug release (99.03 ± 0.30% in 8 h) and followed Fickian diffusion mechanism. It gave 4.76 times greater permeability than plain drug solution through porcine nasal mucosa. Enhanced CNS bioavailability (12.40-fold that of i.v solution) of EFV, high drug-targeting percentage (99.24%) and drug-targeting index (141.3) post-intranasal administration of NPs was observed. These results are corroborated by gamma scintigraphy images, which revealed high CNS uptake. NPs appeared histocompatible with porcine nasal mucosa and non-toxic to L929 cell line. Thus, CS-g-HPβCD served as a potential carrier in developing intranasal mucoadhesive EFV-NPs for the CNS targeting.
Introduction
Human immunodeficiency virus (HIV) has triggered a devastating global pandemic with over 36.7 (34.3–39.4) million seropositive people [Citation1]. The HIV virus is neurotropic which invades the CNS in early stages of systemic infection and makes dominant reservoirs in the CNS. The HIV may migrate in the CNS directly or via mononuclear phagocytosis (“Trojan horse” mechanism) and invades the brain macrophages and microglia cells, which are the chief producers of HIV by binding with CD4 receptors and chemokine receptors (CXCR4 and CCR5) which releases toxins and viral proteins in CNS leading to major and minor neurocognitive disorders and HIV-associated dementia (HAD). The HIV-associated neurological sequelae in CNS constitutes for neuro-AIDS. Though the combination antiretroviral therapy (cARV) plays cornerstone role in the treatment of acquired immune deficiency syndrome (AIDS), but complete eradication of HIV from this latent reservoir is the biggest issue in neuro-AIDS treatment mainly because of incapability of antiretrovirals (ARV) to cross various biological barriers like the blood–brain barrier (BBB) and the blood cerebrospinal fluid barrier (BCSFB), poor absorption and limited oral bioavailability, long-term drug therapy, requirement of high dose and chronic therapy, lack of compliance, multi-drug resistance may be due to mutations in HIV, high plasma protein binding, substrate for efflux transporters, powerful metabolic enzymes and transporters including members of ATP binding cassette (ABC) and solute carrier super families. The CSF: plasma ratio of currently available ARV is 0.002 to 0.63, which is unable to prevent low and sustained viral replication even on prolonged cARV therapy [Citation2,Citation3]. Targeting of CNS via intranasal (IN) route is an excellent non-invasive, safe and patient friendly alternative to improve therapeutic efficacy and bioavailability of drugs. Drugs may be delivered via systemic, olfactory or trigeminal pathway for the treatment of neurological disorders. Literature reveals successful IN delivery of various neurotherapeutics including small drug molecules, proteins, peptides, hormones, biological cells [Citation4]. According to Hanson and Frey, IN delivery of ARV could be used in prevention and treatment of neuro-AIDS [Citation5]. Literature indicates successful delivery ARV by IN routes, Abeer M. Al-Ghananeem and coworkers [Citation6] have formulated didanosine-chitosan nanoparticles with increased drug delivery in the CNS, Barbi et al [Citation7] prepared zidovudin-chitosan nanoparticles for IN delivery, Dalpiaz A. and coworkers has conjugated zidovudine to ursodeoxycholic acid to produce prodrug which remained in murine macrophages 20 times higher than zidovudine and designed chitosan chloride microparticles had more CSF uptake in rat [Citation8], Mahajan et al. [Citation9] developed saquinavir mesylate nanoemulsion and Chiappetta et al. [Citation10] developed efavirenz poly(ethylene oxide)-poly(propylene oxide) polymeric micelles with fivefold increase in bioavailability of drug compared to intravenous (i.v.) administration.
Nanosystems, specially designed for IN delivery helps in enhancing CNS bioavailability of drug as they offer protection from biological and chemical degradation, and extracellular transport through P-gp efflux proteins, small size allows transcellular transport through neuronal pathway, surface modification and receptor mediated endocytosis can increase CNS drug level in neuro-AIDS [Citation11].
Efavirenz (EFV) is widely used first line non-nucleoside reverse transcriptase inhibitors (NNRTI). It belongs to BCS class II category having high lipophilicity (log p = 5.4), poor intrinsic water solubility (4 μg/mL), limited oral bioavailability (40–50%), with high intra and inter-individual variability of 19–24% and 55–58%, respectively [Citation10,Citation12].
Chitosan (CS) can be modified chemically to introduce novel functions due to presence of primary amine group at the C-2 position and primary alcoholic group at the C-6 of its monomeric units [Citation13]. In cyclodextrin (CD) (α-1,4)-linked α-D-glucopyranose units with lipophilic central cavity and hydrophilic outer surface, primary hydroxyl groups are present at 6th position, while secondary at 2nd and 3rd position which can be functionalized to alter its properties [Citation14]. To date, various researchers have grafted CDs on CS to modify drug release property, solubility and for efficient drug delivery of hydrophobic drugs [Citation15].
We have previously grafted tosylated HPβCD on CS backbone to synthesize water soluble chitosan-grafted HPβCD (CS-g-HPβCD) by one pot synthesis technique and we found improvement in the solubility of EFV which is patented [Citation16].
In the present investigation, the biocompatible grafted copolymer (CS-g-HPβCD) having capability to hike aqueous solubility of EFV while maintaining mucosal adhesivity and permeability properties of CS was utilized for the formulation of intranasal EFV nanoparticle (EFV NPs) to enhance CNS bioavailability of EFV in the treatment of neuro-AIDS.
Materials and methods
Efavirenz was supplied by Aurobindo Pharma (Hyderabad, India). Chitosan chlorhydrate (90% deacetylated consists of 90% glucosamine chlorhydrate and 10% N-acetylglucosamine, average molecular weight 390 kDa) was the generous gift from Mahatani Chitosan Pvt. Ltd. (Veraval, India). Hydroxypropyl-β-cyclodextrin (KLEPTOSE HPB parentral grade MW 1.54 kDa) was supplied by Roquettee India Pvt Ltd, (Mumbai, India). All other chemicals used for study were of analytical grade.
Preparation of efavirenz-chitosan-g-hydroxypropyl β-cyclodextrin nanoparticles (EFV-NPs)
Polymeric NPs were prepared using the mild ionic gelation method [Citation17]. In the trial batches, effect of polymer: sodium tripolyphosphate (TPP), type of surfactant and concentration of surfactant on particle size was studied. Polymer:TPP ratio was fixed at 0.38:18 and 1% w/v of Tween 80 was selected for the formulation of different batches of nanoparticles. Polymeric solutions containing drug were prepared with varying drug:polymer ratio as per the matrix generated by (Design-Expert® Software,Version 7.0). Briefly, the drug-loaded polymeric solution of CS-g-HPβCD (10 mL) was prepared in water with pH 4.5, tween 80 (1%w/v) was added as a surfactant, subsequently TPP (10 mL) was added at once with constant stirring at 2000 rpm for 30 min. NPs were spontaneously obtained which were separated by centrifugation (15,000 rpm for 45 min) and freeze-dried with 3% w/v trehalose.
Experimental design for formulation optimization
In the present work, EFV-NPs were prepared and optimized using quadratic response surface methodology (RSM) employing two-factor, five-level circumscribed central composite 22+ star design. The polynomial fitting quality was employed to quantify the effect of independent formulation variable such as drug concentration (A) and polymer concentration (B) on the response variables like particle size (Y) with constraints applied. For each of the two factors, design consisted of three groups of design points: two factorial level design points fixed at +1 and -1; a centre-level design point fixed at 0 and two star-level design fixed at + α and –α (α = 1.414). According to design, a total 13 runs including 4 factorial points, 5 central points and 4 axial points were performed ().
Table 1. Coded and actual values of independent variables of two experimental factors according to the matrix generated by central composite design for various runs and experimental values of responses.
Central composite designs generated following equation
(1)
(1) where Y is measured response, A and B are independent formulation variables.
Characterization of EFV-NPs
Particle size and zeta potential
Particle size of NPs was determined by photon correlation spectrophotometer, which analyses the fluctuations in light scattering due to the Brownian motion of the particles while zeta potential was determined by Electophoretic Light Scattering (ELS) technique using a Zeta sizer ZS90, (Malvern Instrument Ltd., UK).
Per cent drug-loaded and per cent encapsulation efficiency
Per cent drug loaded was determined by stirring crushed 100 mg of NPs in 100 mL of saline phosphate buffer pH 7.4 for 48 h. Resulted suspension was centrifuged and absorbance was recorded spectrophotometrically at 247 nm.
Per cent drug-loaded and per cent encapsulation efficiency was calculated using the following formulae:
(2)
(2)
(3)
(3)
Fourier transform infrared spectra (FT-IR)
The Fourier transform infrared (FT-IR) spectra of the of CS, HPβCD, CS-g-HPβCD, EFV, physical mixture of CS-g-HPβCD with EFV (1:1) and EFV-NPs were recorded on FTIR spectrophotometer (Shimadzu Asia Pacific Pvt. Ltd. Singapore spectrometer Model No – 84005) in the range of 4000–400 cm−1 using KBr pellets.
Differential scanning calorimetry (DSC)
Differential scanning calorimetric analysis was performed (Mettler Toledo AG, Analytical, Switzerland) to investigate the thermal and crystalline behaviour of CS-g-HPβCD, EFV, physical mixture of CS-g-HPβCD with EFV (1:1) and EFV-NPs. A heating rate of 10 °C/min was employed in the range of 40–450 °C. Analysis was performed under nitrogen purge (50 mL/min).
X-ray diffractometry (XRD)
Crystal characteristics of CS, CS-g-HPβCD and EFV-NPs were analyzed by powder X-ray diffraction (XRD) on (Bruker AXS D8 advance theta/2theta) using CuKα radiation source at λ = 1.5406 Å. Scan parameters were set at 5 s scan speed and increament at 0.02. A diffraction pattern in the range of 0–40° (2θ) was used at 25 °C.
Transmission electron microscopy (TEM)
The morphology of NPs was observed under transmission electron microscope (Hitachi H-7500 120 kV equipped with CCD Camera, Japan) by using negative staining technique.
In vitro drug diffusion study
Franz’s diffusion cell (Electrolab, India, Pvt. Ltd. ED2–02-1505003) having capacity 7.5 mL, 15 mm diameter was used to study in vitro drug diffusion across the dialysis membrane-70 (Molecular weight cut-off 12,000–14,000 kDa). Formulation equivalent to 1 mg EFV was placed over the membrane in the donor compartment, while 7.5 mL diffusion medium (PBS, pH 7.4 at 37 °C ± 1.0 °C) was kept in the receptor compartment under constant stirring during experiment. An aliquot of 1 mL was withdrawn at predetermined time intervals and was replaced with drug free medium and analysed using UV spectrophotometer at 247 nm (SHIMADZU-UV 2401 PC, Japan). In vitro diffusion study was carried out for 8 h. shows the drug release profile of different batches. To study the drug release mechanism, data were treated with various kinetic models. A diffusion study for each formulation was carried out in triplicate [Citation18].
In vitro permeation studies
In vitro permeation study was carried out using porcine nasal mucosa obtained from local slaughterhouse. Nose was removed within 5 min after scarifying animal in slaughter house. The mucosa covering the ventral nasal conchae was selected, carefully removed within 1.5 h and treated with saline solution and then distilled water for permeation studies [Citation19]. The excised piece of nasal mucosa was mounted on Franz’s diffusion cell (Electrolab, India, Pvt Ltd. 2 station diffusion cell apparatus ED2–02) having capacity 7.5 mL, (permeation area 0.785 cm2). Permeation studies were carried out following the procedure mentioned in in-vitro diffusion studies. shows drug permemeation profiles of all formulations. Drug permeation study was performed in triplicate for each formulation.
Permeability coefficient (P) was determined using the following equation:
(4)
(4) where dQ/dt represents permeability rate and Co is the initial concentration in the donor compartment, while A is the effective surface area of the mucosa.
Histological studies
The nasal mucosa was examined for viability and integrity of cells in histological studies according to the procedure discussed by Khan et al. [Citation20]. Sections were observed under binocular microscope (Olympus CH-20i Binocular microscope, India, Pvt. Ltd.).
In vitro duration of mucoadhesion
Mucoadhesive property of the NPs was assessed by applying 500 mg of formulation on freshly cut porcine nasal mucosa which was attached over a polyethylene plate and kept at an angle of 40° relative to the horizontal plane. PBS at (pH 7.4 at 37 °C ± 1.0 °C) was pumped peristaltically (Electrolab, India, Pvt. Ltd) over the mucosal surface at a rate of 4 mL/min [Citation21].
Cell viability analysis
Cell viability analysis of EFV-NPs was carried out on L929 cell line by 3-[4,5-dimethylthizol-2-yl]-2,5-diphenyltetrazolium bromide (MTT) assay. Briefly, L929 cellline was maintained in 96 wells microtitre plate containing MEM media supplemented with 10% heat-inactivated foetal calf serum (FCS) containing 5% mixture of gentamicin (10 μg), penicillin (100 units/mL) and streptomycin (100 μg/mL) in presence of 5% CO2 at 37 °C for 48 to 72 h. The supernatant from the wells was replaced with fresh MEM solution (100 μL) and was treated with various concentrations of NPs solution in DMSO (10 μg/mL to 50 μg/mL). In control group plain DMSO was used. After 48 h of incubation (37 °C), 20 μL MTT (5 mg/mL in sterile PBS) was added to each well and incubated for 4 h. The supernatant was carefully removed and the precipitated crystals of “Formazan blue” were solubilised in 100 μL DMSO and optical density (OD) was measured at wavelength of 570 nm by using LISA plus. The result represents the mean of five readings [Citation22].
Cell viability was calculated using following formula:
(5)
(5)
In vivo studies
The protocol for animal studies was approved by the Committee for the Purpose of Control and Supervision of Experiments on Animals (CPCSEA) and the Institutional Animal Ethics Committee (IAEC) of Institute of Pharmaceutical Education and Research, Wardha (Protocol No: 21).
Male Albino Wistar rats (male, aged 3–4 months), weighing between 200 and 250 g were selected for pharmacokinetics assessment of EFV. The animals were housed separately at 22 ± 2 °C on 12-h light/dark cycle with free access to rodent diet and water. Animals were divided into two groups, each group containing 18 animals. First group received EFV solution (EFV-S) i.v. while second group received intranasal EFV-NPs. Three rats for each time interval were used in the study. Animals were kept on fasting for 12 h before administration of the dose. Intranasal dosing was done with the help of rat intranasal catheter device (rICD) (Impel Neuropharma) specially designed for olfactory targeting. EFV-NPs solution containing 25 mg/mL EFV (equivalent to 4 mg/kg body weight) was delivered slowly in each nostril (20 μL) through polyethylene tube (0.1 mm) attached to the rICD. Animals were placed in supine condition at 90° to achieve dose administration at the olfactory region [Citation23]. Forty microlitre of EFV-S (25 mg/mL containing 30% propylene glycol as a cosolvent) equivalent to 4 mg/kg body weight was injected through tail vein of albino rats using 1-mL Hamilton syringe. Animals were anaesthetized using ketamine (50 mg/kg) intraperitoneally and blood samples were collected from retro-orbital plexus at fixed time interval, while CSF samples of rats were withdrawn from cisterna magna by stereotaxic technique. Briefly, anaesthetized rat was mounted on stereotaxic device (indigenously designed by M. C. Dalal and Co, Chennai, India), animal’s head was lowered to a position at an angle of 45° relative to horizontal plane. Midline scalp incision about 2 cm was made to expose atlanto-occipital membrane and was drilled with 27 G dental needle. Approximately 100–120 μL blood free CSF was gently aspirated through polyethylene tubing (0.1 mm) connected to the syringe with precaution to avoid blood contamination. Muscles were re-aligned, sutured after CSF collection and gentamicin (50 mg/kg) IM was administered [Citation24].
Sample preparation
Blood samples (100–200 μL) were collected in heparinized tube (25 U/mL, 10 μL), centrifuged (11,000 rpm, 10 min, 4 °C) and plasma was separated. Deproteinization of plasma (250 μL) was carried out using acetonitrile (1000 μL) by shaking for 30 s followed by centrifugation for 10 min at 10,000 rpm. The clear supernatant was separated and evaporated to dryness at 40 °C and mixed with 300 μL of mobile phase, centrifuged for 5 min at 10,000 rpm. CSF samples were virtually proteins free hence analysed without pre-treatment.
Subsequently, biological samples were analysed for EFV content by high-performance liquid chromatography (HPLC) (Jasco LC – Ne II ADC UV – 2075). Chromatographic analysis was carried out at ambient temperature on Phenomenex Luna 5 μm, C18 column 250 mm × 4.6 mm at 246 nm, using mobile phase composed of acetonitrile – phosphate buffer 25 mM (55:45) at a pH 7.5 adjusted with 2 M potassium hydroxide at a flow rate of 1.2 mL/min [Citation25].
Pharmacokinetic analysis
Pharmacokinetic parameters were calculated using Thermo Kinetica Version 5.0 (Thermo Fisher Scientific Inc) by non-compartmental analysis. Brain-targeting potential of the intranasal NPs was evaluated by using following equations:
(6)
(6)
(7)
(7)
(8)
(8)
(9)
(9)
Bx brain AUC fraction contributed by systemic circulation through BBB after intranasal dosing, Bi.v., Pi.v., Bi.n., Pi.n. represents AUC0-t of EFV in brain and plasma after i.v. and i.n. administration [Citation18].
Statistical analysis
All the data are expressed as mean standard deviation. Statistical comparisons between the two groups (IV and IN administration) were compared with unpaired (two-tailed) t-test Welch corrected (Graph Pad Instat, Version 3.10, GraphPad Software Inc., La Jolla, CA). p < .05 denotes statistically significant difference between two groups.
Gamma scintigraphy imaging
The protocol for Gamma scintigraphy studies was approved by the Committee for the Purpose of Control and Supervision of Experiments on Animals (CPCSEA/A/500/2001) and the Institutional Animal Ethics Committee (IAEC) of Jawaharlal Nehru Cancer Research Centre, Bhopal and guidelines for gamma scintigraphy study were followed throughout experiments.
Nine healthy albino male Wistar rats (180–250 g, aged 2–3 months) were selected for study. The animals were kept at temperature of 22 ± 5 °C with free access to food and water on 12-h light/dark cycle. Animals were divided into three groups each containing three animals viz. group I for radiolabeled EFV-S for intravenous administration, group II for intranasal radiolabeled EFV-S and group III for intranasal radiolabelled EFV-NPs.
EFV-S (prepared in 0.9% saline containing 30% propylene glycol as a cosolvent) was mixed with stannous chloride as a reducing agent for 10–15 min and then was radiolabelled with 99mTc (1mci) by direct labelling method in the similar way EFV-NPs (equivalent to 25 mg/mL EFV) were radiolabelled [Citation26]. The mixture was incubated for 30 min. Forty microlitre of radiolabelled 99mTC-EFV-S (1 mg EFV) was intravenously administered by tail vein of rat using 1-mL Helminton syringe, while radiolabelled 99mTC-EFV-S (40 μL) and 99mTc-EFV-NPs (40 μL) were administered intranasally in two nostrils using rIUD. Animals were held at suspine-90° angle position for maximum drug deposition to the olfactory region. Rats were anesthetized using ketamine 50 mg/mL and placed on the imaging platform. Radioimages were taken at predetermined time interval using gamma camera (Brivo NM 615 - SPECT).
In between gamma scanning intervals, the animals were freed and allowed for normal activities.
Stability studies
Stability study was carried out on optimized EFV-NPs formulation as per ICH guidelines at a temperature of 45 ± 2 °C and 75 ± 1%RH. It was analysed for the change in particle size, zeta potential and per cent drug content.
Results and discussion
Formulation of nanoparticles
Response surface methodology employing two-factor, five-level circumscribed central composite design was applied to optimize the experimental conditions for the preparation of polymeric NPs of EFV-CS-g-HPβCD by mild ionic gelation technique. The effect of variables and responses are shown in . These responses were individually fitted to polynomial model. Each model was then validated by ANOVA [Citation27]. 3 D response surface plots were drawn for the optimization of NPs formulation.
Influence on particle size (Y)
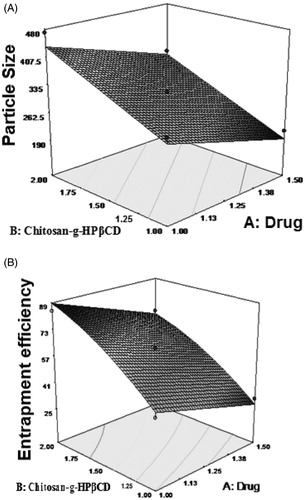
NPs size plays important role in transmucosal drug delivery. The particle size of NPs varied from 198 ± 4 nm to 471 ± 5 nm showing dependence on the selected variables. The polynomial equation was derived by best-fit method for the measured response.
(10)
(10) where A is the drug concentration and B is the polymer concentration.
The model F value of 66.59 model was significant and values of p < .05 indicates the model term were significant. The 3 D model graph () was constructed using model generated by surface response methodology. It was observed that increase in polymer concentration increased the particle size. This might be attributed to the increase in viscosity of solution. With increased concentration of CS-g-HPβCD, availability of protonated amine groups of CS with sodium TPP also increases resulting in increased particle size.
Figure 1. 3 D response surface plots showing effect of drug and polymer on (A) particle size and (B) entrapment efficiency.
Influence on entrapment efficiency
Per cent entrapment efficiency was drastically increased from 25 ± 1 to 84 ± 2% as polymer concentration changed from 0.79 mg/mL to 2.00 mg/mL. From surface response curve, it was observed that EE increased with increasing polymer concentration which might be attributed to the increase in hydrophobic cavities of CS-g-HPβCD to entrap more EFV.
Response surface quadratic model showed good fit with an F value of 66.66 (p < .05) implies model was significant. A value of 26.413 indicates formulation variables were significantly related. The statistical analysis of the results generated a quadratic response for entrapment efficiency as follows
(11)
(11)
3 D response graph () showed increase in EE with increase in polymer concentration.
Optimization by desirability function
Optimization process was carried out with the help of desirability function to optimize responses. EFV-NPs were prepared under optimized condition by applying constraints on the dependent factors to evaluate the predictive power of the model. Optimized formulation F-2 (198.7 ± 4.4 nm) was found in good agreement with the predicted values (196.712 nm) generated by model with low percentage bias (−0.01) which assures the reliability of the model. The minimum particles size was achieved by using model predicted optimal concentration of drug 1.25 mg/mL and polymer 0.79 mg/mL. The optimum batch has desirability of 0.689.
Influence of formulation composition on zeta potential and polydispersity index (PDI)
The zeta potential is a critical parameter having direct effect on the stability of nanodispersion. Being cationic polymer zeta potential was positive ranged between (+3.14 ± 3 to +17.2 ± 3 mV). It was observed that grafting of CS with HPβCD had reduced zeta potential may be due to masking of free positively charged amino groups of CS. Therefore, zeta potential was lower as compared to the reported CS NPs. Also, there might be adsorption of some drug on the surface of NPs, or carbonyl groups of EFV could have interacted with available amine groups of CS, thus reducing number of protonated amino groups on the NPs surface. PDI of formulated NPs was in a range of 0.325 ± 0.004 to 0.675 ± 0.005. Low PDI of NPs indicates that the particles in narrow size range could be achieved.
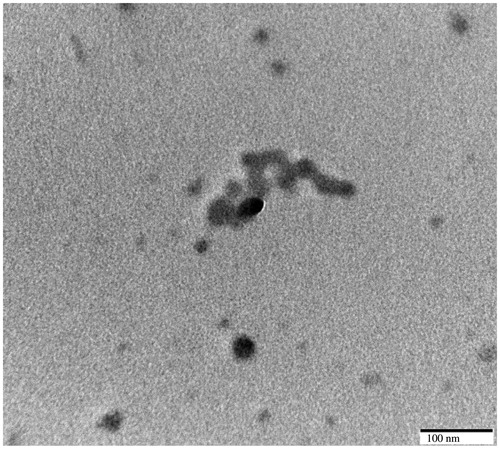
NPs were nearly spherical in shape with particle size of 100 nm as revealed in the TEM image (.
Figure 2. TEM image of EFV-NPs.
Characterization of EFV-NPs
Fourier transform infrared spectra
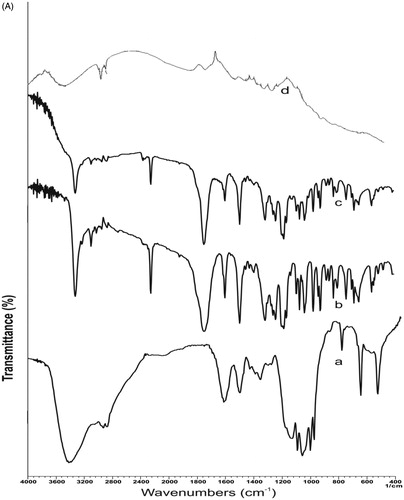
The FTIR spectrum of EFV exhibited sharp peak at 3317 cm−1 due to -NH stretching vibration which was supported by the evidence of N-H deformation at 1496−1. The spectrum showed absorption band at 1747 cm−1 due to C = O stretching vibration, whereas the absorption band at 2250 cm−1 corresponds to -C ≡ C-. The absorption band at 3093 and 1600 cm−1 corresponds to the C-H stretching and C = C stretching of the aromatic ring, respectively. Absorption bands 690 and 652 cm−1 corresponds to –CF stretch, while bands at 1097 and 1074 cm−1 corresponds to C-O-C stretch vibration. Absorption band at 1242 and 1166 cm−1 confirms CN and CO groups, respectively. All bands of EFV were found intact at their original frequency in the spectrum of physical mixture with copolymer suggesting no interaction of drug with copolymer. In the FTIR spectrum of EFV-NPs, the dipole moment of C = O structure and N-H deformation was changed as revealed in the spectrum and only 20% of IR radiations were absorbed by these groups. It is probably because of the involvement of these groups in H-bonding with the –OH groups of copolymer used in formulation ().
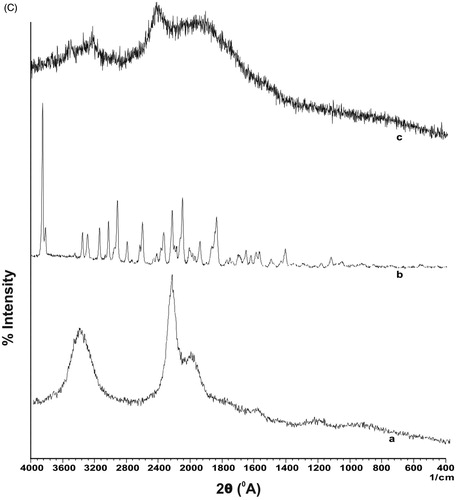
Figure 3. (A) FTIR spectra of (a) CS-g-HPβCD copolymer, (b) EFV, (c) physical mixture of EFV and CS-g-HPβCD (d) EFV-NPs. (B) DSC thermograms of (a) CS-g-HPβCD copolymer, (b) EFV, (c) physical mixture of CS-g-HPβCD and Efavirenz, and (d) EFV-NPs. (C) X-ray diffraction patterns of (a) CS-g- HPβCD, (b) EFV, (c) EFV-CS-g-HPβCD NPs.
Differential scanning calorimetry
shows DSC thermograms of CS-g-HPβCD copolymer, EFV, physical mixture of CS-g-HPβCD with EFV and EFV-NPs. CS-g-HPβCD thermogram showed endothermic peak at 231.46 °C. Sharp melting endothermic peak of EFV was observed at 139.16 °C and exothermic peak attributed to decomposition at 265 °C. The compatibility of EFV with CS-g-HPβCD copolymer was confirmed in physical mixture, as there was no change in thermal behaviour of EFV. The absence of characteristics endothermic peak of EFV in the DSC thermogram of EFV-NPs might be because of formation of inclusion complex between hydrophobic cavities of CS-g- HPβCD and the drug in the NPs.
X-ray diffraction
shows XRD spectra of CS-g-HPβCD, EFV and EFV-NPs. CS has characteristics sharp peaks of at 2θ = 11° and 2θ = 20° assigned to its crystallinity [Citation28]. Broad peaks in XRD of CS-g-HPβCD at 2θ = 10° and 2θ = 22° indicates loss of crystalline nature of CS due to grafting of tosylated HPβCD on CS backbone and the copolymer is more amorphous than CS. X-ray diffractogram of EFV displays multiple sharp peaks from 2θ = 5°, 2θ = 33° indicating crystalline nature of the drug. In the XRD of EFV-NPs, broader peaks were observed at 2θ = 12°, 2θ = 19° and 2θ = 25°, while the characteristic sharp peaks of EFV disappeared, which might be due to conversion crystalline EFV to amorphous form during formulation of NPs.
In vitro drug diffusion study
Grafting of HPβCD on the CS for solubility enhancement of hydrophobic drug EFV was a crucial parameter in the drug release profile of NPs. The release profile followed a biphasic pattern characterized by initial burst release followed by a slow prolonged release (). The initial burst release may be attributed to the release of adsorbed drug molecules on the surface of NPs in the diffusion media. Drug release was found to be sustained with increase in concentration of copolymer as drug diffuses slowly by erosion of polymer matrix which might have offered sustained release effect [Citation28]. Drug release profiles were analysed using zero order, first order, Higuchi and Korsemeyer–Peppas model. The release exponent value (n) from the Korsemeyer–Peppas equation was found to be less than 0.5 which displayed drug release by Fickian diffusion mechanism. Maximum correlation of coefficient value was for Higuchi plot (R2=0.9909).
Figure 4. (A) In vitro release profiles of EFV from different formulations of EFV-NPs, n = 3. (B) Permeation profile of efavirenz solution (F0) and different formulations of EFV-NPs, n = 3.
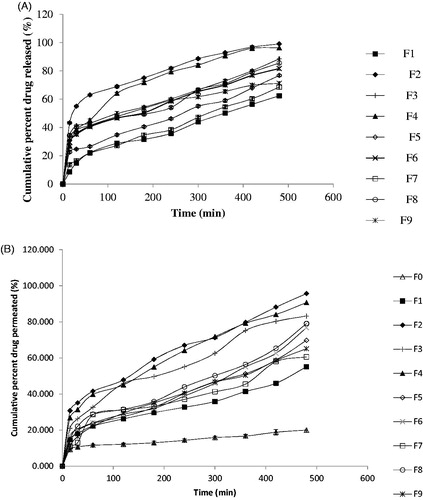
In vitro permeation studies
shows permeation profile of drug from various batches of NPs (F1 to F9) and plain drug F0. EFV permeated very slowly (20.05%±0.64 in 8 h), whereas permeation was found to be increased from EFV-NPs (65.17 ± 0.78 to 95.68 ± 0.93% in 8 h). This increase in permeability could be attributed firstly to the combined effect of increased in drug solubility because of HPβCD grafting on CS backbone and nanosized delivery system. Secondly, CS is efficient absorption enhancer, positively charged amino group present on CS at C-2 position interacts with negatively charged sites on mucosal epithelial cell linings and sialic acid present in the mucin which transiently open tight junctions of mucosal membrane by translocating proteins ZO-1 and occludin which controls membrane tightness and diffusion through intercellular spaces, activation of Protein Kinase C is responsible for this disruption of the tight junctions [Citation29].
Drug permeation was correlated with the drug release from the NPs. NPs with increasing polymer: drug ratio (0.63:1 to 2:1) resulted in slower drug release because of restricted diffusion and increase in particle size.
Histological studies
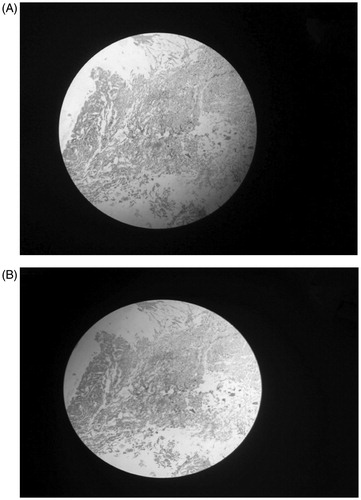
The NPs treated and untreated excised nasal mucosa was evaluated for cytotoxicity to fibroblast cells in histological studies. The NPs were found non-toxic as no sign of injury or necrosis was observed with the fibroblast cells (.
Figure 5. Microscopic images of normal nasal mucosa (A) and nasal mucosa after applying nanoformulation for 8 h (B).
In vitro duration of mucoadhesion
NPs showed fair mucoadhesion (2.45 ± 0.12 to 4.55 ± 0.32 h) which indicates that sufficient mucoadhesive property of CS was retained even after grafting with HPβCD. CS on hydration swells and leads to aggregation of mucin due to electrostatic interaction between positively charged amino groups of derivative with negatively charged sialic acid and sulphated sugar in mucin that offers mucoadhesion [Citation30,Citation31].
Cell viability analysis
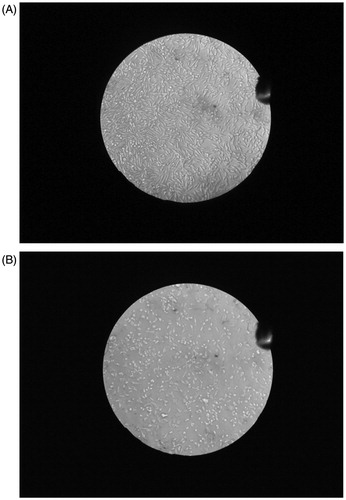
The formulation appeared to be nontoxic to the cell line (L-929) against which the cytotoxic activity has been tested as the IC50 value for the EFV NPs was beyond the concentrations tested (.
Figure 6. Photographs of cell viability assay of control L929 cell line (A) and nanoformulation tested on L929 cell line (B) n = 5 ± SD.
Pharmacokinetic analysis
EFV level was assessed in plasma and CSF after intranasal administration of EFV-NPs and i.v. administration of EFV-S. The mean plasma and CSF concentration–time profile after i.v. administration of EFV-S and EFV-NPs are represented in . EFV pharmacokinetic was parameterized by noncompartmental analysis ().
Figure 7. (A) Blood concentration time profile of efavirenz after intravenous administration of efavirenz solution and intranasal administration of nanoparticles. Data represent the mean ± SD, n = 3. p < 0.05, (unpaired t-test Welch corrected). (B) CSF concentration time profile of efavirenz after intravenous administration of efavirenz solution and intranasal administration of nanoparticles. Data represent the mean ± SD, n = 3. p < 0.05, (unpaired t-test Welch corrected).
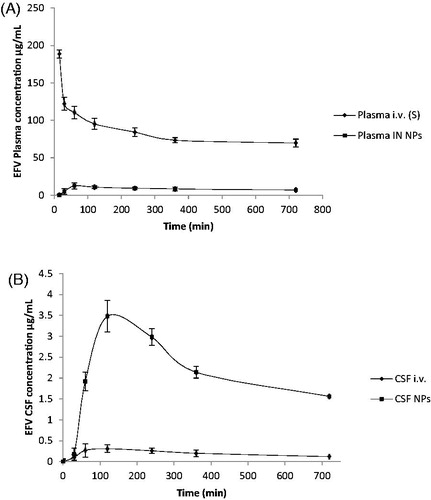
Table 2. Pharmacokinetic parameters following intravenous administration of efavirenz solution and intranasal administration of efavirenz nanoparticles.
The maximum EFV concentration appeared in plasma (Cmax 130.90 ± 5.52 μg/mL for i.v. administration at 15 ± 0.00 min and 12.60 ± 3.05 μg/mL for intranasal EFV-NPs administration at 60 ± 0.00 min) and in CSF (0.31 ± 0.16 μg/mL for i.v. administration and 3.4800 ± 0.77 μg/mL for intranasal EFV-NPs administration at 120 ± 0.00 min for each).
The rapid appearance of Cmax in CSF might be because of extracellular transport of EFV which involves transport via perineural space present surrounding olfactory axon loosely adherent to perineural epithelium or through epithelial cell junction. Transport may occur via tight junctions or clefts in the epithelium into the CSF as they are directly connected anatomically in submucosa and subarachnoid extensions, perineural space surrounding olfactory nerves as they penetrate the cribriform plate [Citation31].
The AUC0–720 of EFV in CSF post intranasal administration of EFV-NPs was 12.40-fold greater than AUC0–720 after i.v. administration of EFV-S (2720.80 ± 417.40 μg/mL*min vs. 219.31 ± 47.79 μg/mL*min.). Plasma AUC0–720 (19,243.12 ± 1935.08 μg/mL*min) of EFV after intranasal administration of EFV-NPs demonstrates partial transport of drug to the systemic circulation because of absorption from respiratory mucosa. AUC0–720 (219 min.31 ± 47.79 μg/mL*) in CSF after i.v. administration was lower compared to plasma AUC0–720 (204558.03 ± 51311.57) which may be because of its high plasma protein binding (>99.5–99.75%) and efflux by membrane transporters (breast cancer-resistant protein BCRP and ABCG2 present in brain endothelium [Citation32]. Direct transport of EFV from intranasal NPs is corroborated by the high value of DTP (99.24%) and DTI (141.3). CNS uptake of EFV was significantly (p < 0.05) high for intranasal NPs compared to i.v. solution. There are several reports so far in the literature that EFV was undetectable in the CNS after oral administration. Therefore, these results warrant promise in treating neuro-AIDS using CS-g-HPβCD as the carrier for nose to brain targeting of EFV. This CSF concentration after intranasal administration of NPs is sufficiently higher than IC90–95 of EFV (1.7 ≤ 25 nM wild-type HIV).
The drug transport from nasal cavity to the CNS involves combination of pathways such as olfactory, trigeminal and systemic. CS present in the NPs might have contributed in opening tight junctions between sustentacular cells (or clefts) and olfactory neurons, EFV may have been diffused passively and via olfactory neuronal cell by endocytosis or pinocytosis and transported by axons to the olfactory bulb. When a drug is absorbed from the respiratory epithelia, it reaches the systemic circulation before crossing the BBB. However, EFV is highly bound to plasma proteins, thus transport through systemic route would be negligible [Citation33,Citation34]
The t1/2 for i.v. administration in plasma was found to be 23.83 ± 2 h and in CNS it was 7.268 ± 0.30 h, while in intranasal administration of NPs plasma t1/2 was 21.86 ± 3 h and 8.56 h in CNS. EFV on oral administration has very long half-life of 52–76 h after single dosing which reduces to 40–52 h on repeated dosing.
The enhanced CNS access of the drug was observed which may be attributed to various factors among them is significant increment in the solubility of this hydrophobic drug with CS-g-HPβCD copolymer, a newly designed copolymer in our laboratories by one pot synthesis which was used as a nanocarrier. Grafted HPβCD synergistically may have contributed in altering membrane permeability by modifying the phospholipid bilayer and in leaching of proteins from the membrane; this increased in membrane permeability may have enhanced CNS drug delivery. Use of rIUD in delivering NPs may have localized more amounts of NPs over olfactory mucosa compared to respiratory.
Gamma scintigraphy imaging
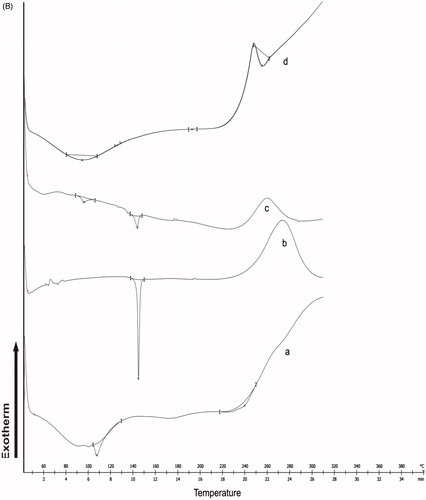
Maximum radioactivity was observed in bladder, liver and GIT and no radioactivity was observed in CNS after i.v. administration, while high radioactivity uptake was clearly observed in the brain after intranasal administration of EFV-NPs and some radioactivity was observed in the abdomen region which may be due to systemic circulation of intranasally absorbed drug (. As discussed, maximum CNS uptake was contributed by olfactory, trigeminal pathway along with partially by systemic transportation. Greater radioactivity in the brain after intranasal NPs administration further proves direct transport of drug to the brain by passing BBB through olfactory and/or trigeminal pathway. These observations ensure IN transport of drug to the CSF and various areas of brain in the enhancement of CNS bioavailability of EFV.
Figure 8. Gamma scintigraphy images of rats showing the presence of radioactivity post-administration of intravenous efavirenz solution [EFV i.v (S)], intranasal efavirenz solution [IN EFV (S)] and intranasal efavirenz nanoparticles (IN EFV-NPs). (A) EFV-i.v.(S), (B) EFV IN (S) and (C) IN EFV-NPs.
![Figure 8. Gamma scintigraphy images of rats showing the presence of radioactivity post-administration of intravenous efavirenz solution [EFV i.v (S)], intranasal efavirenz solution [IN EFV (S)] and intranasal efavirenz nanoparticles (IN EFV-NPs). (A) EFV-i.v.(S), (B) EFV IN (S) and (C) IN EFV-NPs.](/cms/asset/bd2ef7a1-9cb1-4cf0-8509-342a53ec1660/ianb_a_1313266_f0008_b.jpg)
Stability studies
The NPs were found to be stable with insignificant change in particle size and zeta potential. Drug content was found to be unchanged.
Conclusions
Low-sized, stable nanoparticles with high drug loading could be successfully prepared using CS-g-HPβCD. Sustained release from the nanoparticles and enhanced permeation through the nasal mucosa of EFV could be achieved without adverse effect on it. Significantly greater access of EFV to the CNS and high drug targeting index to the brain from intranasal EFV loaded CS-g-HPβCD nanoparticles makes it a promising gateway for targeting the CNS in Neuro-AIDS.
Acknowledgements
The authors are thankful to Jawaharlal Nehru Cancer and Research Centre for providing facilities for Gamma scintigraphy imaging.
Disclosure statement
The authors report no conflicts of interest. The authors alone are responsible for the content and writing of this article.
Additional information
Funding
References
- Fact sheet. 2016 UNAIDS. Available from: http://www.unaids.org/en/resources/fact-sheet.
- Nair M, Jayant RD, Kaushik A, et al. Getting into the brain: potential of nanotechnology in the management of neuroAIDS. Adv Drug Deliv Rev. 2016;103:202–217. DOI: 10.1016/j.addr.2016.02.008.
- Das K, Sarma A, Chakraborty T. Nano-ART and neuroAIDS. Drug Deliv and Transl Res. 2016;6:452–72. DOI 10.1007/s13346-016-0293.
- Illum L. Transport of drugs from the nasal cavity to the central nervous system. Eur J Pharm Sci. 2000;11:1–18.
- Hanson LR, Frey WH. Strategies for intranasal delivery of therapeutics for the prevention and treatment of neuroAIDS. J Neuroimmune Pharmacol. 2007;2:81–86.
- Al-Ghananeem AM, Saeed H, Florence R, et al. Intranasal drug delivery of didanosine-loaded chitosan nanoparticles for brain targeting; an attractive route against infections caused by AIDS viruses. J Drug Target. 2010;18:381–388. DOI: 10.3109/10611860903483396.
- Barbi M, Carvalho CF, Kiill CP, et al. Preparation and characterization of chitosan nanoparticles for zidovudine nasal delivery. J Nanosci Nanotechnol. 2015;15:865–874.
- Dalpiaz A, Fogagnolo M, Ferraro L, et al. A, Nasal chitosan microparticles target a zidovudine prodrug to brain HIV sanctuaries. Antiviral Res. 2015;123:146–57. doi: http://dx.doi.org/10.1016/j.antiviral.2015.09.013.
- Mahajan HS, Mahajan MS, Nerkar PP, et al. Nanoemulsion-based intranasal drug delivery system of saquinavir mesylate for brain targeting. Drug Deliv. 2014;21:148–154.
- Chiappetta DA, Hocht C, Opezzo JA, et al. Intranasal administration of antiretroviral-loaded micelles for anatomical targeting to the brain in HIV. Nanomedicine (Lond). 2013; 8:223–237.
- Mistry A, Stolnik S, Illum L. Nanoparticles for direct nose-to-brain delivery of drugs. Int J Pharm. 2009;379:146–157.
- Marzolini C, Telent A, Decostered L, et al. Efavirenz plasma levels can predict treatment failure and central nervous system side effects in HIV-1-infected patients. AIDS. 2001;15:1193–1194.
- Prabaharan M, Mano JF. Chitosan derivatives bearing cyclodextrin cavities as novel adsorbent matrices. Carbohydr Polym. 2006;63:153–166.
- Loftsson T, Jarho P, Másson M, et al. Cyclodextrins in drug delivery. Expert Opin Drug Deliv. 2005;2:335–351.
- Prabaharan M, Mano JF. Hydroxypropyl chitosan bearing β-cyclodextrin cavities: Synthesis and slow release of its inclusion complex with a model hydrophobic drug. Macromol Biosci. 2005;5:965.
- Belgamwar AV, Khan SA, Yeole PG. The Patent Office Journal, 3445/MUM/2015A. 2015.
- Aktas Y, Andrieux K, Alonso MJ, et al. Preparation and in vitro evaluation of chitosan nanoparticles containing a caspase inhibitor. Int J Pharm. 2005;298:378–383.
- Khan S, Patil K, Bobade N, et al. Formulation of intranasal mucoadhesive temperature-mediated in situ gel containing ropinirole and evaluation of brain targeting efficiency in rats. J Drug Target. 2010;18:223–234.
- Wadell C, Björk E, Camber O. Nasal drug delivery-evaluation of an in vitro model using porcine nasal mucosa. Eur J Pharm Sci. 1999;7:197–206.
- Khan S, Gajbhiye C, Singhavi D, et al. In situ gel of metoprolol tartrate: physicochemical characterization, in-vitro diffusion and histological studies. Indian J Pharm Sci. 2012;74:564–570.
- Khan SA, Patil KS, Yeole PG. Intranasal mucoadhesive buspirone formulation: in vitro characterization and nasal clearance studies. Pharmazie. 2008;63:348–351.
- Dolly A, Griffiths JB. ‘Cell and tissue culture for medical research. John Wiley and Son.
- Mascha van den Berg P, Romeijin SG, Coos Verhoef J, et al. Serial cerebrospinal fluid sampling in a rat model to study drug uptake from the nasal cavity. J Neurosci Methods. 2002;116:99–107.
- Zarghami A, Pandamooz SA, Naji M, Pourghasem M. Modified method for cerebrospinal fluid collection in anesthetized rat and evaluation of the efficacy. 2013;2:97–98.
- Veldkampa AI, Rolf PG, Meenhorstb PL, et al. Quantitative determination of efavirenz (DMP 266), a novel non-nucleoside reverse transcriptase inhibitor, in human plasma using isocratic reversed-phase high-performance liquid chromatography with ultraviolet detection. J. Chromatogr B. 1999;734:55–61.
- Yadav A, Jain DK. Formulation development and characterization of propranolol hydrochloride microballoons for gastroretentive floating drug delivery. Afr J Pharm Pharmacol. 2011;5:1801–1810.
- Chawla R, Jaiswal S, Mishra Z. Development and optimization of polymeric nanoparticles of antitubercular drugs using central composite factorial design. Expert Opin Drug Deliv. 2013;10:11.
- Yuan Z, Ye Y, Gao F, et al. Chitosan-graft-β-cyclodextrin nanoparticles as a carrier for controlled drug release. Int J Pharm. 2013;446:191–198.
- Sajomsang W, Nuchuchua O, Gonil P, et al. Water-soluble β-cyclodextrin grafted with chitosan and its inclusion complex as a mucoadhesive eugenol carrier. Carbohydr Polym. 2012;89:623–31. DOI:10.1016/j.carbpol.03.060.
- Smart JD. The basics and underlying mechanisms of mucoadhesion. Adv Drug Deliv Rev. 2005;57:1556–1568.
- Talegaonkar S, Mishra PR. Intranasal delivery: an approach to bypass the blood brain barrier. I J Pharm. 2004;36:140–147.
- Weiss J, Rose J, Storch CH, et al. Modulation of human BCRP (ABCG2) activity by anti-HIV drugs. J Antimicrob Chemother. 2007;59:238–245.
- Yilmaz A, Victoria W, Laura D, et al. Efavirenz pharmacokinetics in cerebrospinal fluid and plasma over a 24-hour dosing interval. Antimicrob Agents Chemother. 2012;56:4583–4585.
- Best BM, Koopmans PP, Letendre SL, et al. Efavirenz concentrations in CSF exceed IC50 for wild-type HIV. J Antimicrob Chemother. 2010;66:354–357.