
Abstract
The lateral-flow immunoassays based on novel fluorescent labels have been receiving increasing attention. Here, we developed a rapid, quantitative, lateral-flow immunoassay for rapid and accurate detection of rhein (RHE). The competitive immunoassay used anti-RHE IgY (immunoglobulin of yolk) probe conjugated with QDs as reporter. Our results showed that the immunochromatographic strip can be applied for qualitative and quantitative analysis of RHE in samples. For quantitative analysis, the strips were scanned by a membrane-strip reader, and a detection curve (y = −0.128ln(x) + 1.7627, correlation coefficient = 0.9792) representing the averages of the scanned data was obtained. The detection range was 80–5000 ng mL−1 and the qualitative-detection limit for RHE was 98.2 ng mL−1. To our knowledge, this is the first report of the quantitative detection of a natural product by QDs-IgY immunochromatography, which creates a new strategy to detect the harmful or index component of TCM and may be applied as a supplement or alternative to instrument detection.
Introduction
Rhein (RHE), also known as 1,8-dihydroxy-3-carboxy-anthraquinone, is believed to be the major constituent responsible for the pharmacological effects of Rheum officinale, which is one of the most popular medicinal materials in traditional Chinese medicine (TCM). Recent studies suggested that RHE exhibits antibacterial [Citation1], antitumor [Citation2] and anti-inflammatory properties [Citation3], as well as a diuretic effect, with its intestine-converted product, RHE anthrone, exhibiting significant purgative activity. Previous research also indicated its potential nephrotoxicity or effects related to liver damage [Citation4,Citation5], suggesting that RHE use should be strictly controlled in clinical applications.
The main analytical methods used for RHE detection, including high-pressure liquid chromatography, gas chromatography mass spectrometry and liquid chromatography mass spectrometry [Citation6–8], have also been used to quantify RHE levels in clinical and biological samples. Although these conventional strategies return promising results allowing for the sensitive detection of RHE, their use involves complicated pre-treatment steps, dependence upon expensive instruments, long operation times and tedious sample preparation. Therefore, development of a rapid, simple and low cost on-site assay for RHE detection is necessary.
The lateral-flow immunochromatographic strip (LCS) is a powerful tool enabling rapid and low-cost on-site detection and is well known for its use as a home pregnancy test strip due to its utilization without requiring special training or instrument systems [Citation9,Citation10]. Compared with other immunoassays, such as the enzyme-linked immunosorbent assay (ELISA), LCS eliminates requirements for long incubation times and complex operational steps. Therefore, LCS tests are widely used in areas ranging from clinical diagnosis such as C-reaction protein [Citation10], tumour marker [Citation11,Citation12] to pesticide residues detection [Citation13] and drug testing [Citation14,Citation15].
Quantum dots (QDs) represent a new type of fluorescent nanocrystal and are considered as ideal labels for LCS use due to their unique properties, such as broad adsorption, narrow and symmetric photoluminescence spectra (easily excitable), strong luminescence (highly sensitive) and robust photostability [Citation16–18]. These excellent properties render QDs as robust reporters for developing highly sensitive LCS assays capable of simultaneous quantification of multiple analytes.
Recently, we reported an LCS assay based on an IgG [Citation19]. In this study, we developed this LCS assay using a chicken egg yolk antibody (IgY) against RHE. As the concentrations of IgG obtained from hybridoma culture medium were only 0.05 mg mL−1 and ∼5 mg mL−1 from mouse ascites. The hybridoma culture is expensive and mouse ascites is very harmful to the animal welfare. While IgY is found at high concentrations in chicken egg yolk (with the yolk of an immunized hen egg containing 100 mg IgY per egg) [Citation20], which means it is possible to source antibodies from eggs provided daily by chickens. Hence, we developed the first LCS assay based QD-IgY.
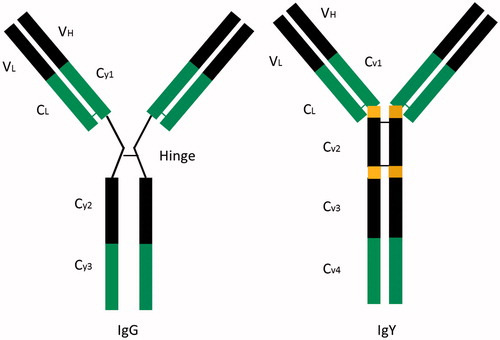
As shown in , the heavy chain of IgY has four regions and no hinge area, which decreases the steric flexibility of the IgY molecule relative to that of the IgG antibody, with IgY also showing higher thermal stability and resistance against repeated freezing and thawing [Citation21]. Moreover, IgY shows negligible reactivity with mammalian cross-reactants based on the phylogenetic difference between mammals and Aves [Citation22,Citation23], which makes it an increasingly popular source of antibodies for research as compared with mammals, such as rabbits or goats [Citation24].
Figure 1. Schematic diagram of IgG and IgY.
As TCM is widely used in China, the counterfeit drugs and drug abuse of TCM have been a big potential threat to life such as aristolochic acid nephropathy. In this work, we develop the test strip to rapidly detect the harmful or index component of TCM. We hope this manuscript can create a normal form and exemplification for rapid detection of the active or potentially harmful ingredient of TCM. This rapid and on-site assay may be applied as a supplement or alternative to instrument detection which can be used by ordinary people to decrease adverse drug reaction caused by counterfeit drugs or drug abuse of TCM.
Materials and methods
Materials
Bovine serum albumin (BSA), ovalbumin (OVA) and Freund’s complete and incomplete adjuvants were obtained from Sigma-Aldrich (St. Louis, MO). NAR and other Chinese herbal medicines were purchased from the National Institutes for Food and Drug Control (NIFDC, Beijing, China), and all were at 98% purity. Peroxidase-labelled goat anti-chicken IgY-horseradish peroxidase secondary antibody was provided by Applygen Technologies (Beijing, China), and 1-ethyl-3-(3-dimethyllaminopropyl)-carbodiimide hydrochloride (EDC) was obtained from Biochem Ltd. (Shanghai, China). All other chemicals were standard commercial products of analytical grade. RHE (purity ≥98%) was purchased from Shanghai Standard Biotech Co., Ltd. (Shanghai, China), and Rheum officinale was obtained from Beijing Tong RenTang Group Co., Ltd. (Beijing, China).
Activated QD2605 QD nanocrystals (CdTe/ZnS) with free carboxylic acid groups were obtained from JiaYuan QDs (Wuhan, China). Blotting paper (H2072) and semi-rigid polyvinyl chloride (PVC) sheets (DB-6, black) were purchased from Jieyi Biological Technology Co., Ltd. (Shanghai, China). Glass fibre membranes (XQ-Y7/Fusion 3) and nitrocellulose membranes (Millipore 135) were produced by Millipore (Billerica, MA).
Instruments
A JY-EQ02 batch laminating system, JY-DQ02 guillotine cutting system and JY1501FS portable fluorescence strip reader were provided by Jieyi Biological Technology Co., Ltd. (Shanghai, China). An Elx-800 microplate reader was used for all absorbance measurements (BioTek, Winooski, VT), and an electronic balance (BS124-S) was procured from Sartorius (Gottingen, Germany). Immunoreactions were carried out in an electrically heated cultivator (DRP-9082) provided by Samsun Laboratory Instrument Co. Ltd. (Shanghai, China).
Preparation of RHE-BSA/RHE-OVA
The RHE-BSA conjugate was used as the immunogen, and the RHE-OVA conjugate was used as the coating antigen for ELISAs and as the capture reagent on the strip test line. The RHE-BSA/RHE-OVA conjugate was synthesized using a periodate-oxidation procedure according to a previously reported protocol. Briefly, RHE was dissolved in 0.1 M carbonate buffer solution (pH 9.0; CBS) at 1 mg mL−1, followed by dropwise addition of 1 mL of a freshly prepared sodium periodate solution (4 mg) into 5 mL of the RHE solution. The mixture was stirred at 25 °C for 1 h, followed by addition of 5 mg BSA dissolved in 1 mL CBS was added and adjustment of the final pH to 9.0 using a 0.05 M carbonate buffer (pH 9.6). After stirring at 25 °C for 6 h, the mixture was dialysed six times against phosphate-buffered saline (PBS). RHE-OVA was synthesized using the same method.
Hen immunization
Briefly, young, (10–12-weeks old) female roman chickens were immunized intramuscularly in the breast muscle with 200 μg of RHE–BSA conjugate emulsified with Freund’s complete adjuvant. On days 15, 30 and 45 after the first immunization, three booster injections were administered with Freund’s incomplete adjuvant. Blood and eggs were collected one day before the first inoculation and seven days after each booster injection.
Preparation and purification of the anti-RHE IgY
Production and purification of IgY against RHE were performed as described previously, with some modifications. An ammonium sulphate precipitation protocol [Citation22,Citation25] was used to extract IgY antibodies, with some modifications [Citation21]. The yolks were separated from the eggs and diluted 1:5 in distilled water (pH 2.5). After incubation at 4 °C for 18 h, the solution was filtered through Whatman filter paper at 4 °C, and ammonium sulphate was added to a final concentration of 35% (v/v). The solution was homogenized, incubated for 1 h at room temperature, and centrifuged for 20 min at 1400×g. The precipitate was diluted in 2 mL of distilled water and dialysed against distilled water for 24 h, followed by dialysis against PBS (pH 7.4) for an additional 24 h at 4 °C. The obtained IgY was freeze-dried and stored at –20 °C.
Indirect ELISA using anti-RHE IgY
Specificity analyses of the generated IgY were performed according to previously described methods [Citation26]. The reactivity of the IgY against RHE-OVA was determined using an indirect ELISA. RHE-OVA (1 μg mL−1, 100 μL per well) was adsorbed into the wells of a 96-well immunoplate, followed by treatment of the plates with 300 mL PBS containing 1% gelatin for 1 h to eliminate non-specific adsorption. Plates were washed three times with PBS containing 0.05% (v/v) Tween-20 (PBST), and 50 μL of various concentrations of RHE dissolved in CBS were separately incubated with 50 μL of IgY (2 μg mL−1) for 1 h. The plate was then washed three times with PBST, followed by incubation with 100 μL of peroxidase-labelled goat-anti-chicken IgY for 1 h. After washing, 100 μL of substrate solution (0.1 M citrate buffer containing 0.015% H2O2 and 2 mg mL−1 TMB) was added to each well and incubated for 15 min. Absorbance was measured by microplate reader at 450 nm. All reactions were performed at 37 °C.
Preparation of the QD-anti-RHE IgY conjugate
The QD-anti-RHE IgY conjugate was prepared according to a previously described protocol [Citation27]. CdTe/ZnS core shell quantum dots (QD2605, peak emission wavelength: 605 nm, Fig S1) was applied for fluorescent label probe. Briefly, 200 µL of QD2605 nanocrystals (8 μM) was first diluted in reaction buffer [0.2 mM sodium borate (pH 7.4)] to a final concentration of 1 μM, then 500 µL of anti-Rhe IgY was dissolved in reaction buffer at a concentration of 4 mg mL−1. Solutions containing 2 mg mL−1 EDC and 1 mg mL−1 N-hydroxysulfosuccinimide (NHS) in 10 mM sodium borate (pH 9.0) were prepared immediately prior to use, followed by 400 µL of the EDC solution being added to 500 µL of carboxyl-activated QDs (QD-COOH) and gently stirred at room temperature (25 °C) for 30 min. The NHS solution (400 µL) was then added to the same mixture and reacted for an additional 30 min, followed by reaction with 500 µL anti-RHE IgY for 2 h. The resulting mixture was purified and concentrated to 20 μL using an ultrafiltration device (NAP5; GE Healthcare, Little Chalfont, UK) and centrifuged at 6000 rpm for 10 min. The conjugated biocomplexes were collected and diluted to 1 μM.
LCS preparation
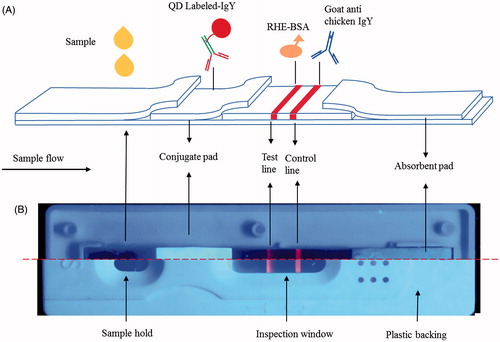
The LCS consisted of a sample pad, a conjugate pad, a nitrocellulose membrane, an absorbent pad and a plastic backing sheet. A schematic diagram of the LCS is shown in and the assembly of the QD-based dipstick is shown in . Sample pads made of glass fibre (XQ-Y7) and conjugated pads made of glass fibre (Ahlstrom 8964) were treated with Tris–HCl (pH 8.8) containing 1% (w/v) BSA, 0.5% (v/v) Tween 20, 0.1% (w/v) casein and 1% (w/v) polyethylene glycol 20,000 for 1 min. The pads were dried in an oven at 37 °C for 1 h and kept in a hermetically sealed bag at room temperature before use. For each test, 50 μL sample solution was dripped onto the sample hold, the QDs-IgY conjugate solubilized by the sample solution reacted with RHE. The QDs were capable of emitting strong fluorescence in the inspect window under 365 nm.
Figure 2. (A) Schematic diagram of the QD-based immunochromatographic assay for RHE. For each test, 20 μL sample solution was dripped onto the sample hold, the QDs-IgY conjugate solubilized by the sample solution reacted with RHE. The QDs were capable of emitting strong fluorescence in the inspect window under 365 nm. (B) The assembly of QD-based dipstick and plastic housing under ultraviolet light.
QD-labelled anti-RHE IgY was dispensed onto the conjugate pad using the JY-EQ02 batch-laminating system. Anti-RHE IgY-QD-conjugate pads were lyophilized and stored in a hermetically sealed bag until use. The goat anti chicken IgY (2 μg) was spotted onto the top side of the nitrocellulose membrane to form the control line, and the RHE-OVA conjugate (5 μg) was spotted onto the bottom membrane to form the test line. The test and control lines were spaced ∼0.5-cm apart. After drying for 30 min at room temperature, the loaded membrane was blocked for non-specific protein binding by immersion in a phosphate buffer containing 1% (w/v) BSA and incubated for 2 h at room temperature. The membrane was washed twice with PBST for 10 min, and after drying, the membrane was assembled with the nitrocellulose membrane, an absorbent pad, the detection reagent in the conjugate pad, and a sample pad. The sample pad was placed onto a PVC plate and overlapped by 2 mm with the anti-RHE IgY conjugate pad. The conjugate pad was placed onto the sheet and overlapped by 2 mm with the bottom of the nitrocellulose membrane, and the absorbent pad (filter paper) was placed on the sheet and overlapped by 2 mm with the top of the nitrocellulose membrane. The assembled plate was then cut into 3.5-mm wide strips using a paper cutter (Deli Co. Ltd., Ningbo, China), and all strips were sealed with desiccant and stored at room temperature.
Detection principle and test procedure
The principle of the one-step LCS is based on a competitive reaction of the target analyte in the sample and the coating antigen (test line) with the limited quantity of QD-labelled antibody. The steps in the LCS-assay process were as follows.
For each test, 50 μL sample solution was dripped onto the sample hold (), the solution flowed in the sample pad and the specific QD-labelled antibody coated on the conjugate pad were dissolved and migrated along the nitrocellulose membrane by capillary action. The mAb complex solubilized by the sample solution reacted with RHE (if it was present in the sample liquid) while the mixture was passing through the membrane. If there was no RHE in the sample solution, the QD-labelled IgG would be captured by the antigen (RHE) coated on the membrane. The test result could be evaluated after 5 min to 10 min, and using a 365-nm mini flashlight, the QDs were capable of emitting strong fluorescence under irradiation. Under 365-nm ultraviolet light, the positive samples exhibited only one red line (control line), whereas a negative test resulted in two red lines (test and control lines). If no control line was present, the test was considered invalid.
For qualitative detection, RHE concentration was estimated by comparing the strips against a standard colour card. For quantitative detection, 50 μL of samples (standards or test samples) were applied to the sample pad for the reaction. After 5 min, the test strip was inserted into the portable fluorescence-strip reader, the fluorescence intensity was estimated from QDs on the test line and control line. The fluorescence-strip reader converts fluorescence signal into an electric signal to quantify the results. The calibration curve of standards was stored in the fluorescence-strip reader.
Specificity and sensitivity of the LCS test
To evaluate the specificity of the LCS test, we tested RHE analogues and different compounds of commonly used Chinese medicinal herbs, such as glycyrrhizic acid, icariin and rutin. RHE was used as a positive control, and pure water was used as a negative control. For sensitivity evaluation, RHE-standard solutions at concentrations of 0 μg mL−1, 0.08 μg mL−1, 0.4 μg mL−1, 2 μg mL−1, 10 μg mL−1 and 50 μg mL−1 were prepared by diluting RHE with PBS. Each dilution was applied to the LCS test, and the detection limit was determined. The visual limit of detection (LOD) was defined as the minimum RHE concentration that resulted in the complete disappearance of the test line.
Analysis of consistency between LCS and HPLC
Extraction of plant samples
Rheum officinale crude drug obtained from 4 producing areas (S1–S4: from Shanxi, Guizhou, Hubei, Qinhai province) was weighed (1 g) into a centrifuge tube. Twenty five millilitres of 80% (v/v) methanol was added. The samples were ultrasonic extracted for 10 min and then centrifuged at 3000 rpm for 5 min. The supernatants were collected as the raw samples and then diluted 1:500 with DW.
Quantitative analysis of RHE by HPLC
The HPLC system used in this study was an Agilent 1260 Infinity with an Agilent ZORBAX SB-C18 column (0.46 × 150 mm, Agilent, Palo Alto, CA) maintained at room temperature. The components were separated by gradient elution using methanol (solvent A) and 1% acetic acid (solvent B) at a constant flow rate of 1.0 mL/min. The gradient profile was as follows: 0–10 min, from 5% to 30% solvent A; 10–40 min, from 30% to 60% solvent A; 40–70 min, from 60% to 100% solvent A; 70–75 min 100% solvent A 0.10 μL of each sample was injected and monitored at 280 nm.
Recovery of the LCS test for different samples
To evaluate the LCS assay detecting RHE in biological samples, various concentrations of RHE standard were added to blank rat’s serum. The content of RHE in all the samples was assayed using LCS, and the recovery rate was determined.
Repeatability and stability analysis of the LCS assay
Assay stability was examined by using the LCS assays with the same batch of strips and at several RHE concentrations following storage for 1 month or 4 months at room temperature, with all strips sealed with desiccant.
Results
Determination of anti-RHE IgY antibody levels by indirect competitive ELISA (icELISA)
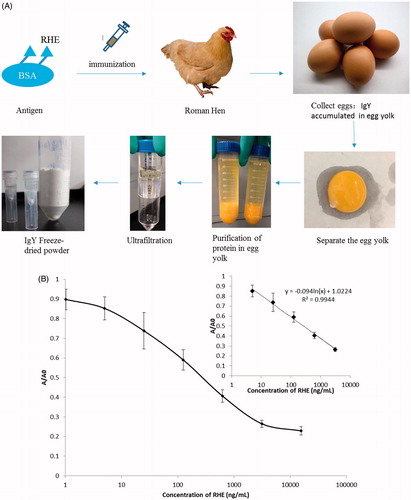
The preparation process of IgY is shown in . We calculated a standard curve in PBS buffer by relating RHE concentrations (1.02, 5, 25, 125, 625, 3125 or 15,625 ng mL−1) to the corresponding absorbance at each concentration. The relationship between RHE concentration and inhibition value was analysed using the software CurveExpert (v1.4; https://www.curveexpert.net/), enabling acquisition of the linear regression equation and correlation coefficient (R2). Our results showed that the curve was linear from 5 ng mL−1 to 3125 ng mL−1 (R2 = 0.9944; y = −0.094ln(x) + 1.0224) (), with a 50% inhibitor-response concentration (IC50) of 47.09 ng/mL and an LOD of 8.41 ng mL−1.
Figure 3. (A) The process of IgY purification from egg yolk. (B) Standard curve of RHE determination using icELISA. The regression equation was y = −0.094ln(x) + 1.0224, with R2 = 0.9944.
Qualitative testing of the LCS assay
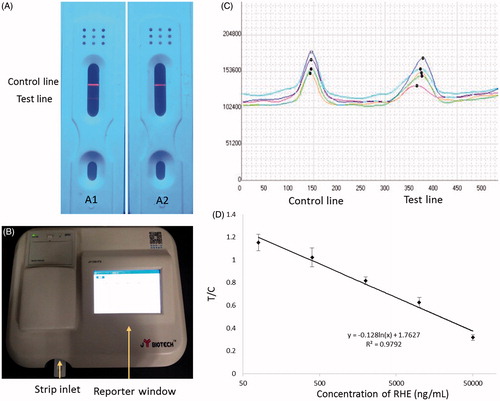
The LCS assay is based on a competitive-immunoassay principle using an anti-RHE IgY as the detector. The test solution is applied to the sample pad, followed by migration upward by capillary action to dissolve the dried QD-conjugated anti-RHE IgY on the conjugate pad. When the sample solution passes over the test line (RHE-BSA), the analyte-free QD-conjugated anti-RHE IgY binds to the RHE-BSA conjugate, revealing a fluorescent line at the test line under ultraviolet light. If the antibody is already bound to RHE, it does not interact with RHE-BSA. Any RHE present in the sample competes with immobilized RHE-BSA on the membrane for the limited amount of antibody. Finally, the QD-conjugated anti-RHE IgY that is not bound to RHE-BSA at the test line is captured with anti-mouse IgG at the control line. In our experiments, a positive sample produced no visible test spot at the test line, and the control line was always visible. Additionally, we observed fluorescence appeared at both the test and control lines when the sample contained no RHE (negative sample; ). However, no fluorescence was observed at the test line when the sample contained RHE (positive sample; ).
Figure 4. (A) Qualitative results obtained using the LCS test for RHE showing negative (A1) and positive samples (A2) under ultraviolet light. Fluorescence appearing at both the test and control lines indicated that the sample was free of RHE. Fluorescence appearing only at the control line indicated that the sample was positive for RHE. (B) Photograph of the matched-scanning luminoscope. (C) The fluorescence-intensity pattern scanned by the luminoscope. (D) Standard curve for RHE determination using icELISA. The regression equation was y = −0.128ln(x) + 1.7627, with R2 = 0.9792.
Quantitative testing of the LCS assay
LCS sensitivity
To determine the sensitivity of the LCS assay, RHE-standard solutions were diluted with pure water at various concentrations from 80 ng mL−1 to 50 μg mL−1, with double-distilled water used as the control. Each sample was assayed at least three times using the LCS. In the quantitative experiment, RHE-detection results were scanned using a portable fluorescence-strip reader (), and we calculated the standard curve by relating known RHE concentrations to the corresponding absorbance at each concentration. The relationship between RHE concentration and fluorescence value analysed using CurveExpert software revealed a linear regression equation of y = −0.128ln(x) + 1.7627 and an R2 = 0.9792 (), with an IC50 value of 932 ng mL−1 and a qualitative-detection limit of 98.2 ng mL−1 according to extrapolation of A0−2SD [Citation28]. Additionally, an appropriate sample volume was determined to be 30 µL, with an appropriate test time suggested as 10 min.
LCS specificity
The specificity of the LCS assay was tested by evaluating its reactivity with other compounds in commonly used Chinese medicinal herbs. We found that rheum emodin exhibited cross-reactivity with the anti-RHE IgY (64.58%), but that the strip exhibited no cross-reactivity with other tested compounds (). The absence of cross-reactivity by the anti-RHE with other compounds associated with TCM, suggested that the LCS assay based on use of the IgY exhibited high specificity, and that the LCS assay can potentially be used for compound detection in TCM.
Table 1. Cross-reactivity of compounds measured by LCS and icELISA.
Comparative analysis of LCS and HPLC
The LCS was used to detect RHE in several producing areas of Rheum officinale extract and compared with HPLC. As shown in , the results obtained by LCS and HPLC showed good concordance for all samples while the sample without RHE (licorice extract, S5) yielded negative results by LCS.
Table 2. Comparative analysis of LCS and HPLC.
Recovery rate
The recovery experiment was performed by adding various concentrations of RHE standard to blank rat serum and the amounts of precisely added RHE were detected by the LCS. As shown in , the average recovery rate was 96.95% (mean ± SD, n = 3). Based on its accuracy and consistency, this assay was sufficiently reliable for the determination of RHE in biological samples.
Table 3. Recovery of RHE in rat serum determined by ELISA in spiked samples.
Repeatability and stability analysis of the LCS assay
Assay stability was examined by using the LCS assays with the same batch of strips and at several RHE concentrations following storage for 1 month or 4 months at room temperature, with all strips sealed with desiccant. The results provided in show that the same intensity of fluorescence signal developed on the test line of the strip following storage for 4 weeks. The intensity of the fluorescence signal on the test and control lines observed following storage for 4 months appeared slightly weaker as compared with those observed on strips stored for 1 month; however, the loss of intensity was not significant, with a coefficient of variation <6%. These results indicated that the LCS assay remained stable after 4 month of storage at room temperature, revealing that the new LCS assay was suitable for RHE-specific quantitative analysis.
Table 4. Variations in LCS for RHE analysis.
Discussion
In this study, we applied QDs as signal-intensity reporters and compared their use with traditional LCS systems which can only provide qualitative (“yes/no” signal) result. Most LCS tests use colloidal gold as reporters and can only provide qualitative or semi-quantitative results. Fluorescence materials are the better choice, because optical signals are sensitive, and fluorescence-tagged LCS offers the potential for quantification. However, organic fluorescent dyes have intrinsic limitations, such as photobleaching, which limit their further application.
Our findings confirmed that, compared with traditional colloidal gold-labelled LCS systems that provide low signal intensity and error-prone changes in colour, the fluorescence-labelled LCS assay was more suitable for quantitative analysis.
Use of fluorescent dyes, such as fluorescein isothiocyanate, Cy3 or Cy5, as reporters makes them susceptible to nonspecific fluorescence, photobleaching and quenching. By contrast, QDs show excellent properties, including high degrees of stability, against photobleaching and/or chemical degradation, as well as high levels of fluorescent quantum yield [Citation29]. According to our data, development of the LCS assay using QDs as reporters for qualitative detection of RHE resulted in high degrees of both specificity and stability [Citation30,Citation31].
The ELISA and LCS assay both constitute immunity assays dependent upon antigen–antibody reactions. However, the LCS assay is less time intensive due to the decreased incubation time and fewer washing steps necessary as compared with the ELISA, making the LCS assay convenient for instant detection [Citation32]. Additionally, traditional methods require specialized training and instrumentation, potentially necessitating their use in a lab environment, whereas the LCS assay requires only a fluorescence reader for applications in field-based testing.
Previously, we developed an LCS assay based on the use of an IgG mAb. In this study, we develop an LCS assay using an IgY rather than IgG based on the inability of the IgY antibody to react with mammalian IgG antibodies or rheumatoid factors, thereby reducing the possibility of cross-reactivity during immune detection. Additionally, production of large amounts of IgG requires use of mouse ascites or hybridoma cell cultures, which are costly methods, with the ascite assays requiring the sacrifice of numerous BALB/c mice. However, the amount of IgY capable of being obtained from a single egg is multi-fold higher than possible IgG accumulation using standard methods, with IgY-antibody generation also capable of being performed inexpensively and in a non-invasive manner [Citation18,Citation24,Citation33]. Therefore, use of IgY antibodies reduces costs and promotes animal welfare.
To avoid the inference of nonspecific binding, the detection system was improved. For instance, the glass fibre XQ-Y7 and Ahlstrom 8964 were chosen for sample pads and conjugated pads because their fibre can induce the background signal. The sample pads and conjugated pads were treated with the buffer system Tris–HCl containing 1% (w/v) BSA, 0.5% (v/v) Tween 20, 0.1% (w/v) casein and 1% (w/v) polyethylene glycol 20,000. This buffer system can seal the nonspecific sites of fibra, promote the releasing and moving of QDs-IgY conjugate on the pads and scour off the uncombined antibodies.
Conclusions
In this study, a QD-conjugated anti-RHE IgY was prepared, and an LCS assay was developed for detecting RHE in plant preparations and biological samples. The LCS assay, which was based on a competitive-immunoassay principle using the anti-RHE antibody, showed high specificity for RHE and a qualitative-detection limit of 98.2 ng mL−1. Our quantitative data of Rheum officinale samples indicated that the specificity, accuracy and detection range (80–5000 ng/mL) of the strip were highly suitable for RHE detection in practical use. The results of the LCS assay showed good correlation with HPLC. Additionally, performance of the assay required neither intensive labour nor expensive equipment for sample analysis, with the assay being simple to use and detection capable of being completed within 10 min. In summary, the LCS assay developed in this study represents a rapid, low-cost and on-site self-detection method for quantifying the concentration of RHE, an active ingredient in certain TCMs.
We hope this manuscript can create a normal form for rapid detection the active or potentially harmful ingredient of TCM. And the LCS assay may be applied as a supplement or alternative to instrument detection which can be used by ordinary people to decrease adverse drug reaction caused by counterfeit drugs or drug abuse of TCM.
supplementary_material.docx
Download MS Word (790 KB)Acknowledgements
The authors thank Elsevier Professional Group Editing for providing language assistance and for proofreading the manuscript.
Disclosure statement
The authors declare no competing financial interests.
Funding
This work was supported by the National Natural Science Foundation of China (grant numbers 81573573, 81473338 and 81503344) and the Classical Prescription Basic Research Team of the Beijing University of Chinese Medicine.
References
- Azelmat J, Larente JF, Grenier D. The anthraquinone rhein exhibits synergistic antibacterial activity in association with metronidazole or natural compounds and attenuates virulence gene expression in Porphyromonas gingivalis. Arch Oral Biol. 2015;60:342–346.
- Wang J, Liu S, Yin Y, et al. FOXO3-mediated up-regulation of Bim contributes to rhein-induced cancer cell apoptosis. Apoptosis. 2015;20:399–409.
- Yu C, Qi D, Sun JF, et al. Rhein prevents endotoxin-induced acute kidney injury by inhibiting NF-kappaB activities. Sci Rep. 2015;5:11822.
- He LN, Yang AH, Cui TY, et al. Reactive metabolite activation by CYP2C19-mediated rhein hepatotoxicity. Xenobiotica. 2015;45:361–372.
- Bironaite D, Ollinger K. The hepatotoxicity of rhein involves impairment of mitochondrial functions. Chem-Biol Interact. 1997;103:35–50.
- Layek B, Kumar TS, Trivedi RK, et al. Development and validation of a sensitive LC–MS/MS method with electrospray ionization for quantitation of rhein in human plasma: application to a pharmacokinetic study. Biomed Chromatogr. 2008;22:616–624.
- Zhang YX, Li JS, Peng W, et al. Comparative pharmacokinetics of aloe-emodin, rhein and emodin determined by liquid chromatography-mass spectrometry after oral administration of a rhubarb peony decoction and rhubarb extract to rats. Die Pharm. 2013;68:333–339.
- Chewchinda S, Wuthiudomlert M, Gritsanapan W. HPLC quantitative analysis of rhein and antidermatophytic activity of Cassia fistula pod pulp extracts of various storage conditions. BioMed Res Int. 2013;2013:821295.
- Liu X, Marrakchi M, Xu D, et al. Biosensors based on modularly designed synthetic peptides for recognition, detection and live/dead differentiation of pathogenic bacteria. Biosens Bioelectron. 2016;80:9–16.
- Hu J, Zhang ZL, Wen CY, et al. Sensitive and quantitative detection of C-reaction protein based on immunofluorescent nanospheres coupled with lateral flow test strip. Anal Chem. 2016;88:6577–6584.
- Yang Q, Gong X, Song T, et al. Quantum dot-based immunochromatography test strip for rapid, quantitative and sensitive detection of alpha fetoprotein. Biosens Bioelectron. 2011;30:145–150.
- Li X, Li W, Yang Q, et al. Rapid and quantitative detection of prostate specific antigen with a quantum dot nanobeads-based immunochromatography test strip. ACS Appl Mater Interfaces. 2014;6:6406–6414.
- Ren M, Xu H, Huang X, et al. Immunochromatographic assay for ultrasensitive detection of aflatoxin B(1) in maize by highly luminescent quantum dot beads. ACS Appl Mater Interfaces. 2014;6:14215–14222.
- Wang D, Tian BB, Zhang ZP, et al. Detection of Bacillus anthracis spores by super-paramagnetic lateral-flow immunoassays based on "Road Closure". Biosens Bioelectron. 2015;67:608–614.
- Xing C, Liu L, Song S, et al. Ultrasensitive immunochromatographic assay for the simultaneous detection of five chemicals in drinking water. Biosens Bioelectron. 2015;66:445–453.
- Huang X, Aguilar ZP, Xu H, et al. Membrane-based lateral flow immunochromatographic strip with nanoparticles as reporters for detection: a review. Biosens Bioelectron. 2016;75:166–180.
- Zhang W, Ge X, Tang Y, et al. Nanoparticle-based immunochromatographic test strip with fluorescent detector for quantification of phosphorylated acetylcholinesterase: an exposure biomarker of organophosphorus agents. Analyst. 2013;138:5431–5436.
- Berlina AN, Taranova NA, Zherdev AV, et al. Quantum dot-based lateral flow immunoassay for detection of chloramphenicol in milk. Anal Bioanal Chem. 2013;405:4997–5000.
- Qu H, Zhang Y, Qu B, et al. Rapid lateral-flow immunoassay for the quantum dot-based detection of puerarin. Biosens Bioelectron. 2016;81:358–362.
- Gandhi S, Caplash N, Sharma P, et al. Strip-based immunochromatographic assay using specific egg yolk antibodies for rapid detection of morphine in urine samples. Biosens Bioelectron. 2009;25:502–505.
- Reddy PK, Shekar A, Kingston JJ, et al. Evaluation of IgY capture ELISA for sensitive detection of alpha hemolysin of Staphylococcus aureus without staphylococcal protein A interference. J Immunol Methods. 2013;391:31–38.
- Akita EM, Nakai S. Comparison of four purification methods for the production of immunoglobulins from eggs laid by hens immunized with an enterotoxigenic E. coli strain. J Immunol Methods. 1993;160:207–214.
- Lisa M, Chouhan RS, Vinayaka AC, et al. Gold nanoparticles based dipstick immunoassay for the rapid detection of dichlorodiphenyltrichloroethane: an organochlorine pesticide. Biosens Bioelectron. 2009;25:224–227.
- Neri P, Tokoro S, Kobayashi R, et al. Specific egg yolk immunoglobulin as a new preventive approach for Shiga-toxin-mediated diseases. PLoS One. 2011;6:e26526.
- Verdoliva A, Basile G, Fassina G. Affinity purification of immunoglobulins from chicken egg yolk using a new synthetic ligand. J Chromatogr. B Biomed Sci Appl. 2000;749:233–242.
- Yan Z, Huihua Q, Xueqian W, et al. A sensitive and specific indirect competitive enzyme-linked immunosorbent assay for detection of paeoniflorin and its application in pharmacokinetic interactions between paeoniflorin and glycyrrhizinic acid. Planta Med. 2015;81:765–770.
- Le T, Zhu L, Yang X. A quantum dot-based immunoassay for screening of tylosin and tilmicosin in edible animal tissues. Food Addit Contam A Chem Anal Control Expos Risk Assess. 2015;32:719–724.
- Hua X, Qian G, Yang J, et al. Development of an immunochromatographic assay for the rapid detection of chlorpyrifos-methyl in water samples. Biosens Bioelectron. 2010;26:189–194.
- Omidfar K, Khorsand F, Darziani Azizi M. New analytical applications of gold nanoparticles as label in antibody based sensors. Biosens Bioelectron. 2013;43:336–347.
- Bajwa N, Mehra N, Jain KK, et al. Pharmaceutical and biomedical applications of quantum dots. Artif Cells Nanomed Biotechnol. 2016;44:758–768.
- Abbasi E, Kafshdooz T, Bakhtiary M, et al. Biomedical and biological applications of quantum dots. Artif Cells Nanomed Biotechnol. 2016;44:885–891.
- Xiang T, Zheng J, Jian Z, et al. A novel double antibody sandwich-lateral flow immunoassay for the rapid and simple detection of hepatitis C virus. Int J Mol Med. 2012;30:1041–1047.
- LeClaire RD, Hunt RE, Bavari S. Protection against bacterial superantigen staphylococcal enterotoxin B by passive vaccination. Infect Immun. 2002;70:2278–2281.