
 ?Mathematical formulae have been encoded as MathML and are displayed in this HTML version using MathJax in order to improve their display. Uncheck the box to turn MathJax off. This feature requires Javascript. Click on a formula to zoom.
Abstract
Nanocapsules (NCS-DOX) with an oily core of selol and a shell of poly(methyl vinyl ether-co-maleic anhydride) covalently conjugated to doxorubicin were developed. These nanocapsules are spherical, with an average hydrodynamic diameter of about 170 nm, and with negative zeta potential. NCS-DOX effectively co-delivered the selol and the doxorubicin into 4T1 cells and changed the intracellular distribution of DOX from the nuclei to the mitochondria. Moreover, a significantly increased cytotoxicity against 4T1 cells was observed, which is suggestive of additive or synergic effect of selol and doxorubicin. In conclusion, PVM/MA nanocapsules are suitable platforms to co-deliver drugs into cancer cells.
Introduction
Doxorubicin (DOX) is an anticancer drug used in the treatment of solid and hematologic cancers [Citation1]. As a DNA-intercalating agent, it inhibits the replication and transcription of DNA [Citation2]. However, problems such as the induction of irreversible cardiac lesions and the occasional drug resistance presented by some cancers are listed among the drawbacks observed with the use of DOX [Citation3]. Although the mechanism behind the cardiotoxicity of DOX is not fully understood, the oxidative stress and disrupted mitochondrial energy metabolism observed in cardiomyocytes exposed to DOX have been suggested as the main events leading to cardiotoxicity [Citation4].
In this context, studies have shown that the association of anticancer drugs to nanocarriers may increase their plasma half-life, their accumulation in the target tissue, and change their subcellular distribution, potentially increasing both their efficacy and safety [Citation5]. In fact, the association of the DOX to nanocarriers [Citation6], has successfully reduced its cardiotoxicity. Moreover, nanocarriers permit the combination of different drugs in one single compartment, a strategy indicated by some studies as capable of increasing the efficacy of the treatment and of reducing the probability of selection of resistant clones in the tumour tissue exposed to chemotherapy [Citation7]. On that ground, selol has been speculated as a candidate for combinatory anticancer chemotherapy due to its cytostatic activity and chemotherapy-sensitizing property [Citation8–10]. The selol is an oily mixture of different selenitetriacylglycerides, which contain organified selenium at its +4 oxidation state. Suchocki et al. showed that the selol significantly reduced the viability of DOX-resistant leukaemia cells in vitro [Citation8]. Moreover, de Souza et al. showed that selol is cytostatic for lung adenocarcinoma A549 cells and urethane-induced lung cancer [Citation9,Citation10].
Thus, the goal of this work was to development nanocapsules loaded with selol and DOX, intended for combinatorial chemotherapy protocols, and test their activity in in vitro against murine adenocarcinoma 4T1 cells. Nanocapsules consisted of an oily core of selol with a shell of poly(methyl vinyl ether-co-maleic anhydride) (PVM/MA) conjugated to the DOX, and co-delivered both drugs into cancer cells, showing to be more effective than the isolated drugs.
Experimental
Materials
Selol, 5% in selenium (w:w), was provided by Warsaw Medical University, Poland; PVM/MA (Gantrez AN 119) was kindly donated by ISP Corporation, Brazil. The mouse mammary carcinoma cell line (4T1) was purchased from American Type Culture Collection, Manassas, VA, and the mouse fibroblasts (NIH 3T3) were purchased from the Cell Bank of Rio de Janeiro, Brazil. 7AAD (7-amino-actinomycin D), annexin V-FITC and RNAse were purchased from Bethesda, BD. 3,4,5-dimethylthiazol-2,5 biphenyl tetrazolium bromide (MTT) and rhodamine 123 were purchased from Thermo Fisher, Waltham, MA. Dulbecco’s modified Eagle’s medium (DMEM), Roswell Park Memorial Institute medium (RPMI), foetal bovine serum (FBS), penicillin, streptomycin and tripsin were all purchased from Gibco, Carlsbad, CA. Acetone (99.60%), acetonitrile (99.95% – grade HPLC), ethanol (99.3° INPM), glucose, and methanol (99.96% – grade HPLC) were all purchased from J.T. Backer, Brazil. Trichloroacetic acid (≥99.0%), tripan blue, potassium bromide (≥99,0%), dimethyl sulphoxide (DMSO ≥99.5%), doxorubicin (European Pharmacopoeia standards), AgNO3 (ACS reagent, ≥99.0%), paraformaldehyde (reagent grade), superfibronectin, ligation buffer (0.1 M 4–(2-hydroxyethyl)-1-piperazineethanesulfonic acid, 1.4 M NaCl e 25 mM CaCl2, pH 7.4) and Tween 80 were all purchased from Sigma-Aldrich, St. Louis, MO. CaF2 was purchased from Crystal GmbH, Germany. Dulbecco`s Phosphate Buffered Saline was supplied by Biowest, Nuaillé, France. Polypropylene foil was obtained from GoodFellow, London, UK. Dialysis membrane (50 KDa) was purchased from Spectrum Laboratories, Phoenix, AZ. Osmium tetroxide for microscopy was obtained from Electron Microscopy Sciences, Hatfield, PA.
Preparation of nanocapsules
Nanocapsules with an oily core of selol and a shell of PVM/MA conjugated with doxorubicin, henceforward referred to as the NCS-DOX, were prepared by a variation of a nanoprecipitation method recently described by our group [Citation9]. The PVM/MA conjugated with doxorubicin is referred to as Pol-DOX along the text. Briefly, 50 mg of PVM/MA and 2.5 mg of DOX were both dissolved in 100 µL of DMSO and this solution was then added to 4.9 mL of acetone. The mixture was then left in the dark under mild agitation for 24 h, in a sealed flask, in order to conjugate DOX to PVM/MA by the reaction of anhydride groups of the polymer with the primary amine of DOX. After this 24-h period, 60 mg of selol were added to the solution, which was then kept under mild stirring for further 15 min. Next, 10 mL of ethanol were poured into this solution at once, and the resulting mixture was then verted into an aqueous solution of Tween 80 0.6% (w:v), in order to induce the formation of nanocapsules by the precipitation of the Pol-DOX on the interface between selol and the aqueous phase. Then, acetone and ethanol were both removed by distillation under reduced pressure in a rotavapor apparatus (Rotavapor RII®, Buchi, Switzerland). Concentrations of DOX and selol in this final formulation were 0.5 and 12 mg/mL, respectively. Selol nanocapsules without DOX were also produced by this same method.
Physicochemical characterizations
Nanocapsules characterization and stability tests
The hydrodynamic diameter (HD), polydispersity index (PDI) and zeta potential (ZP) of NCS-DOX were analysed by dynamic light scattering (Zetasizer Nano ZS®, Malvern Instruments Ltd.; Malvern, UK; Laser 633 nm). For the stability analysis, the NCS-DOX dispersed in water was stored at 20–30 °C (room temperature), 4 or 37 °C for up to 375 d and measurements of HD, PDI and ZP were performed regularly. Also, a sample of NCS-DOX dispersed in cell culture medium supplemented with FBS was conditioned under cell culture conditions, and the same colloid characteristics were evaluated for up to 48 h.
Scanning electron microscopy
The surface morphology of NCS-DOX was analysed by scanning electronic microscopy (SEM) (Feg Quanta 250, FEI Company, Hillsboro, OR), accordingly to a previously described protocol [Citation1].
Quantification of doxorubicin by HLPC
DOX concentration was analysed in samples by high-performance liquid chromatography (HPLC) (Shimadzu-Prominence, Kyoto, Japan). The stationary phase consisted of a reversed-phase ACE AQ C18 column (25 × 0.4 cm, 5 µm particle diameter) (ACE Aberdeen, Scotland) with a precolumn (1 × 0.4 cm, 5 µm particle diameter) (ACE Aberdeen, Scotland). The mobile phase was obtained by mixing up 65% aqueous trichloroacetic acid 0.05 M and 35% acetonitrile (v:v). DOX was detected by its fluorescence, with wavelength of excitation of 470 nm and emission 555 nm. The injection volume was 20 µL, the flow rate was 1 mL/min at a pressure of 120 kgf/cm−2. The temperature of the column was maintained at 30 °C during all the runs. The software LC solution (Shimadzu, Tokyo, Japan) was used for processing and identification of chromatographic parameters.
Profile of doxorubicin release
The analysis of DOX release from the NCS-DOX was performed using dialysis membranes with a pore size of 50 kDa (ester cellulose membranes, SpectrumLabs, Phoenix, AZ), followed by HPLC quantification of DOX in the dialysis medium at 37 °C. The percentage of DOX released from the dialysis bag was calculated according to the following equation:
The total DOX in the system is the maximum theoretical concentration of DOX (2 µg/mL).
Fourier transform infrared spectroscopy
In order to analyse the type of chemical interaction between DOX and PVM/MA in NCS-DOX, transmittance spectra in the infrared region of several samples were obtained with Fourier transform infrared spectrometer (FTIR, Vertex 70, Bruker, Billerica, MA). The following samples were analysed: DOX, PVM/MA, selol, NCS, Pol-DOX and NCS-DOX. For the preparation of the tablet, the dried samples were diluted in dry KBr in the ratio 1:100 (w:w).
Surface-enhanced Raman spectroscopy
Surface-enhanced Raman spectroscopy (SERS) was performed with DOX, PVM/MA, selol, NCS, Pol-DOX and NCS-DOX samples deposited on plates covered with silver nitrate film at 6 × 10⁻⁴ mol/L and dried with gaseous nitrogen. For obtaining SERS spectra, a triple spectrometer (Jobin Yvon Model T64000, triple Raman Spectrometer, Horiba, Japan) was employed. The argon ion laser beam was focused on the sample by means of a cylindrical lens, which provided a potency density of 0.1 W/cm2, to avoid heating the samples and to ensure the reproducibility of SERS spectra. The spectral line of the argon ion laser used was 514.5 nm with optical potency in the sample of 200 mW. The scattered light was collected by the macro-Raman device.
Biological tests
Cell culture
Murine breast adenocarcinoma cells (4T1) were cultured in RPMI supplemented with 10% (v:v) FBS and 1% (v:v) antibiotics solution (final concentration of 100 units/mL penicillin and 100 µg/mL streptomycin). Murine fibroblasts (NIH-3T3) were grown in DMEM supplemented with 10% FBS and 1% antibiotic – these cells were used as non-tumour control cells in in vitro experiments. Cells were maintained in an incubator under humidified atmosphere with 5% CO2 at 37 °C.
In vitro analysis of cytotoxicity
Cells were seeded at a concentration of 1 × 10⁴ cells/well in 96-well culture plates and exposed for 48 h to NCS-DOX, Pol-DOX, NCS, PVM/MA, DOX or culture medium (negative control). Each treatment was performed in sextuplicate. The PVM/MA and selol concentrations were equivalent in all the treatments containing these molecules. The MTT assay was used to assess cell viability [Citation11].
Real-time measurement of cell adhesion
The cell adhesion is proportional to the proliferation and the viability of cultured cell. A real-time microelectronic cell analyser (xCelligence, Roche, Switzerland) was used to perform this experiment using a protocol described in the literature [Citation9].
Analysis of the subcellular location of doxorubicin by fluorescence confocal microscopy
To identify the subcellular location of DOX, 4T1 cells were seeded at a concentration of 5 × 10⁴/well over round glass coverslip, 18 mm in diameter, on 12-well culture plates. After 24 h, cells received 800 µL of medium with NCS-DOX, Pol-DOX or DOX. The DOX concentration was 9 µg/mL for all the treatments, and the selol concentration was 216 µg/mL for NCS-DOX treatment. After 6 h of exposure to the treatments, cells were exposed for 30 min under culture conditions to the markers of mitochondria (MitoTracker®), endoplasmic reticulum (ER-Tracker®), nuclei (DAPI) or lysosomes (LysoTracker®), according to the instructions from the manufacturer. For staining the nuclei, cells were exposed to DAPI for 5 min. Next, cells were washed twice with PBS and immediately analysed in the confocal laser scanning microscope (TSC SP5, Leica, Germany).
The images were obtained with objective lens of 63x, with resolution of 1024 × 1024 pixels and 100 Hz frequency. Images were analysed with the software Image J (NIH Image J system, Bethesda, MD) using the plugin for colocalization and intensity correlation analyses.
Analysis of the subcellular location of doxorubicin by Raman microspectroscopy
Confocal Raman microspectroscopy (CRM) analyses were performed using an Alpha300 R microscope (WITec GmbH, Ulm, Germany) equipped with a 785 nm laser source, a 300 g mm−1 grating and a charge-coupled device (CCD) cooled down to −61 °C. All measurements were conducted using a 63x water immersion objective (W Plan-Apochromat 63×/1.0, Zeiss, Oberkochen, Germany). 4T1 cells were seeded onto CaF2 substrates and exposed to NCS-DOX (9 µg/mL DOX and 216 µg/mL Selol) for 6 h. After formaldehyde fixation, the cells were scanned with a laser power of 90 mW at 785 nm. Raman spectra were collected pixel-wise in x–y direction as well as x–z direction with an integration time of about 0.17 s. Acquired spectra were processed using the Project FOUR PLUS software (WITec GmbH, Ulm, Germany).
Quantification and analysis of the subcellular location of selenium by ion beam microscopy
4T1 cells were cultivated on superfibronectin coated 4 µm thick polypropylene foil and exposed to NCS-DOX particles (9 µg/mL DOX and 216 µg/mL Selol) for 6 h. Afterwards cells were washed with Dulbecco’s Phosphate Buffered Saline and fixed with 100% methanol (−20 °C) for 15 min at 4 °C. Ion beam microscopy (IBM) were performed at the Leipzig ion nanoprobe laboratory LIPSION using a 2.25 MeV proton beam with a spot size of approximately 1 µm. Two-ion beam microscope techniques under high-vacuum conditions (10−6 Torr), the micro-proton induced X-ray emission (µPIXE) and the micro-Rutherford backscattering (µRBS), were simultaneously used to study the spatial distribution of cellular elements as well as selenium one. Extracted µRBS spectra from individual cells were analysed to determine accumulated charge, area density (atoms/cm2) and elemental matrix composition (C, N, O). These parameters were used as input for µPIXE analysis by means of GeoPIXE software (CSIRO Earth Science and Resource Engineering, Australia) to quantify element concentration within the cells.
Statistical analysis
Data were analysed with GraphPad Prism® version 6.0 software (GraphPad Software, La Jolla, CA). Significant differences between data sets were assessed by one- or two-way ANOVA, with Tukey’s or Sidak’s post-tests (α = 0.05). Quantitative results were expressed as mean ± standard error of the mean.
Results and discussion
As shown in , NCS-DOX exhibited a PDI value below 0.1, which is indicative of monodisperse populations of nanocapsules [Citation5]. NCS-DOX dispersed in water were stable during the 375 d of analysis, presenting only slight variations on the analysed colloid parameters (Figure S1). NCS-DOX were also stable when dispersed in culture medium, at cell culture conditions, for the 48 h of test. The analysis of both the ZP values and the chemical structure of PVM/MA give insights into a plausible model of structural organization for NCS-DOX. With its anhydride groups intact, PVM/MA is poorly soluble in water; however, the anhydride groups exposed to water are progressively hydrolysed to carboxyl groups, with a pKa around 4. At pH around 7, these carboxyl groups are deprotonated to carboxylate groups, significantly increasing the hydrophilicity of the hydrolysed moieties of the polymer. Thus, carboxylate-rich PVM/MA moieties are expected to be exposed onto the surface of the nanocapsules, while its hydrophobic, anhydride-rich moieties remain protected from water in deeper layers of the shell, mainly in contact with the oily core. [Citation9] This model is supported by ZP values obtained for nanocapsules, which are usually around −30 mV due to the carboxylate groups of PVM/MA exposed on the surface of the NCS-DOX. This feature may confer the system not only colloidal stability but also strengthen the interaction of the nanocapsules with plasma membrane by ionic and ion-dipole interactions [Citation9,Citation12]. NCS-DOX presented spherical morphology as seen in SEM images (). Spherical nanoparticles are suitable for parenteral administration [Citation13].
Figure 1. Morphology of nanocapsules containing selol and doxorubicin (NCS-DOX) assessed by scanning electron microscopy (SEM), in two different magnifications, 33,000× and 22,000×, as indicated in the electronmicrographs.
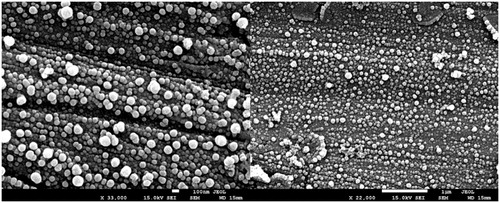
Table 1. Hydrodynamic diameter (HD, z-average), polydispersity index (PDI) and zeta potential (ZP) of nanocapsules. Values are expressed as mean ± standard error of the mean.
The PVM/MA served not only as the shell of NCS-DOX, but also as a matrix for the association of DOX by amide group formation by the reaction of PVM/MA anhydride with DOX primary amine, and by complexation between carboxylate and aminium groups. The FTIR spectrum of PVM/MA () shows characteristic bands at 1860 and 1780 cm−1, which may be assigned to the C=O stretching of cyclic anhydrides and stretching of COOH groups, respectively. The bands at 1225, 1090 and 926 cm−1 can be assigned to ether bonds and to stretching of the C–C skeleton, while the bands at 2944 and 2842 cm−1 correspond to CH2 asymmetric and symmetric stretching vibrational modes, respectively. Lastly, the bands of highest energy (above 3300 cm−1) are assigned to the hydrogen-bonded structures [Citation14]. The FTIR spectrum of DOX is found to be in agreement with previous reports [Citation15], showing vibrational modes with typical features of the symmetric –NH3+ stretch mode at 2978 cm−1, bonded N–H stretch at 3180 cm−1 and N-H deformation bands at 1582 and 1625 cm−1. The vibration modes of the skeletal ring (805, 1000, 1073, 1210, 1285, 1416 and 1530 cm−1), C–H (970, 1073 and 1200 cm−1) and C=O (1730 cm−1) groups considerably contribute to the FTIR spectra of DOX.
Figure 2. FTIR spectra (left) of PVM/MA, DOX (doxorubicin), Pol-DOX (reaction product of PVM/MA and doxorubicin) and NCS-DOX (nanocapsules containing selol and doxorubicin). The graph on the right presents SERS spectra of DOX, Pol-DOX and NCS-DOX.
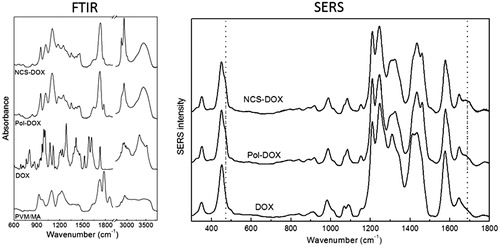
Evidences of the conjugation of DOX to PVM/MA are found in FTIR and SERS spectra (). In FTIR spectra, a peak at 3482 cm−1, which is assigned to the N–H stretch of a substituted amide, is clearly identified for NCS-DOX and Pol-DOX, but is absent for both PVM/MA and DOX, indicating an amide bond between the shell polymer and DOX in nanocapsules. In fact, the amino group is a strong nucleophile that may react with the anhydride group to form amide bond. Another hypothesis is that the aminium group of DOX is interacting ionically with carboxylate groups generated by the hydrolysis of PVM/MA [Citation15]. As expected, the FTIR spectrum of the Pol-DOX presents the same features observed in the spectrum of the NCS-DOX. The only difference worthy of note is the presence of two intense peaks at 2850 and 2930 cm−1, related to the presence of the selol entrapped in the core of the NCS-DOX.
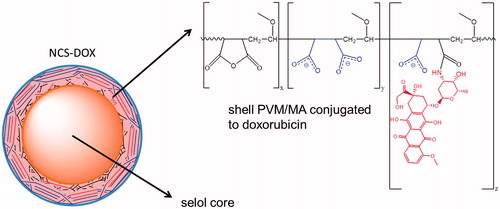
Further insight into the type of interaction established between PVM/MA and DOX in NCS-DOX are found in SERS spectra (). SERS spectrum of the DOX confirms the data reported in the literature [Citation1,Citation16], with typical narrow peaks of DOX centred at 450 and 1645 cm−1 assigned to the C=O in-plane deformation and stretching modes (ring B). Pol-DOX and NCS-DOX spectra show, besides the DOX peaks, new bands at 462 and 1688 cm−1, which are assigned to C=O bonds of amide group [Citation17]. In addition, the SERS intensity of the vibrational modes associated to the stretching of C=C (1434 cm−1) and C–C (1460 cm−1) of aromatic hydrocarbons in both Pol-DOX and NCS-DOX presents a different behaviour than in DOX, with a decreased band at 1434 cm−1 and an increased band at 1460 cm−1. Taken together, these results support that DOX is conjugated to PVM/MA, which forms the shell around the selol core, and exposes the hydrophilic carboxylate groups onto the surface of NCS-DOX ().
Figure 3. Schematic representation of NCS-DOX (nanocapsules containing selol and doxorubicin), with carboxylate groups in blue and the doxorubicin residue in red (color figure online).
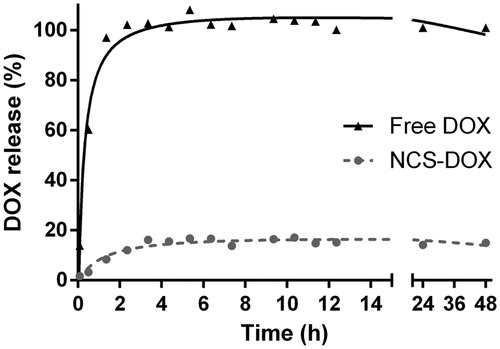
The release profile of DOX from the NCS-DOX suspension () also evidences that DOX is strongly associated to the nanocapsules. A free DOX solution was used as a control, and showed a relatively fast release of DOX, reaching 100% release of the total theoretical amount of DOX at 2 h and 35 min. The percentage of release of DOX from the NCS-DOX was significantly different, as it reached a plateau at about 4 h, with a maximum release of only 17.11%, suggesting that about 83% of DOX were strongly associated to nanocapsules. This result supports the FTIR and SERS findings, since strong chemical interactions, such as amide bond, between PVM/MA and DOX would in fact prevent DOX release to the dialysis medium.
Figure 4. Doxorubicin release profile from a dialysis bag containing NCS-DOX (nanocapsules containing selol and doxorubicin) or doxorubicin alone (free DOX) in PBS.
DOX and NCS-DOX exhibited similar intensities of interiorization in 4T1 cells at the first hour of treatment (Figure S2). At 3 h, however, the interiorization of NCS-DOX was significantly higher in comparison to the free DOX. Interestingly, Pol-DOX was more intensely interiorized in comparison to NCS-DOX and free DOX at all times of treatment. As previously discussed, PVM/MA is able to strongly interact with the plasma membrane. As the Pol-DOX is not a particle, but a soluble molecule instead, its surface-to-volume ratio is expected to be much higher.
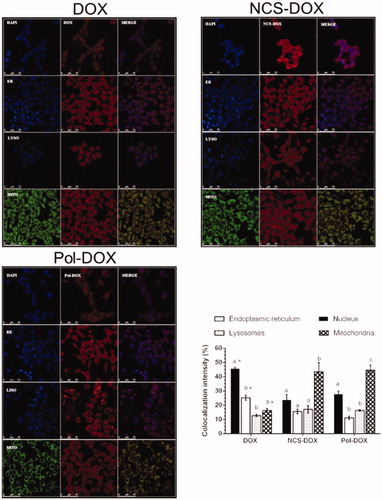
Interestingly, once interiorized, NCS-DOX presented a different subcellular distribution in comparison to the free DOX. shows the confocal images of 4T1 cells exposed to NCS-DOX, Pol-DOX and DOX, respectively, and the relative intensity of colocalization of the interiorized DOX with nuclei, mitochondria, endoplasmic reticulum and lysosomes. The free DOX, as expected [Citation18], accumulated mostly in nuclei (45.6% ± 0.8), followed by lower intensities of colocalization with endoplasmic reticulum (25.2% ± 1.7), mitochondria (16.3% ± 1.2) and lysosomes (12.7% ± 0.7). In cells treated with NCS-DOX and Pol-DOX, the DOX was found mainly in the mitochondria (43.4% ± 6.4 and 44.6% ± 3.4, respectively). Thus, the concentration of DOX in nuclei of cells exposed to NCS-DOX is about only half of that observed in nuclei of cells exposed to free DOX. This is paralleled by a significantly higher accumulation of DOX in mitochondria of cells exposed to NCS-DOX, almost three times more intense than in cells exposed to free DOX.
Figure 5. Images of confocal laser scanning of the 4T1 cells treated with DOX (doxorubicin alone), NCS-DOX or Pol-DOX, 9 µg DOX/mL for 6 h. Results of colocalization intensities are presented on the graph in the right bottom side. Nuclei were labelled with DAPI (blue), endoplasmic reticulum with ER-Tracker® (blue, ER), lysosomes with LysoTracker® (blue, LYSO) and mitochondria with MitoTracker® (green, MITO). DOX appears in red. Images were processed with Adobe Photoshop CC 2015 software (Adobe Systems Incorporated, San Jose, CA). Different letters above the columns in a single treatment indicate a statistically significant difference (p < .05). *p < .05 vs. same organelles in NCS-DOX and Pol-DOX (color figure online).
The subcellular distributions of both DOX and selol were also investigated by label-free molecule- and element-based imaging techniques, such as CRM, µPIXE and µRBS at the single cell level. Raman spectra were collected from each pixel of a mapping field in the fingerprint region ranged from 100 to 2000 cm−1. The cytoplasm relevant bands of proteins and lipids in this region are amide I (1660 cm−1), amide III (1260 cm−1), breathing mode of phenylalanine (1000 cm−1), C=O (1748 cm−1), C=C (1658 cm−1) and CH2 (1444 cm−1) stretching modes. The nucleus region of the cell was identified by Raman peaks at 788, 1097 and 1340 cm−1. The peak at 788 cm−1 is assigned to the O–P–O –stretching mode of the DNA backbone [Citation19]. The Raman peak in the nucleus spectrum at 1097 cm−1 is attributed to the PO2− stretching mode of the DNA whereas the band at 1340 cm−1 corresponds to guanine and adenine [Citation19,Citation20]. The above-mentioned highly specific bands of the nucleus, proteins as well as CH deformation, C=O and C=C stretching modes of lipids in lipid droplets (LDs) could be observed and serve as tool for the label-free discrimination of the cellular chemical composition. Noteworthy, LDs may be formed by the cell own metabolism, or alternatively by the accumulation of selol in NCS-DOX treated cells, as selol comprises a mixture of selenitetriacylglicerides. shows the average Raman spectrum of NCS-DOX extracted from their spectral image as well as the Raman spectrum of selol. The peak at 237 cm−1 is characteristic for E and A1 vibrational modes of amorphous selenium [Citation9]. This peak was used for the visualization of particles in cellular environment. Raman peaks of CH deformation, C=O and C=C stretching modes of PVM/MA and selol, as well as doxorubicin-related wagging modes, are denoted [Citation9].
Figure 6. Confocal Raman analyses: (a) Raman spectra of selol (red) and NCS-DOX (black). Characteristic Raman peaks of selenium, doxorubicin and Selol are denoted. (δ: deformation; ν: stretching; ω: wagging). (b) Confocal Raman imaging of 4T1 cells exposed to NCS-DOX over 6 h (left) and control 4T1 cells (right). The color-coded images represent the overlapping of lipids, DNA/RNA, cytoplasm, as well as doxorubicin and NCS-DOX (color figure online).
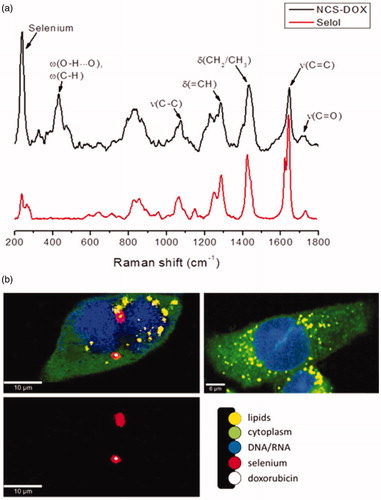
represents the x–y Raman images of 4T1 cells exposed to NCS-DOX over 6 h. The images were generated from molecular fingerprint of different cell components and reveal that NCS-DOX were taken up by the 4T1 cells and transported to the perinuclear region during a time period of 6 h. Nuclei of exposed cells were found to be damaged and partially defragmented. The color-coded images in display the overlapping of cytoplasm (green), nucleus (blue), lipids in the LDs (yellow), doxorubicin (white) and selenium (red). NCS-DOX were found in very close vicinity to the nucleus (violet colour as a superposition of red and blue) and co-localized with LDs (orange colour as a superposition of red and yellow).
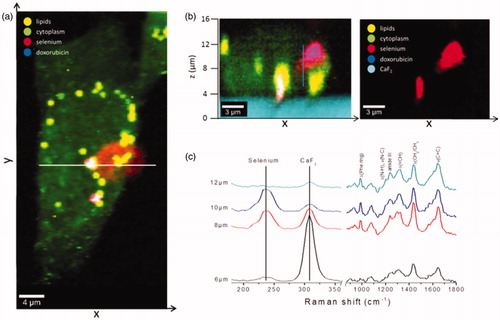
As regards the question whether NCS-DOX were actually located inside the cell or on the cell surface, a depth area scan (x–z) () was performed. Raman x–y area scan () displays the distribution pattern of NCS-DOX in the cytoplasm. The white line indicates the positions of x and y coordinates where the x–z depth scan was recorded. The depth images in reveal that NPs were interiorized by the 4T1 cells. Raman spectra were additionally collected in z-direction at the same x and y positions by steps of 200 nm over a distance of 20 µm. shows Raman spectra at four different z-positions above the substrate (CaF2) displaying selenium, cellular biomolecules (phenylalanine, proteins, lipids) and CaF2. With increasing distance from the CaF2 substrate, the intensity of the selenium band at 237 cm−1 increases, reaching a maximum value and then changing to a minimum again, whereas the intensity of Raman peaks attributed to the cellular biomolecules was mostly unchanged. Furthermore, doxorubicin was observed within treated breast cancer cells ( and ). The colour-coded images in show the overlapping of cytoplasm (green), LDs (yellow), doxorubicin (blue) and selenium (red). Co-localization of selenium with doxorubicin results in violet colour (superposition of red and blue). The same location of LDs, selenium and doxorubicin displays the white colour as a superposition of red, blue and yellow. The images in and reveal that doxorubicin and selenium distributions were not identical, which suggests that doxorubicin and/or selenium were released from the nanocapsules in the intracellular medium.
Figure 7. Interiorization of NSC-DOX NPs in 4T1 cells. (a) Raman x–y area imaging of protein/lipid distributions displaying the uptake pattern of NCS-DOX in cytoplasm; white line indicates the range of x-coordinate in the x–z depth scan. (b) The color-coded image (left) of an x–z depth scan represents the overlapping of cytoplasm, lipids and selenium (right) within a single cell. (c) Raman spectra collected at different z-positions along the blue line (image b) (color figure online).
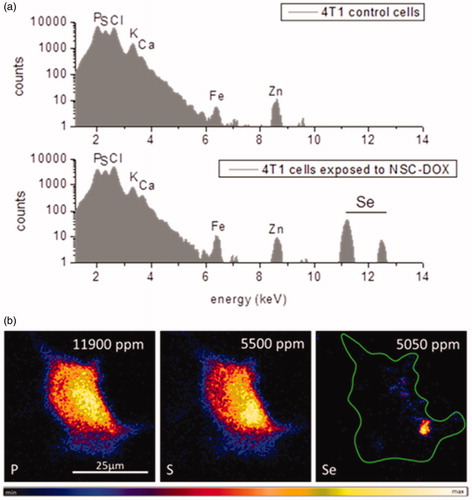
The cellular localization of selenium in treated 4T1 cells was further shown by IBM investigations. µPIXE spectra in , reveal that 4T1 cells exposed to NCS-DOX NPs had clearly shown X-ray emission of selenium. However, control breast cancer cells did not exhibit the characteristic Kα and Kβ X-ray lines of selenium at 11.2 and 12.5 KeV. shows the distribution pattern of cellular elements (P, S) as well as selenium, by means of µPIXE, after 6 h of NCS-DOX treatment. Phosphor and sulphur, as main components of lipid membranes, genetic information and proteins, were mapped to visualize single 4T1 cells. NCS-DOX were visualized by means of Se-element tracing within the cell. Selenium showed a rather inhomogeneous distribution within the cell boundaries of 4T1 cells and was found preferentially in the cellular region with high phosphor content. It could be assumed that accumulations of selenium were mainly found in close vicinity to the nucleus, because locally increased amount of phosphor denotes the nuclear region in the µPIXE image. This finding correlates well with CRM data observing NCS-DOX in the perinuclear region as well. Quantification analyses of selenium in the 4T1 cells resulted in an absolute amount of 5050 ppm, which is comparable to the intrinsic cellular sulphur concentration.
Figure 8. Ion beam microscopy analyses: (a) µPIXE spectra of control cells and 4T1 cells exposed to NCS-DOX NPs over 6 h; characteristic K – X-ray lines of the cellular elements and selenium element are labelled. (b) µPIXE images of phosphor, sulphur and selenium distribution pattern in a 4T1 cell exposed to NCS-DOX NPs over 6 h; the green line denotes the selected region of interest (color figure online).
The change in DOX subcellular location is a noteworthy finding, as it may affect its efficiency, efficacy, and safety and even alter its mechanism of action [Citation21,Citation22]. The inhibition of the mitochondrial topoisomerase II or the induction of mitochondrial oxidative stress, for instance, might lead to disruption in the function of this organelle to an extent that is not observed with free DOX treatment. Moreover, the intracellular co-delivery of DOX and selol suggests that these compounds might be synergically/additively cytotoxic. To test the cytotoxicity of NCS-DOX, the viability of 4T1 cells treated with NCS-DOX and DOX was verified in vitro (). The IC50 values for NCS-DOX, Pol-DOX and DOX were 0.37, 0.42 and 0.71 µg DOX/mL, respectively, showing that the toxicity of NCS-DOX was almost twice that of DOX alone. Nanocapsules of selol without DOX (NCS) exhibited only a slight effect on the viability of 4T1 cells. Thus, these results suggest that DOX and selol, combined in NCS-DOX, acted in a synergic/additive manner against 4T1 cells in vitro. NCS-DOX, Pol-DOX and DOX were also toxic for non-cancerous, NIH-3T3 cells, showing that none of these treatments were significantly selective to cancerous cells in vitro. The PVM/MA alone had no significant effect on the viability of the tested cells (data not shown).
Figure 9. Effects of treatments on the viability and adhesion of NIH-3T3 and 4T1 cells: (a) viability of cells exposed to NCS-DOX (nanocapsules containing selol and doxorubicin), NCS (nanocapsules of selol), Pol-DOX (only PVM/MA conjugated to doxorubicin) and DOX (doxorubicin alone) for 48 h, evaluated by the MTT method. (b) Cell adhesion indexes of NIH-3T3 and 4T1 cells continuously monitored in real time for 72 h; cells were treated at 24 h with NCS-DOX, NCS, Pol-DOX or DOX at concentrations equivalent to 1 μg DOX/mL. The control was exposed only to the culture medium. Data are expressed as mean ± standard error of the mean.
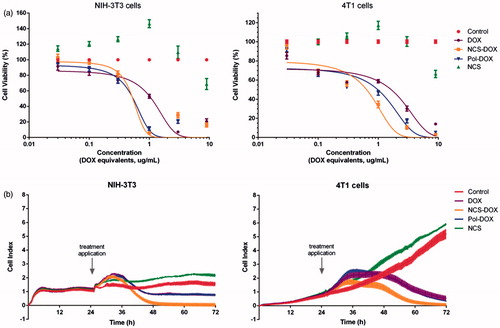
The results of the cell index measured at real time show a pattern similar to the cytotoxicity verified by MTT test. As shown in , the cell index of 4T1 cells treated with NCS-DOX stopped to increase at about 36 h and started to consistently decrease 6 h later. In comparison to NCS-DOX, Pol-DOX and DOX affected the cell index with a similar pattern, but less intensely. Interestingly, NCS did not reduce the proliferation of 4T1 cells.
NCS-DOX also induced a significant increase in ROS production, while DOX did not affect this parameter, in 4T1 cells both at 3 and 24 h of treatment (Figure S3(A), supplementary information). This result is probably due to two factors: 1) the more intense interiorization of NCS-DOX in comparison to DOX alone and 2) the preferential accumulation of NCS-DOX in the mitochondria, as suggested by previous reports [Citation18,Citation23]. Mitochondria are particularly sensitive to oxidative stress, and severe alterations in their function are eventually followed by disturbances in Δψm and by the triggering of apoptosis [Citation24]. As Figure S3(B) (supplementary information) shows, all the treatments induced depolarization of the mitochondrial membrane relative to control (non-treated).
Evidences of apoptosis were also found. A statistically significant difference for the occurrence of late apoptosis in cells treated with DOX or NCS-DOX was found (Figure S4). This result suggests that the combination of DOX and selol increases the apoptosis-inducing activity of the system. Previous studies have also shown that the combination of selenium compounds with a second anticancer agent (e.g. paclitaxel) favours the triggering of pro-apoptotic mechanisms and the inhibition of cell proliferation [Citation25].
Conclusions
This study demonstrates that NCS-DOX co-delivered DOX and selol into 4T1 cells in vitro, showing to be more cytotoxic than free DOX against this cancer cell line. Also, these nanocapsules altered the subcellular fate of DOX in 4T1 cells, from the nuclei to the mitochondria. This was paralleled by an increased activity of NCS-DOX against 4T1 cells in comparison to free DOX. Thus, the NCS-DOX have to be further studied regarding its potential use as a clinical agent for combinatorial chemotherapy.
Supplementary_material.docx
Download MS Word (326.5 KB)Disclosure statement
No potential conflict of interest was reported by the authors.
Additional information
Funding
References
- Mirza AZ, Shamshad H. Preparation and characterization of doxorubicin functionalized gold nanoparticles. Eur J Med Chem. 2011;46:1857–1860.
- Lince F, Bolognesi S, Stella B, et al. Preparation of polymer nanoparticles loaded with doxorubicin for controlled drug delivery. Chem Eng Res Des. 2011;89:2410–2419.
- Namdari M, Eatemadi A. Cardioprotective effects of curcumin-loaded magnetic hydrogel nanocomposite (nanocurcumin) against doxorubicin-induced cardiac toxicity in rat cardiomyocyte cell lines. Artif Cells Nanomed Biotechnol. 2017;45:731–739.
- Xi L, Zhu S-G, Das A, et al. Dietary inorganic nitrate alleviates doxorubicin cardiotoxicity: mechanisms and implications. Nitric Oxide. 2012;26:274–284.
- Gaumet M, Vargas A, Gurny R, et al. Nanoparticles for drug delivery: the need for precision in reporting particle size parameters. Eur J Pharm Biopharm. 2008;69:1–9.
- Cheng T, Liu J, Ren J, et al. Green tea catechin-based complex micelles combined with doxorubicin to overcome cardiotoxicity and multidrug resistance. Theranostics. 2016;6:1277–1292.
- Lv L, Qiu K, Yu X, et al. Amphiphilic copolymeric micelles for doxorubicin and curcumin co-delivery to reverse multidrug resistance in breast cancer. J Biomed Nanotechnol. 2016;12:973–985.
- Suchocki P, Misiewicz I, Skupinska K, et al. The activity of Selol in multidrug-resistant and sensitive human leukemia cells. Oncol Rep. 2007;18:893–899.
- de Souza LR, Muehlmann LA, Dos Santos MSC, et al. PVM/MA-shelled selol nanocapsules promote cell cycle arrest in A549 lung adenocarcinoma cells. J Nanobiotechnol. 2014;12:1–17.
- de Souza LR, Muehlmann LA, Matos LC, et al. Antitumor activity and systemic effects of PVM/MA-shelled selol nanocapsules in lung adenocarcinoma-bearing mice. Nanotechnology. 2015;26:505101.
- Mosmann T. Rapid colorimetric assay for cellular growth and survival: application to proliferation and cytotoxicity assays. J Immunol Methods. 1983;65:55–63.
- Longo JPF, Muehlmann LA, Miranda-Vilela AL, et al. Prevention of distant lung metastasis after photodynamic therapy application in a breast cancer tumor model. J Biomed Nanotechnol. 2016;12:689–699.
- Conway MA, Madrigal-estebas L, Mcclean S, et al. Protection against Bordetella pertussis infection following parenteral or oral immunization with antigens entrapped in biodegradable particles: effect of formulation and route of immunization on induction of Th1 and Th2 cells. Vaccine. 2001;19:1940–1950.
- Muehlmann LA, Ma BC, Longo JPF, et al. Aluminum-phthalocyanine chloride associated to poly(methyl vinyl ether-co-maleic anhydride) nanoparticles as a new third-generation photosensitizer for anticancer photodynamic therapy. Int J Nanomedicine. 2014;9:1199–1213.
- Guhagarkar SA, Gaikwad RV, Samad A, et al. Polyethylene sebacate-doxorubicin nanoparticles for hepatic targeting. Int J Pharm. 2010;401:113–122.
- Beljebbar A, Sockalingum GD, Angiboust JF, et al. Comparative FT SERS, resonance Raman and SERRS studies of doxorubicin and its complex with DNA. Spectrochim Acta Part A Mol Spectrosc. 1995;51:2083–2090.
- Liang L, Huang D, Wang H, et al. In situ surface-enhanced raman scattering spectroscopy exploring molecular changes of drug-treated cancer cell nucleus. Anal Chem. 2015;87:2504–2510.
- Chamberlain GR, Tulumello DV, Kelley SO. Targeted delivery of doxorubicin to mitochondria. ACS Chem Biol. 2013;8:1389–1395.
- Notingher I, Verrier S, Haque S, et al. Spectroscopic study of human lung epithelial cells (A549) in culture: living cells versus dead cells. Biopolymers. 2003;72:230–240.
- Movasaghi Z, Rehman S, Rehman IU. Raman spectroscopy of biological tissues. Appl Spectrosc Rev. 2007;42:493–541.
- Biswas S, Torchilin VP. Nanopreparations for organelle-specific delivery in cancer. Adv Drug Deliv Rev. 2014;66:26–41.
- Joanitti GA, Ganassin R, Rodrigues MC, et al. Nanostructured systems for the organelle-specific delivery of anticancer drugs. Mini Rev Med Chem. 2017;17:224–236.
- Vakili MR, Abyaneh HS, Molavi O, et al. Mitochondrial delivery of doxorubicin via triphenylphosphine modification for overcoming drug resistance in MDA-MB-435/DOX cells Mitochondrial delivery of doxorubicin via triphenylphosphine modification for overcoming drug resistance in MDA-MB-435/DOX. Mol Pharm. 2014;11:2640–2649.
- Mizutani H, Tada-Oikawa S, Hiraku Y, et al. Mechanism of apoptosis induced by doxorubicin through the generation of hydrogen peroxide. Life Sci. 2005;76:1439–1453.
- Qi Y, Fu X, Xiong Z, et al. Methylseleninic acid enhances paclitaxel efficacy for the treatment of triple-negative breast cancer. PLoS One. 2012;7:e31539.