
 ?Mathematical formulae have been encoded as MathML and are displayed in this HTML version using MathJax in order to improve their display. Uncheck the box to turn MathJax off. This feature requires Javascript. Click on a formula to zoom.
Abstract
Purpose
The aim of the study to formulate and statistically optimize sitagliptin-loaded eudragit nanoparticles (SIT-NPs) and evaluate the in-vitro pharmaceutical quality and in-vivo anti-diabetic assessment.
Method
SIT-NPs were prepared by using combination method of solvent evaporation and nano-precipitation techniques. The influence of different independent variables as eudragit RL100 concentration (%), tween 80 concentration (%) and sonication time (min) were evaluated on dependent variables like particle size (nm), drug loading (%) and in-vitro drug release (%). Further, the optimized formulation was evaluated for surface morphology, CLSM, ex-vivo permeation study and in-vivo anti-diabetic activity and stability study.
Results
The developed SIT-NPs formulations showed particle size range (135.86–193.45 nm), drug loading (6.36–8.76%) and prolonged drug release over 24 h. The prepared SIT-NPs were found to be nearly spherical with smooth surface. The comparative in-vitro release study and CLSM study results revealed that SIT-NPopt showed significantly (p < .05) enhanced release and permeation as compared to SIT free solution (SIT-Fs). The in-vivo anti-diabetic assessment revealed that SIT-NPopt able to reduce the blood sugar level (BSL) for a prolonged period of time. Further, the stability study data showed the formulations were found stable at both temperature and having the shelf life of 488 d.
Conclusions
This research has shown that SIT-NPs based on experimental design offers a new and better approach to delivering SIT, thus encouraging further development of this formulation.
Introduction
Diabetes is a complex set of metabolic disorder which has taken a radical increase affecting people of all age groups in the recent times. Type 2 diabetes is the commonest form and it developed when the body suffers from impaired ability to use insulin [Citation1]. The conventional medications are mostly administered through the per oral route and come up with extrapyramidal side effects like hypoglycemia, weight gain, gastric intolerance, safety and efficacy issue. Thus, novel drug delivery systems are being developed and studied by researchers around the globe.
Sitagliptin (SIT) is a FDA approved drug which falls under the class of DPP-4 inhibitors. It efficiently reduces HbA1c and fasting glucose level in patients with type 2 diabetes [Citation2]. There are number of formulation of SIT has been reported as mucoadhesive microsphere [Citation3], and concluded with improved gastric retention time of drug. SIT has also been formulated as bilayered tablets in combination with simvastatin [Citation4], as trilayered tablets in combination with metformin [Citation5] and gastro-retentive floating tablets [Citation6].
One of the most attractive areas of research in the oral drug delivery system is the development of nano sized delivery systems that are able to deliver drugs to the right place, at appropriate time, and at the right dose [Citation7]. There are several nano delivery systems like liposomes, nanoparticle, nanoemulsion and niosomes have designed to enhance the oral application of many drugs. Among above approaches, polymeric nano formulations have been explored to enhance the oral bioavailability of many drugs [Citation8–11]. It is an attractive vehicle in delivery systems due to their inherent stability in the GIT compared to other colloidal carriers. Recently, pH sensitive Eudragit® of different grades is widely used as polymer for formulation of nanoparticulate carriers for oral drug delivery system [Citation12,Citation13]. It is insoluble at physiological pH and capable of swelling, which represents a good material for drug dispersion [Citation11]. The selection of Eudragit® was based on its capability to form nano dispersions with submicron particle size, good stability, form release controlling film and used for the formulation of controlled and sustained release dosage forms [Citation14]. It can protect encapsulated drugs against the harsh environment of the GIT and also enhance their transmucosal transport. On account of their mucoadhesive properties, high permeability and sustained release, it appears to be a potential oral nanocarrier to improve the bioactivity, efficacy and safety.
There are number of eudragit based formulations have been reported to improve the efficacy of dosage form. The different eudragit based dosage form are metformin hydrochloride nanoparticle [Citation8], levofloxacin hemihydrate nanoparticles [Citation15], silymarin nanoparticle [Citation11], glimepiride nanosuspension [Citation16] acyclovir nanoparticle [Citation17], insulin nanoparticle [Citation18] have been explored and shown promising sustained release effects. The dose reduction could be a possible with nanoparticle formulation approach for overcoming these adverse effects. The statistical optimization technique involves designing a set of experimental study that will reliably measure the response variables, fitting a mathematical model to the data, and determining the optimum value of independent variables that produce the best possible formulation and model [Citation19]. In academic and industrial milieu, the role of design of experiments (DoE) has become a routine practice across the world. This statistical approach of optimization based on the salient principles of DoE and quality by design (QbD). It gives rational understanding of the plausible interaction(s) among the variables and helps in selecting “the optimized” formulation in comparison to the traditional one factor at a time (OFAT) approach [Citation20]. There are many experimental studies have been carried out by our group on diverse nano sized delivery systems for various diseases like using the experimental design approach. The disease like arthritis [Citation21], hypertension [Citation22,Citation23], diabetes [Citation24,Citation25], cancer [Citation26], analgesic [Citation27], schizophrenia [Citation28,Citation30], have vouched the utility of these delivery systems through different routes.
For the selected drug, SIT, no literature report is available on development of polymeric nanoparticle for the enhancement of efficacy using formulation design approach. The current research work explored the feasibility of eudragit nanoparticle as a carrier for the oral delivery of SIT. The developed formulations were optimized using statistical design and evaluated for the particle size, morphology, drug loading, in-vitro drug release, confocal laser scanning microscopy, ex-vivo permeation study, anti-diabetic activity and stability study.
Materials and methods
Materials
SIT was kindly gifted by Optimus Company (Secunderabad, India), Eudragit® RL 100, Tween 80, was taken from S. D Fine Chemicals (New Delhi, India). HPLC grade methanol, and acetonitrile were purchased from Merck, Mumbai, India. HPLC-grade water was obtained from a Milli-Q water purification system (Millipoire, MA). All other chemicals and solvents were of analytical grade.
Statistical design
The statistical experimental design (Box–Behnken Design-Expert version 9.0.1; Stat-Ease, Inc., Minneapolis, MN) was employed to optimize the formulations. The study used three factors; three levels design to investigate the effect of independent variables on the dependent variables [Citation28]. The different levels of independent variables A = eudragit RL100 concentration (% w/v), B = tween 80 concentration (%w/v), C = sonication time (minute) were taken for formulation development. The coded levels of independent variables used were +1 (high), 0 (medium) and −1 (low) as shown in . The effect of these factors was observed on dependent variables [Y1 = Particle size (nm), Y2 = drug loading, Y3 = drug release (%)] depicted in . The design showed three optimum checkpoint formulations to validate the chosen experimental domain. The design matrix showed computer generated quadratic model and construct the nonlinear polynomial equation given as
Table 1. Process variables and their levels for experimental design.
Table 2. Experimental runs obtained from Box–Behnken design and their observed value of particle size (Y1), drug loading (Y2) and %drug release (Y3).
where Y is the response associated with each factor; A0 is constant; A1, A2, A3 is linear coefficients, A12, A13, A23 is interaction coefficients between the three factors, A11, A22, A33 is quadratic coefficients. The responses were statistically evaluated using ANOVA and further, the optimum formulation was selected by the numerical optimization procedure using the desirability function. The design gives 3D response surface images of taken factors and intensive grid search was performed over the whole experimental region. The resultant experimental values of the responses were quantitatively compared to that of the predicted values.
Preparation of SIT nano-particles
Nanoparticles containing sitagliptin was prepared using combined technique of solvent evaporation and nanoprecipitation technique with slight modification [Citation11]. The formulation was done in two-step, initially; emulsification step was done between the organic polymer solution into aqueous surfactant solution. Further, in second step, evaporation of organic solvent is carried out, lead to polymer precipitation and formation of nanoparticles [Citation29]. The calculated quantities of eudragit and tween 80 and PVA (fixed concentration) were varied according to the experimental design approach as depicted in . Eudragit was dissolved in an organic solvent acetone (10 ml) and separately tween 80 dissolved in double distilled water. The organic solvent was added slowly to the aqueous phase containing tween 80 with a constant stirring on magnetic stirrer at room temperature. The evaporation of the organic solvent was performed at a temperature range of 65–80 °C which involves precipitation process lead to formation of nanoparticles. The obtained nanoparticle was ultrasonicated for different time interval (3–7 min) at 60–80 KHz amplitude) for 1 cycle and allowed to cool at room temperature. The developed SIT-NPs were lyophilized using the freeze dryer at a chamber pressure (20 pa) and cold trap temperature (−20 °C) in the entire process. The study was performed for 24 h for freezing, 4 h for primary drying at 0 °C, followed by 10 °C for 2 h and 15 °C for 1.5 h and secondary drying at 25 °C for 3 h. Mannitol (3%) was added as a cryoprotectant to avoid lysis of NPs [Citation26].
Characterization of SIT-NPs
Particle size and size distribution
The particle size and polydispersity index of all the formulations were determined by photon correlation spectroscopy (PCS) using a Zetasizer (Malvern 1000 HS, Malvern Instruments, Malvern, UK). One millilitre sample of SIT-NPs was diluted with double distilled water to get an appropriate concentration of particles to avoid multi-scattering events. The data was analysed at 25 °C and with a fixed light incidence angle of 90 °C. The polydispersity index (PDI) was determined as a measure of homogeneity and the ideal value should be in between (0.1 and 0.3). The smaller values of PDI indicate a homogeneous population, while greater values indicate high heterogeneity [Citation30].
Surface morphology
The surface morphology of the developed SIT-NPopt was determined to check the surface morphology of the developed SIT-NPopt. The sample was prepared by placing a drop of SIT-NPs on a copper grid and air-dried for 1 min. Afterward, the grid was kept inverted, and a drop of phototungstic acid (PTA) was applied for contrast enhancement. The excess of PTA was removed by absorption using filter paper, and the specimen was viewed under the microscope at 10–100 k-fold enlargements at an accelerating voltage of 100 kV morphology was studied [Citation23]. Further, the surface morphology of SIT-NPopt was also visualized by scanning electron microscopy. The lyophilized nanoparticles were taken and fixed on a double-sided sticky tape which had previously been secured on aluminium stubs and then coated with gold in an argon atmosphere. A combination of bright-field imaging at increasing magnifications and of diffraction modes was used to reveal the morphology of NPs. Finally, the images were captured and visualized by suitable software.
Atomic force microscopy
The morphology and surface texture was again confirmed by AFM for the analysis of NPs. The sample was prepared by taking a drop of SIT-NP on a glass slide. The excess of water was removed under reduced pressure and the analysis was performed at semi-contact mode by NT-MDT Solver instrument and for the data acquisition and the image was visualized using Nova SPM software (Novo Infotech, Hyderabad, India) [Citation31].
Drug loading
Drug loading (DL) of the developed SIT-NPs were determined as the amount of drug loaded (as a percentage) in relation to the solid phase and drug. A known volume of SIT-NPopt was transferred to centrifuge tubes fitted with an ultrafilter (Pall Life Sciences, Mumbai, India). The sample was centrifuged at 18,000g (Remi centrifuge, Mumbai, India) for 30 min, and the separated NPs were solubilized in appropriate medium and filtered through a 0.45 μm PTFE (polytetrafluoroethylene) membrane filter. The supernatant was collected and diluted with an appropriate solvent to analyse using UV-spectrophotometer (Shimadzu-1800, Japan). Consequently, the % drug loading was calculated by the following formula:
Drug release and release kinetics
The comparative drug release study of SIT-NPs and SIT-Fs were performed with activated dialysis bag technique (molecular weight 12,000–14,000 kDa) with slight modification from suggested methods [Citation32]. A known volume containing SIT in both the formulation was placed in a dialysis bag, and both ends were tied to prevent any leakage. The bag was dipped in 250 ml phosphate buffer saline (pH 7.4) as release media at 37 ± 2 °C with continuous stirring at 50 rpm [Citation26]. The release samples (1 ml) were withdrawn at predetermined time interval and were filtered through 0.2 µ membrane filter. The amount of drug release was analysed at different time point by calculating drug content using UV-spectrophotometer (Shimadzu-1800, Japan). The amount of drug release was incorporated into various release kinetic models, such as zero order model, first order model, Higuchi model, Hixon-crown model and Korsmeyer–Peppas model [Citation33]. The selection of the best fit model has been done from the regression coefficient (R2) value. The best fit model was further characterized by “n” value to know the mechanism of release pattern. These values were characterized for Fickian diffusion (0–0.5), non-Fickian diffusion (0.5–1.0), zero order (1) and super diffusion (>1), respectively, for spherical particles.
Ex-vivo permeation study
The comparative ex-vivo gut permeation study of the SIT-NPopt and SIT-FS was performed as per the reported method [Citation34]. Both the formulations (each containing 2 mg SIT) were filled in the mucosal side of the intestinal sac and were tightly ligated. The sac was dipped in a 100 ml Krebs solution and the beakers were kept on hot plate magnetic stirrer and the study was performed at 37 °C. The Kreb’s solution was continuously oxygenated with 95% Oxygen (O2) using an aerator. After specific time interval, 1 ml sample was collected at predetermined time interval and replaced with fresh Kreb’s solution to maintain sink condition. The collected samples were filtered through 0.2 μ membrane filter and amount of drug permeated was determined by HPLC method [Citation35]. The graph between the cumulative amounts of drug permeated vs. time was plotted and the slope was used to calculate as a permeation flux (F). The apparent permeability coefficient (APC) was calculated by the following equation:
where, f = permeation flux; A = surface area (7.85 cm2) of the membrane and C0 = initial concentration of the drug.
Confocal laser scanning microscopy (CLSM)
The small intestine (5 cm long) of rat was taken for the study. The animals were sacrificed; their intestine was collected and washed with Krebs’s solution to remove all food residues. 2 ml of rhodamine red dye (0.03% w/v) loaded SIT-NPopt and SIT-Fs were filled in the intestinal sac and ligated tightly. Both the intestinal sacs were stirred continuously (50 rpm at 37 °C) for 6 h in Krebs’s solution. Finally, the treated intestinal sac was cut longitudinally, taken out and washed with Krebs’s solution to remove excess dye. Both the intestinal sac was fixed on the slide and positioned under CLS microscope (Leica TC SPE-IIw, DMI 4000 RGBV Leica Microsystems, Germany). The image was taken using an argon laser beam excitation at 488 nm and emission at 532 nm. The depth of permeation was measured by Leica application suite Advance Fluorescence software [Citation34].
In-vivo anti-diabetic activity
Albino Wistar rats (100–150 g) were used as the animal models for anti-diabetic activity. The animals were supplied by animal house from Siddhartha Institute of pharmacy, Dehradun after the approval from Institutional Animal Ethics Committee, and Committee for the Purpose of Control and Supervision on Experiments on Animals (CPSCEA), Government of India. The used rats were housed under standard laboratory conditions in the 12-h light/dark cycle at 25 ± 2 °C provided with pellet diet (Lipton, Kolkata, India). Before treatment, STZ injection was injected in rats to induce diabetes [Citation36], and the initial blood sugar level was measured for all treated rats. The treated rats were divided into four groups (groups I–IV) of five animals each as Group I was referred as control group (received no treatment), Group II referred as diabetic control, Group III referred as SIT-Fs treated group (oral free solution) and Group IV received SIT-NPopt (same dose of group III) using oral feeding sonde. The rat was then placed in the restrainer and blood from the tail was taken on chip at different time interval and blood sugar level measured on digital glucometer.
Stability study and determination of shelf life
The stability study of the SIT-NPs was carried out as per guidelines given in the ICH Q1A (R2) (ICH topic Q1 (R2), 2009). The sample was stored at different temperature with humidity for a period of 6 months in stability chamber (Thermo lab: TH 90 S). The samples were withdrawn at predetermined time intervals (0, 30, 60, 90 and 180 d) and analysed for any change in the particle size, PDI, drug loading and encapsulation efficiency. Further, the graph was plotted between log% drug remaining vs. time (in days) to determine the degradation rate constant (K) where, slope of the curve was determined from the graph.
where K is the degradation rate constant.
The shelf life of SIT-NPs was calculated at 25 °C by calculating the time required to degrade 10% of the drug in the NP from the following equation.
where, t10% is the time required to degrade 10% of the drug in the NPs.
Statistical analysis
All the results obtained were expressed as mean ± SD using Graph Pad Software Instat version 3.06 (GraphPad Software, La Jolla, CA) with more than three replicates for each experiment. Comparisons were made by using Student’s t-test and the level of significance was set p < .05.
Result and discussion
Fitting data to model and validation
The developed SIT-NPs formulations were optimized using three levels, three factors Box–Behnken experimental design. The formulation was prepared by solvent evaporation and nano precipitation method using eudragit as polymer and tween 80 as surfactant. The response surface analysis was carried out to understand the effect of selected independent variables on the observed responses. The effect of eudragit concentration (A, %w/v), tween 80 concentration (B, %w/v) and sonication time (C, min) were selected as independent variables and their pronounced effect was observed on dependent variables [Y1 = particle size (nm) Y2 = drug loading, Y3 = drug release (%)] have been investigated and their kinetics were found to be quadratic in nature (p < .0001) with interaction terms. The mathematical relationships were established and coefficients of the second order polynomial equation generated using MLRA for all the above factors. A positive value in regression equation for a response represents an effect that favours the optimization (synergistic effect), whereas a negative value indicates an inverse relationship (antagonistic effect) between the factor and the response [Citation27].
A total of 15 experiments were performed and the selected independent variables were significantly influenced the observed responses, i.e. particle size (Y1= 122.66–194.45 nm), drug loading (Y2 = 6.36–8.76%) and drug release (Y3 = 61.45–84.56%) as shown in . The data of observed responses were fitted for different kinetic models and observed that the best-fitted model for all the dependent variables was found to be quadratic model. The kinetic model of three factors and their comparative values of R2, predicted R2, adjusted R2, SD and %CV are depicted in , and the “predicted R2” was in reasonable agreement with the “adjusted R2” values. On the basis of the response of the various dependent variables with respect to the composition of the independent variables, a formulation (SIT-NPopt) was selected as the optimized formulation for this study.
Table 3. Summary of regression analysis for responses [Y1 = particle size (nm), Y2 = drug loading (%), and Y3 = drug release (%)] for fitting to different kinetic models.
Effects of formulation variables on particle size (Y1)
The particle size is a very important criterion for the nano formulation, the size of the developed NPs was found to be varying between 122.66 and 194.45 nm. It was observed that the particle size has a direct positive relationship with the factors eudragit (A), tween 80 (B) and sonication time (C). The combined effect of these independent variables was found to be more significant in combination. This relationship is presented by the following equation
The interaction effect of independent variables on particle size is depicted on 3 D response surface plots and 2D contour plot (). The increase in eudragit concentration lead to significant increase in particle size, but tween 80 does not have any effect on the formulation. The increased size due to higher cross linking between eudragit and tween 80 takes place. Sonication time has shown significant positive effect on the particle size. The longer duration of sonication time lead to agglomeration of particle and forms larger particle.
Figure 1. (A–D) 3D-response surface plots and 2D contour plot showing the influence of independent variables [eudragit (%), tween 80 (%), and sonication time (minutes)] on particle size (nm) for the SIT-NPs.
![Figure 1. (A–D) 3D-response surface plots and 2D contour plot showing the influence of independent variables [eudragit (%), tween 80 (%), and sonication time (minutes)] on particle size (nm) for the SIT-NPs.](/cms/asset/bd529405-91ba-42b6-a734-12ec220e39a4/ianb_a_1411933_f0001_c.jpg)
Effects of formulation variables on drug loading (Y2)
The highest and lowest drug loading was found in the range of 6.36–8.76% for all the developed formulations. The all independent variables have shown their effect on the drug loading. The eudragit and tween 80 concentrations have shown negative effect whereas sonication time has shown positive effect. The mathematical relationship between independent variables on drug loading for NPs is given in the following equation:
The interaction effect of independent variables on drug loading is shown on 3D response surface plots and 2D contour plot (). It was found that with an increase in the concentration of eudragit and tween80, the drug loading is initially increased followed by gradual decrease in loading takes place. This behaviour was found due to the higher concentration of surfactant gives lesser space to accommodate the drug in NPs. Sonication time has not significant effect on loading.
Figure 2. (A–D) 3D-response surface plots and 2D contour plot showing the influence of independent variables [eudragit (%), tween 80 (%), and sonication time (minutes)] on drug loading (%) for the SIT-NPs.
![Figure 2. (A–D) 3D-response surface plots and 2D contour plot showing the influence of independent variables [eudragit (%), tween 80 (%), and sonication time (minutes)] on drug loading (%) for the SIT-NPs.](/cms/asset/5206b4fc-6ead-485c-80a0-6d083265d34b/ianb_a_1411933_f0002_c.jpg)
Effects of formulation variables on drug release (Y3)
The drug release from all developed formulations was found to be between 54.33 and 71.56%. The all independent variables have shown either positive or negative effect as independent or in combination on the drug release. The eudragit, tween 80 concentrations and sonication time have shown negative effect individually on drug release, whereas in combination eudragit and tween 80 blends has shown positive response whereas eudragit and sonication time combined have shown negative effect on release. The mathematical relationship between independent variables and drug release for NP is given in the following equation.
The 3D response surface plots image and 2D contour plot () shown parabolic type of graph which shows the effect of all three independent variables on drug release. In graph, it has been shown that as the concentration of eudragit and tween 80 increases the initial drug release will also increase. Further increase in both the concentration the drug release will significantly decrease. Increasing the sonication time was found to have a non-significant effect (p > .05) on drug release.
Figure 3. (A–D) 3D-response surface plots and 2D contour plot showing the influence of independent variables [eudragit (%), tween 80 (%), and sonication time (minutes)] on drug release (%) for the SIT-NPs.
![Figure 3. (A–D) 3D-response surface plots and 2D contour plot showing the influence of independent variables [eudragit (%), tween 80 (%), and sonication time (minutes)] on drug release (%) for the SIT-NPs.](/cms/asset/ac0c6a09-ed0e-48b3-8683-7c7f06f0c85a/ianb_a_1411933_f0003_c.jpg)
Point prediction optimization
The optimum formulation of SIT-NPopt system was selected based on the criteria of attaining the minimum particle size and maximum drug loading and release by applying the point prediction method of the Design Expert software [Citation37]. Upon “trading of” various response variables and comprehensive evaluation of feasibility search and exhaustive grid search, the formulation composition with eudragit concentration (3.62%), tween 80 concentration (3.94%) and sonication time (4.3 min) was found to fulfil requisites of an optimized formulation (SIT-NPopt) with particle size of 135.29 ± 5.12 nm, drug loading 8.78 ± 1.11% and drug release 84.81 ± 6.23%, respectively (). shows the quantitatively linear relationship between resultant experimental values of the responses with that of the predicted value of all dependents variables. Finally, the formulation SIT-NPopt was used further for in-vitro release mechanism, ex-vivo permeation study, confocal study and in-vivo anti-diabetic evaluation.
Figure 4. Predicted vs. actual plot showing the influence of independent variables [eudragit (%), tween 80 (%), and sonication time (minutes)] on dependent variables [particle size (nm), drug loading (%) and drug release (%)] for the SIT-NPs.
![Figure 4. Predicted vs. actual plot showing the influence of independent variables [eudragit (%), tween 80 (%), and sonication time (minutes)] on dependent variables [particle size (nm), drug loading (%) and drug release (%)] for the SIT-NPs.](/cms/asset/0e5fddb5-f98f-47fb-ad7b-9f8aba7e7189/ianb_a_1411933_f0004_c.jpg)
Table 4. Experimentally optimized value of formulation SIT-NPopt.
Particle size and PDI
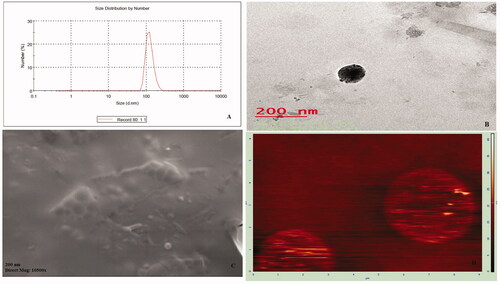
The least mean particle size was observed for SIT-NPs formulations for F11 (126.98 nm) while maximum particle size was obtained as 194.45 nm for F15 as shown in . The size of optimized formulation was found 148.66 nm as shown in . PDI is the measure of the heterogeneity of sizes of particles in the NPs. The value for all formulation were varies from 0.233 to 0.583 and indicating that the size distribution of formulated the particles was quite narrow [Citation25]. The smaller value of PDI is highly desirable in order to have the uniform size distribution in the formulations.
Figure 5. (A–D) Images of SIT-NPopt: (A) Particle size distribution image; (B) Transmission electron micrograph; (C) Scanning electron micrograph; (D) Atomic force microscopy.
Drug-loading
The drug loading of SIT-NPs formulations were vary between 6.36% ± 0.67 and 8.76% ± 1.6 (). It is clear that drug loading in developed formulations produces higher load for all formulations. This may be attributed to complete solubility of SIT in tween 80 which in turn leads to enough space to load drug molecules, thus leading to enhanced drug loading [Citation32]. Concerning hydrophilic surfactant, tween 80 displayed a higher drug loading due to the physical and chemical compatibilities (affinity, miscibility) between the drug and polymer complexes.
Surface morphology
The surface morphology of SIT-NPopt was taken by TEM and SEM method, and the images are depicted in . The result of the both image revealed that the developed particles were found with solid dense structures, almost spherical in shape with regular morphology. There was no aggregation and agglomeration of particles observed in both micrograph.
Atomic force microscopy
The image of atomic force microscopy () further confirmed surface morphology of the SIT-NPopt. The image showed almost spherical particles with smooth surface of the NPs. The particles were separated from each other, which proved that there was no aggregation in the particles. The image was also on corroboration with particle size measurements. The nanoparticles observed with smooth surface, which may contribute to its release of the drug in a sustained manner when compared to the nanoparticles having rough surface.
In-vitro release study
The comparative cumulative SIT release from both the formulations (SIT-NPopt and SIT-Fs) with respect to time is illustrated in . The significant difference in the drug release was achieved from the SIT-NPs and SIT-Fs (p < .05). The SIT-NPs showed biphasic drug release pattern with about 45% of the drug released during the first 4 h then about 80–85% of the drug was released around 24 h, whereas SIT-Fs showed about 90% of release during the first 2 h. The developed formulation SIT-NPs showed initial burst release due to free non-entrapped drug and/or adsorbed drug to the surface of the nanoparticles. The results also indicated that the drug release from SIT-NPs was greatly decreased as the eudragit concentration was increased. These results might be due to the increase in the polymer concentration resulted in an increase in the thickness of the NPs coting which leads to an increase in the pathway length for the drug to reach to the surface of the nanoparticles [Citation38]. The in-vitro release studies reveal that the amount of drug release is increased as the concentration of the tween 80 is increased. This is due to the increase in the penetration of diffusion medium to the nanoparticles as the concentration of surfactant increased which leads to the higher wettability of the drug [Citation39]. Also, the increase in the amount of drug released with increasing the concentration of surfactant might be attributed to the fact that particle size of nanoparticles decreased as the surfactant concentration increased thereby free drug on nanoparticles surface is easily available for release [Citation40]. The SIT-NPopt was fitted to different kinetic analysis to determine the release mechanism. The correlation coefficients obtained after fitting the in-vitro release data to the respective model equations. The best fit model was determined on the basis of regression coefficient (R2) value. The observed best fit model was Higuchi model (R2 = 0.925) followed by first order release model (R2 = 0.911) and the values for tested models are presented in . The obtained value for the developed SIT-NPopt showed n = 0.298 value so the release behaviour found to be of Fickian diffusion.
Figure 6. Comparative in-vitro drug release profile of SIT-NPopt and SIT-Fs.
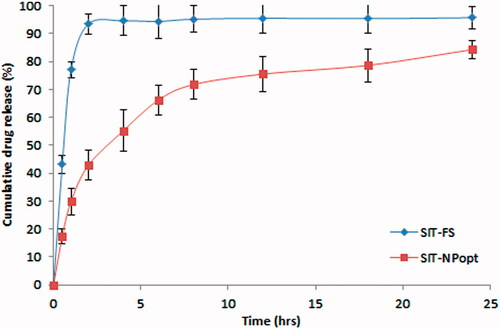
Table 5. In vitro release kinetics data to different mathematical models for SIT-NPopt and SIT-fs.
Ex-vivo permeation study
The comparative ex-vivo permeation study showed more than 3.11 folds increment in the permeation of the SIT from SIT-NPopt in compare to SIT-Fs in the same experimental conditions. This result leads to improvement in the oral efficacy of the SIT by formulating into NPs. The APC for the SIT-Fs and SIT-NPopt were found to be 0.256 × 10⁻⁴ cm/min and 0.834 × 10⁻⁴ cm/min, respectively. The increase in the SIT permeation was due to the reduction of particle size along with the presence of tween 80 as surfactants in NPs leads to enhance in the permeability of the drug from the intestine. The use of surfactant blend in the SIT-NPs formulation not only provides stability but also mitigate intestinal efflux by inhibition of P-gp efflux pumps which are present in the villus tip of enterocytes in the gastrointestinal tract [Citation41].
Confocal laser scanning microscopy (CLSM)
The comparative CLSM study between rhodamine red (RR) loaded SIT-NPopt and SIT-Fs was performed to check the penetration depth. The result of the study revealed that RR loaded SIT-NPopt formulation was uniformly distributed to a greater extent throughout the intestinal region with high fluorescence intensity which confirms enhanced penetration as compared to RR loaded SIT-Fs (Image not shown). The specific darkening of the intracellular spaces using the dye into the NPs has proven that the higher permeation principally occurs by transcellular transport. The enhanced permeation was found due to presence of tween 80 and eudragit which prolong the contact time with the intestinal lipids. So, NPs were able to enhance the penetration of a relatively large quantity of the probe deeply and may play an important role in promoting drug absorption.
In-vivo anti-diabetic activity
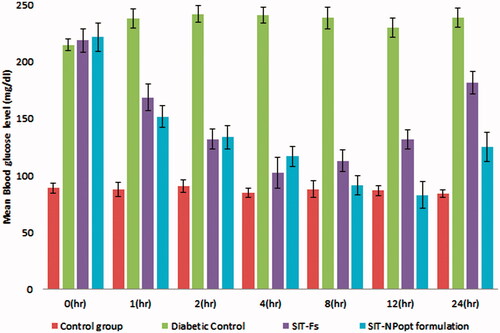
The blood sugar level (BSL) was checked for all groups at different time interval to examine the effect of treatment on increased BSL shows in . At 0 h, both the treated groups except normal control group showed a significant increase in blood sugar level. There was significant decrease in BSL was achieved in both treated group than the diabetic control group. The reduction in BSL was achieved with group III and group IV, and the result between these two groups showed significant decrease in BSL in SIT-NPopt as compared to SIT-Fs fed rats (p < .001). The lowest BSL attained by the SIT-NPopt treated group (98.87 mg) at 12 h whereas; the SIT-Fs treated group showed reduction in BSL for 4 h only (104.55 mg). The SIT-NPopt treated group showed prolonged reduction in BSL and there effect last for 24 h, whereas the BSL of SIT-Fs treated group showed gradual increase after 4 h. After 12 h, the BSL of SIT-NPopt treated group still remained below the hyperglycemic level, whereas in other groups BSL came back to the diabetic state. The result of this study clearly showed that it is a good oral carrier for absorption of loaded drug and indicates superiority of NPs as compared to conventional oral dosage forms, and thus validates the rationale behind the study.
Figure 7. Comparative In-vivo antidiabetic activity profile of different treated groups on animal model.
Stability studies according to ICH Q1A
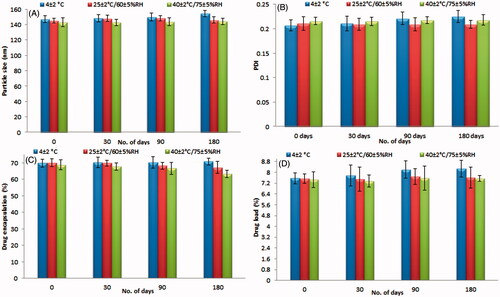
The stability study was conducted based on the ICH-guidelines. The formulated SIT-NPopt formulation was found to be fairly stable for a period of six months. The particle size, PDI drug loading and encapsulation efficiency does not showed major variation during the storage at different temperature. The initial and at different time interval results after 0, 30 , 90 and 180 d of the stability study were shown in . The result revealed that there is no significant (p > .05) difference was observed which proved the stability of the NP. There was no phase separation found in the formulation over storage. The degradation rate constant and shelf life for SIT-NPopt were calculated at 25 °C. The degradation rate constant and shelf life for the SIT-NPopt was found to be <5% (0.821 × 10⁻⁴) and 583 d, respectively.
Figure 8. (A–D) Effect of different temperature with humidity on the stability study data of SIT-NPopt.
Conclusions
The design and preparation of SIT-NPs is a new and exciting field of research that seeks to exploit the attractive properties of nano carriers to improve the delivery of therapeutic molecules. SIT-loaded eudragit® nanoparticles were successfully formulated by solvent evaporation and nano precipitation techniques. The all prepared SIT-NPs possess better in-vitro characteristics in compare to SIT-Fs. This study concludes that the SIT-NPopt is a suitable candidate to produce sustained and prolonged action. It also provided evidence on the ability of SIT-NPopt formulation to effectively enhance the permeation across intestinal mucosa. This nano-formulation, via oral route of administration, was successful in reducing the elevated blood sugar level. However, further preclinical and clinical studies are important to support these results.
Acknowledgements
Authors are thankful to AIIMS for TEM study and AMITY University for SEM study.
Disclosure statement
All authors have approved the final manuscript, and the authors declare that they have no conflicts of interest to disclose.
References
- Jahangir MA, Imam SS, Kazmi I, et al. Type 2 diabetes current and future medications: a short review. Int J Pharm Pharmacol. 2017;1:101.
- Herman GA, Bergman A, Liu F, et al. Pharmacokinetics and pharmacodynamic effects of the oral DPP-4 inhibitor sitagliptin in middle-aged obese subjects. J Clin Pharmacol. 2006;46:876–886.
- Harsha S, Attimard M, Khan TA, et al. Design and formulation of mucoadhesive microspheres of sitagliptin. J Microencapsul. 2013;30:257–264.
- Prasanthi S, Prasad AR, Kumar YG, et al. Formulation and evaluation of sitagliptin phosphate and simvastatin bilayered tablets. Indo Am J Pharm Res. 2015;5:2231–6876.
- Maringanti PS, Nalagonda C. Formulation and evaluation of sitagliptin phosphate and metformin hydrochloride trilayered tablets. Int J Drug Deliv. 2013;5:15.
- Keerthi K, Kothamasu A, Makineni SN, et al. Formulation and evaluation of sitagliptin phosphate gastro retentive tablets. Carib J Sci Tech. 2014;2:270–281.
- Patil GB, Patil ND, Deshmukh PK, et al. Nanostructured lipid carriers as a potential vehicle for Carvedilol delivery: application of factorial design approach. Artif Cells Nanomed Biotechnol. 2016;44:12–19.
- Cetin M, Atila A, Sahin S, et al. Preparation and characterization of metformin hydrochloride loaded-Eudragit® RSPO and Eudragit® RSPO/PLGA nanoparticles. Pharm Dev Technol. 2013;18:570–576.
- Jafari-Aghdam N, Adibkia K, Payab S, et al. Methylprednisolone acetate–Eudragit® RS100 electrospuns: preparation and physicochemical characterization. Artif Cells Nanomed Biotechnol. 2016;44:497–503.
- Garjani A, Barzegar-Jalali M, Osouli-Bostanabad K, et al. Morphological and physicochemical evaluation of the propranolol HCl–Eudragit® RS100 electrosprayed nanoformulations. Artif Cells Nanomed Biotechnol. 2017 [Jun 6];[8 p.]. DOI:https://doi.org/10.1080/21691401.2017.1337027
- Younis N, Shaheen MA, Abdallah MH. Silymarin-loaded Eudragit® RS100 nanoparticles improved the ability of silymarin to resolve hepatic fibrosis in bile duct ligated rats. Biomed Pharmacother. 2016;31:93–103.
- Elshafeey AH, Kamel AO, Awad GA. Ammonium methacrylate units polymer content and their effect on acyclovir colloidal nanoparticles properties and bioavailability in human volunteers. Colloids Surf B Biointerfaces. 2010;75:398–404.
- Kumar N, Chaurasia S, Patel RR, et al. Atorvastatin calcium encapsulated eudragit nanoparticles with enhanced oral bioavailability, safety and efficacy profile. Pharm Dev Technol. 2017;22:156–167.
- Wadher KJ, Nagarkar A, Sahare D, et al. Formulation and evaluation of sustained release ciprofloxacin hydrocloride microspheres using synthetic polymers. Int J Pharm Tech Res. 2013;5:773–780.
- Hasan AA, Sabry SA, Abdallah MH, et al. Formulation and in vitro characterization of poly(dl-lactide-co-glycolide)/Eudragit RLPO or RS30D nanoparticles as an oral carrier of levofloxacin hemihydrate. Pharm Dev Technol. 2016;21:655–663.
- Yadav SK, Mishra S, Mishra B. Eudragit-based nanosuspension of poorly water-soluble drug: formulation and in vitro-in vivo evaluation. AAPS PharmSciTech. 2012;13:1031–1044.
- Gandhi A, Jana S, Sen KK. In-vitro release of acyclovir loaded Eudragit RLPO(®) nanoparticles for sustained drug delivery. Int J Biol Macromol. 2014;67:478–482.
- Zhang Y, Wu X, Meng L, et al. Thiolated Eudragit nanoparticles for oral insulin delivery: preparation, characterization and in vivo evaluation. Int J of Pharm. 2012;436:341–350.
- Malakar J, Sen SO, Nayak AK, et al. Formulation, optimization and evaluation of transferosomal gel for transdermal insulin delivery. Saudi Pharm J. 2012;20:355–363.
- Singh B, Kumar R, Ahuja N. Optimizing drug delivery systems using systematic ‘‘design of experiments.’’ Part I: fundamental aspects. Crit Rev Ther Drug Carrier Syst. 2005a;22:27–105.
- Jamal M, Imam SS, Aqil M, et al. Transdermal potential and anti-arthritic efficacy of ursolic acid from niosomal gel systems. Int Immunopharmacol. 2015;29:361–369.
- Qumbar M, Ameeduzzafar Imam SS, et al. Formulation and optimization of lacidipine loaded niosomal gel for transdermal delivery: in-vitro characterization and in-vivo activity. Biomed Pharmacother. 2017;93:255–266.
- Qadri GR, Ahad A, Aqil M, et al. Invasomes of isradipine for enhanced transdermal delivery against hypertension: formulation, characterization, and in vivo pharmacodynamic study. Artif Cells Nanomed Biotechnol. 2017;45:139–145.
- Prasad PS, Imam SS, Aqil M, et al. QbD-based carbopol transgel formulation: characterization, pharmacokinetic assessment and therapeutic efficacy in diabetes. Drug Deliv. 2016;23:1047–1056.
- Alam S, Aslam M, Khan A, et al. Nanostructured lipid carriers of pioglitazone for transdermal application: from experimental design to bioactivity detail. Drug Deliv. 2016;23:601–609.
- Khan A, Imam SS, Aqil M, et al. Brain targeting of temozolomide via the intranasal route using lipid-based nanoparticles: brain pharmacokinetic and scintigraphic analyses. Mol Pharm. 2016;13:3773–3782.
- Ahmed S, Imam SS, Ameeduzzafar, et al. In vitro and preclinical assessment of factorial design based nanoethosomes transgel formulation of an opioid analgesic. Artif Cells Nanomed Biotechnol. 2016;44:1793–1802.
- Imam SS, Aqil M, Ahad A, et al. Formulation by design-based proniosome for accentuated transdermal delivery of risperidone: in vitro characterization and in vivo pharmacokinetic study. Drug Deliv. 2015;22:1059–1070.
- Reis CP, Neufeld RJ, Ribeiro AJ, et al. Nanoencapsulation I. Methods for preparation of drug-loaded polymeric nanoparticles. Nanomedicine. 2006;2:8–21.
- Imam SS, Aqil M, Ahad A, et al. Formulation by design based risperidone nano soft lipid vesicle as a new strategy for enhanced transdermal drug delivery: in-vitro characterization, and in-vivo appraisal. Mater Sci Eng C Mater Biol Appl. 2017;75:1198–1205.
- Ahmed S, Gull A, Alam M, et al. Ultrasonically tailored, chemically engineered and “QbD” enabled fabrication of agomelatine nanoemulsion; optimization, characterization, ex-vivo permeation and stability study. Ultrason Sonochem. 2018;41:213–226.
- Zhiwen Z, Huihui B, Zhiwei G, et al. The characteristics and mechanism of simvastatin loaded lipid nanoparticles to increase oral bioavailability in rats. Int J Pharm. 2010;394:147–153.
- Costa P, Lobo JMS. Modeling and comparison of dissolution profiles. Eur J Pharm Sci. 2001; 13:123–133.
- Paudel A, Ameeduzzafar Imam SS, Fazil M, et al. Formulation and optimization of Candesartan Cilexetil nano lipid carrier: in-vitro and In-vivo evaluation. Current Drug Deliv. 2017; 14:1005–1015.
- Rezk MR, Riad SM, Mahmoud GY, et al. Simultaneous determination of sitagliptin and metformin in their pharmaceutical formulation. J AOAC Int. 2013;96:301–306.
- Arora S, Ojha SK, Vohora D. Characterisation of Streptozotocin induced diabetes mellitus in Swiss albino mice. Glob J Pharm. 2009;3:81–84.
- Moghddam SMM, Ahad A, Aqil M, et al. Optimization of nanostructured lipid carriers for topical delivery of nimesulide using Box–Behnken design approach. Artif Cells Nanomed Biotechnol. 2017;45:617–624.
- Mallamma T, Bharathi DR, Lakshmi RG, et al. Etoposide-loaded nanoparticles made from poly-e-caprolactone (PCL): formulation characterization, in vitro drug release for controlled drug delivery system. Int J Biopharm. 2014;5:5–12.
- Abdallah MH. Box-behnken design for development and optimization of acetazolamide microspheres. Int J Pharm Sci Res. 2014;5:1228–1239.
- Nandy BC, Mazumder B. Formulation and characterizations of delayed release multi particulates system of indomethacin: optimization by response surface methodology. Curr Drug Deliv. 2014;11:72–86.
- Ahmad N, Amin S, Neupane YR, Kohli K. Anal fissure nanocarrier of lercanidipine for enhanced transdermal delivery: formulation optimization, ex vivo and in vivo assessment. Expert Opin Drug Deliv. 2014;11:467–478.