
Abstract
Vitamin A deficiency and mitochondrial dysfunction are both associated with neural differentiation-related disorders, such as Alzheimer’s disease (AD) and Down syndrome (DS). The mechanism of vitamin A-induced neural differentiation and the notion that vitamin A can regulate the morphology and function of mitochondria in its induction of neural differentiation through the RIP140/PGC-1α axis are unclear. The aim of this study was to investigate the roles and underlying mechanisms of RIP140/PGC-1α axis in vitamin A-induced neural differentiation. Human neuroblastoma cells (SH-SY5Y) were used as a model of neural stem cells, which were incubated with DMSO, 9-cis-retinoic acid (9-cis-RA), 13-cis-retinoic acid (13-cis-RA) and all-trans-retinoic acid (at-RA). Neural differentiation of SH-SY5Y was evaluated by Sandquist calculation, combined with immunofluorescence and real-time polymerase chain reaction (PCR) of neural markers. Mitochondrial function was estimated by ultrastructure assay using transmission electron microscopy (TEM) combined with the expression of PGC-1α and NEMGs using real-time PCR. The participation of the RA signaling pathway was demonstrated by adding RA receptor antagonists. Vitamin A derivatives are able to regulate mitochondrial morphology and function, and furthermore to induce neural differentiation through the RA signaling pathway. The RIP140/PGC-1α axis is involved in the regulation of mitochondrial function in vitamin A derivative-induced neural differentiation.
Introduction
Vitamin A is an essential nutrient for life in all chordates, provided by preformed vitamin A (primarily as retinyl ester) from animal sources, and by provitamin A carotenoids from plant sources [Citation1]. Vitamin A plays important roles in the development of the central nervous system (CNS) [Citation2], where it can induce the neurogenesis of embryonic CNS [Citation3]. Also, it is involved in various neural differentiation-related disorders such as Alzheimer’s disease (AD) and Down syndrome (DS). AD is the most common neurodegenerative disorder, while DS is mainly characterized as neural developmental delay. The serum level of vitamin A is reported to be lower in AD and DS patients [Citation4]. Vitamin A supplementation may be a novel therapeutic strategy for AD to reduce oxidative stress, which is associated with AD, and to inhibit the formation of amyloid β-protein [Citation2,Citation5]. Vitamin A deficiency during pregnancy can lead to low vitamin A levels in the fetal circulation, which is important knowing that vitamin A and its derivatives are determinants of early brain development and neuronal differentiation [Citation6].
Natural derivatives of vitamin A, retinoids such as 9-cis-retinoic acid (9-cis-RA), 13-cis-retinoic acid (13-cis-RA), and all-trans-retinoic acid (at-RA), play important roles in neural differentiation [Citation7,Citation8]. RAs act as the ligand for nuclear retinoic acid receptors (RARs) and retinoid X receptors (RXRs), regulating gene expression by binding to short DNA sequences in the upstream promoter elements of target genes [Citation9]. RARs can be activated by both at-RA and 9-cis-RA, whereas RXRs are only activated by 9-cis-RA. RARs and RXRs both consist of α, β, and γ-subtypes [Citation10]. Endogenous neuronal RA synthesis occurs in the hippocampus, where RARα is strongly expressed [Citation3]. Vitamin A exert its function in the body by its derivatives, both vitamin A and its derivatives can be exogenously added by diet or drug, which can be used as a therapeutic strategy for vitamin A deficiency-related disorders.
RARs are found in mitochondria, which means vitamin A can regulate mitochondrial biogenesis [Citation11]. Vitamin A and its derivatives may influence mitochondrial function by a mechanism that is not completely understood, maybe by decreasing brain-derived neurotrophic factor (BDNF) levels or inducing ER stress, and then causing neurodegeneration [Citation12]. The treatment of HepG2 cells with 1 µM at-RA has been shown to lead to an increase in mitochondrial function [Citation13].
Mitochondrial dysfunction is also critically associated with neurodegenerative diseases, such as DS and AD [Citation14,Citation15]. Mitochondria are shorter in DS neurons, with a marked reduction in mitochondrial membrane potential. Down-regulation of mitochondrial function with decrease in ATP levels impairs mitochondrial transport in DS neurons and thus reduces synaptic activity and neuronal survival [Citation16]. Nuclear-encoded mitochondrial genes (NEMGs) are down-regulated in DS fetal brains, which may be a cause of mitochondrial dysfunction in DS [Citation17].
Peroxisome proliferator-activated receptor-γ co-activator-1α (PGC-1α) plays a central role in regulating mitochondrial biogenesis [Citation15,Citation17,Citation18]. Repression of PGC-1α leads to mitochondrial dysfunction and neurodegeneration [Citation19]. In addition, expression of PGC-1α is increased during differentiation of brown adipocytes incubated with 9-cis-RA [Citation20]. Also, 9-cis-RA and at-RA induce the expression of PGC-1α during the differentiation of bovine white adipose tissue [Citation21]. That means the alteration of mitochondrial function may be involved in vitamin A derivative-related neural disorders.
Receptor-interacting protein-140 (RIP140), whose gene maps to Hsa21, can induce neural differentiation of neuroblastoma cells [Citation22]. In addition, the expression of RIP140 is highly correlated to the differentiation of human embryonic stem cells [Citation23]. RIP140 is one of the target genes of retinoids, which is induced by retinoids and mediates negative-feedback regulation of retinoid signaling [Citation24]. RARα is a RA receptor that can bind to the retinoic acid receptor element (RARE) of RIP140 directly or indirectly, so that it regulates the expression of RIP140 [Citation25]. RIP140 can regulate mitochondrial biogenesis by acting as a co-repressor for several nuclear receptors that are important controlling factors in metabolism [Citation26,Citation27]. The key modulators of mitochondrial function, PGC-1α and NEMGs, are negatively controlled by the co-repressor RIP140, which have been called the RIP140/PGC-1α axis [Citation17]. Thus, RIP140 is highly associated with both neural differentiation and mitochondrial function, so we suppose that vitamin A derivatives induce neural differentiation by regulating the RIP140/PGC-1α axis.
Vitamin A and mitochondrial dysfunction are both associated with the CNS, the mechanism of vitamin A-induced neural differentiation and the notion that vitamin A can alter the morphology and function of mitochondria through the RIP140/PGC-1α axis in its induction of neural differentiation are unclear. Our previous works have demonstrated that RIP140 overexpression induces neuronal differentiation, with a synergistic effect with RA, using the N2a cell line (mouse neuroblastoma cell line) and stable RIP140-overexpressing N2a cell line [Citation22]. SY5Y cells are widely used in vitro models of neuronal function and differentiation. In this study, we evaluated the effects of vitamin A derivatives on neural differentiation and mitochondrial function as well in vitro. We demonstrated that 9-cis-RA, 13-cis-RA and at-RA all can induce the differentiation of the human neuroblastoma cell line SY5Y cells and the maturation of morphology and function of mitochondria through the RIP140/PGC-1α axis. This may provide a new common mechanism among AD, DS, and vitamin A-related neural differentiation disorders and have a clinical significance for the therapy of mitochondrial dysfunctional and neurodegenerative disease.
Materials and methods
Cell culture and neural differentiation
The human neuroblastoma cell line SH-SY5Y was purchased from the Chinese Academy of Sciences, Shanghai, China. SH-SY5Y cells were cultured in MEM/F12 (50:50) supplemented with 10% FBS and 1% penicillin/streptomycin; all these agents were purchased from Gibco. To induce differentiation, cells were incubated for 7 days in medium containing 1 µM 9-cis-RA, 13-cis-RA and at-RA (Sigma, St. Louis, MO, USA) [Citation10,Citation28,Citation29]. Cells bearing at least one neurite equal to or longer than the soma diameter were considered to be differentiated. The rate of differentiation is the percentage that differentiated cells account for the total number. To explore the role of receptors, cells were pretreated with antagonists of RA receptor α and β, BMS and LE135 (Sigma, St. Louis, MO, USA), for 24 h before the treatment of RAs and during the whole differentiation process.
Hematoxylin and eosin staining
Cells cultured in 12-well plates were washed three times with phosphate-buffered saline (PBS) and fixed with 4% paraformaldehyde for 15 min. Cell membranes were permeabilized with 0.2% Triton X-100 for 30 min and washed three times with PBS. Cells were then stained with hematoxylin and eosin (H&E) for 4 and 2 min, respectively.
Immunofluorescence analysis
Cells were fixed with paraformaldehyde and permeabilized with 0.2% Triton X-100. Samples were incubated with primary antibody against Nestin (1 µg/ml, ab105389) and anti-β III Tubulin antibody (1 µg/ml, ab78078) for 16 h at 4 °C. Goat anti-mouse IgG H&L (Alexa Fluor® 555) (ab150114, Abcam, Cambridge, MA, USA) and goat anti-rabbit IgG H&L (Alexa Fluor® 488) (ab150077, Abcam, Cambridge, MA, USA) were used as the secondary antibody for 2 h. Nuclei were counterstained with DAPI (CST, Danvers, MA, USA) for 10 min.
Western blotting analysis
Protein lysates were subjected to 10% polyacrylamide gel electrophoresis and blotted onto nitrocellulose membranes. Nitrocellulose membranes were blocked with Tris-buffered saline (TBST) containing 5% nonfat milk powder for 1 h at room temperature. Then, nitrocellulose membranes were incubated with antibodies against β-III tubulin (1:1000; ab78078, Abcam, Cambridge, MA, USA), Nestin (1:1000; ab105389, Abcam, Cambridge, MA, USA), RIP140 (1:1000; ab42126, Abcam, Cambridge, MA, USA), PGC-1α (1:1000; Proteintech, Chicago, IL, USA), RARα (1:1000; ab41934, Abcam, Cambridge, MA, USA), RARβ (1:1000; ab53161, Abcam, Cambridge, MA, USA), RARγ (1:1000; ab191368, Abcam, Cambridge, MA, USA) and GAPDH (1:2000; Proteintech, Chicago, IL, USA) overnight at 4 °C. After TBST washing, blots were incubated with HRP-linked goat anti-rabbit or goat anti-mouse IgG antibodies (1:2000; ZDR5306 and ZDR5307, ZSGB-BIO, Beijing, China) for 1 h at room temperature. Bands were then detected and visualized using ultrasensitive ECL chemiluminescence kit (Proteintech B500022).
Cell counting kit-8(CCK8) test
The drug was added to the cell-free medium, and then CCK-8 reagent (Dojindo, CK 04, Kumamoto, Japan) was added for detection 2 h later, compared with the drug-free medium (only CCK-8 reagent was added). The drug can be proved to have no effect on the OD value in case the OD value was not significantly higher. Cells were seeded in a 96-well plate with 100 μl culture medium and incubated (at 37 °C, 5% CO2) overnight. About 100 μl culture medium containing DMSO, BMS and LE135 were add into each wells, respectively. Then, add 10 μl of CCK-8 solution to each well and incubate the plate for 2 h in the incubator. The OD value at 450 nm were determined using a microplate reader. The proliferation rates were the ratio of OD values, with the DMSO group as a control group.
Transmission electron microscopy
Cells were enzymatically dissociated with 0.05% trypsin for 2 min, centrifuged at 2000 rpm for 5 min and fixed with glutaraldehyde at 4 °C. Cells were then washed three times in PBS, fixed in 1% OsO4 for 1–2 h at 4 °C and washed again three times in PBS. The specimens were first dehydrated with a graded series of ethanol (50, 70 and 90%), for 5–10 min at each step at 4 °C, and then dehydrated with anhydrous ethanol three times for 5–10 min at room temperature. The specimens were then transferred to a 1:1 (v/v) mixture of alcohol and propylene oxide for 10 min at room temperature, and then to pure propylene oxide for 10 min at room temperature. The specimens were dehydrated in vacuum and embedded in Epon 812 (EMS, Shanghai, China). The resin block was sectioned (Leica Ultracut UCT/UC6, Heidelberg, Germany) and examined by transmission electron microscopy (TEM) (FEI Tecnai Spirit) after lead and uranium staining.
Real-time quantitative polymerase chain reaction
Total RNA was isolated using the E.Z.N.A.® Total RNA Kit I (Omega, Norcross, GA, USA). cDNA was synthesized using RevertAid First Strand cDNA Synthesis Kit (Thermo Scientific, Code No. K1622, Northumberland, UK). RT-PCR was performed using SYBR Green Real-time PCR Master Mix (Toyobo, Code No. QPK-201, Osaka, Japan). Primer pairs were designed as described in . Cycling conditions were as follows: 95 °C for 1 min; 40 cycles of 95 °C for 15 s, 56 °C for 15 s and 72 °C for 45 s. The GAPDH housekeeping gene was chosen as reference gene. Fold-changes between expression in control and treated cells were determined by the delta Ct (ΔΔCt) method.
Table 1. RT-PCR primers.
Statistical analysis
Data were expressed as mean ± standard error of mean (SEM), obtained from at least three independent experiments. The statistical significance between groups was determined by one-way analysis of variance, followed by Dunnett’s post hoc test. p < .05 was considered statistically significant. The analyses were performed using Statistical Package for the Social Sciences 20.0 software (IBM, Inc., Armonk, NY). Correlation analysis was conducted by Spearman’s correlation test. p < .05 was considered statistically significant.
Results
Vitamin a derivatives induce neural differentiation of SH-SY5Y cells
The biological function of vitamin A in vivo is achieved through its derivatives. Accordingly, we treated SY5Y cells in vitro with RAs, the three derivatives of vitamin A, which are associated with neural development [Citation30]. SH-SY5Y is a human neuroblastoma cell line, in which neural differentiation can be induced by RAs. After exposure to 1 µM 9-cis-RA, 13-cis-RA and at-RA for 3 days, SH-SY5Y cells assumed a neuronal-like phenotype, where the ratio of neural differentiation was 20.68, 26.28 and 31.01%, respectively (p < .01), as determined by the Sandquist method. After exposure to 1 µM 9-cis-RA, 13-cis-RA and at-RA for 7 days, SH-SY5Y cells showed longer neurites and a higher neural differentiation ratio of 80.02, 79.74 and 84.22%, respectively (p < .01). While the neural differentiation of the control group, treated with an equal amount of DMSO for 3 and 7 days, was 6.45 and 6.40%, respectively (). The protein levels of neuron marker β-III Tubulin, which plays a critical role in proper axon guidance and maintenance, and neural stem cell marker Nestin were both increased after treatment with RAs ( and ). The mRNA level of both markers was up-regulated at 3 and 7 days ().
Figure 1. Morphology of cells after 3 and 7 days treatment of RAs. (a,e) SH-SY5Y cells, treated with DMSO for 3 and 7 day, respectively as control group, maintained the original undifferentiated state. (b–d) Morphology of cells treated with 9-cis-RA, 13-cis-RA and at-RA, respectively for 3 days shows neurite outgrowth. (f–h) Morphology of cells treated with 9-cis-RA, 13-cis-RA and at-RA, respectively all shows longer neurite outgrowth than 3 days. (i,j) Differentiation rate of 3 and 7 days, respectively. Differentiation rate was calculated as the average of five fields of each group randomly.
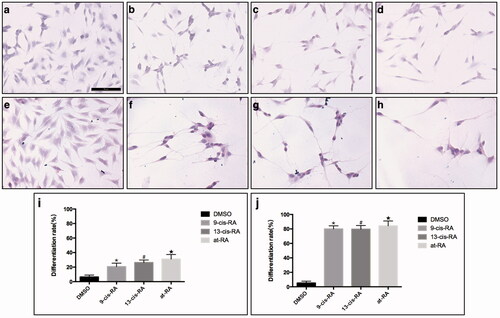
Figure 2. Expression of neural differentiation markers Nestin and β-III Tubulin changed during RAs-induced differentiation of SH-SY5Y cells. (a) SH-SY5Y cells were cultured in culture medium with no treatment as control group. (b) SH-SY5Y cells were treated with equal volume DMSO for 3 days as control. (c–e) SH-SY5Y cells treated with 9-cis-RA, 13-cis-RA and at-RA, respectively for 3 days showed increase trend in the protein level of β-III Tubulin and a decline trend of Nestin. (f) SH-SY5Y cells were treated with equal volume DMSO for 7 days as control. (g–i) SH-SY5Y cells treated with 9-cis-RA, 13-cis-RA and at-RA, respectively for 7 days showed a significant increase in β-III Tubulin and almost none Nestin. The exposure time of β-III Tubulin, Nestin and DAPI were 174 ms, 1.1 s and 31 ms, respectively.
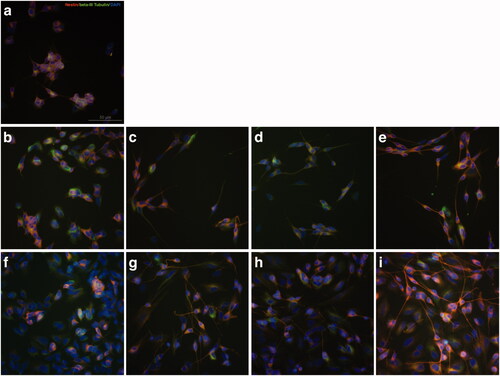
Figure 3. Relative protein expression of neural differentiation markers Nestin and β-III Tubulin measured by Western blot. Relative protein expression of neural Nestin and β-III Tubulin after 3 days treatment of DMSO, 9-cis-RA, 13-cis-RA and at-RA were detected by Western blot respectively, and the relative expression level was calculated using gray value analysis. Treatment group of 9-cis-RA, 13-cis-RA and at-RA was upon normalization to the DMSO-treated control group.
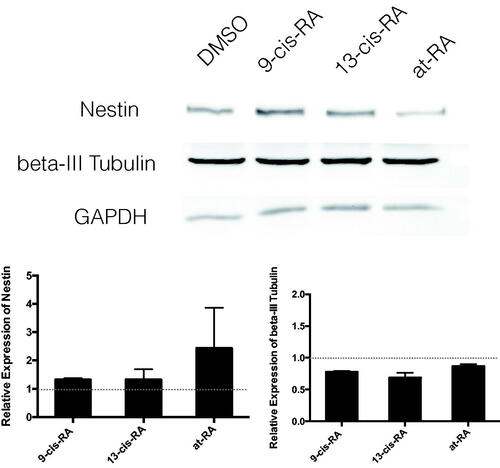
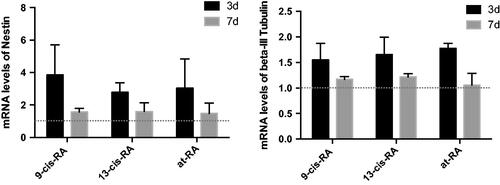
Figure 4. Relative mRNA expression of neural differentiation markers Nestin and β-III Tubulin measured by real-time PCR. Treatment group of 9-cis-RA, 13-cis-RA and at-RA was upon normalization to the DMSO-treated control group.
Vitamin A derivatives alter mitochondrial morphology and function in the process of neural differentiation
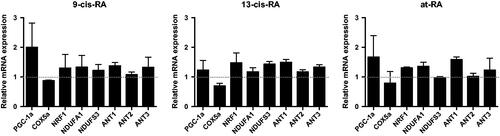
After exposure to 1 µM 9-cis-RA, 13-cis-RA and at-RA for 7 days, changes in cellular ultrastructure were observed by TEM, characterized by deformation of cells and cell nucleus, lower nuclear–cytoplasmic ratio and increased mitochondria (). Mitochondria had a long strip shape with well-developed mitochondrial cristae and showed complete function as seen by the increased level of PGC-1α, which is a crucial factor of mitochondria biogenesis, with its expression levels being directly related to mitochondrial biogenesis activity [Citation31] (). The expression of PGC-1α and other mitochondria-related genes, NEMGs, was up-regulated after 3 days treatment with all three derivatives, 9-cis-RA, 13-cis-RA and at-RA, which means that the function of mitochondria was up-regulated ().
Figure 5. Ultrastructural images of SH-SY5Y cells treated with RAs. (a) Ultrastructural images of SH-SY5Y cells treated with DMSO for 7 days shows smooth edge, possessing larger nucleoli with regular shape. (b–d) Ultrastructural images of SH-SY5Y cells treated with 9-cis-RA, 13-cis-RA and at-RA, respectively for 7 days shows that the morphology of cells and nuclei are irregular, the nuclear–cytoplasmic ratios are decreased, and microvillus appear at the edge of cell membrane. (e) Average number of mitochondria of SH-SY5Y cells treated with DMSO, 9-cis-RA, 13-cis-RA and at-RA, respectively for 7 days. Five fields were selected for each group, each field containing at least one complete cell.
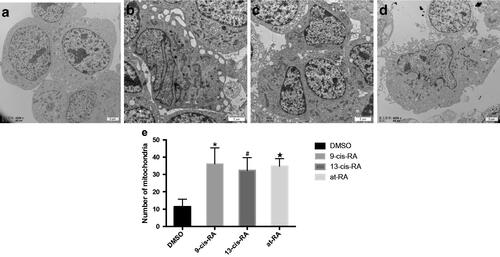
Figure 6. Ultrastructural images of mitochondria and the expression of PGC-1a during RAs-induced neural differentiation of SH-SY5Y cells. (a) SH-SY5Y cells treated with DMSO for 7 days shows dotted or spherical mitochondria with immature cristae. (b–d) SH-SY5Y cells treated with 9-cis-RA, 13-cis-RA and at-RA, respectively for 7 days shows increased and long strip-shaped mitochondria with well-developed mitochondria cristae. (e–h) Expression of PGC-1a on SH-SY5Y cells treated with DMSO, 9-cis-RA, 13-cis-RA and at-RA, respectively for 7 days.
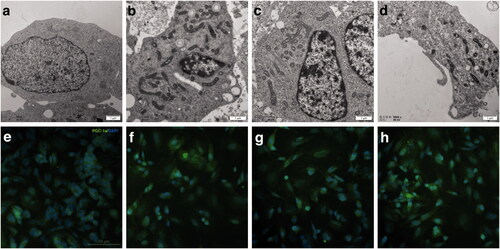
Figure 7. The mRNA expression of PGC-1a and NEMGs treated with RAs for 3 days. The mRNA level were measured by real-time PCR, GAPDH was measured as a loading control. The relative expression level of PGC-1a and NEMGs after 3 days treatment of 9-cis-RA, 13-cis-RA and at-RA were calculated respectively by means of the △△CT method, upon normalization to the DMSO-treated control group. Data were expressed as the mean ± SEM.
The RIP140/PGC-1α axis is a target of vitamin A derivatives in their effect on mitochondrial function
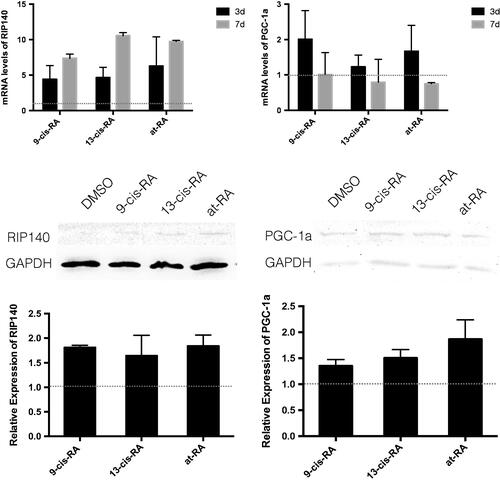
Real-time PCR and Western Blot showed that after 3-day treatment with 9-cis-RA, 13-cis-RA and at-RA, the mRNA level and protein level of RIP140 and PGC-1α were both increased, and by the 7th day, the mRNA level of RIP140 was still up-regulated, while that of PGC-1α was down-regulated ().
Figure 8. The mRNA and protein expression of RIP140 and PGC-1a treated with RAs. The mRNA level were measured by real-time PCR, GAPDH was measured as a loading control. The relative expression level of RIP140 and PGC-1a after 3 and 7 days treatment of 9-cis-RA, 13-cis-RA and at-RA were calculated respectively by means of the △△CT method, upon normalization to the DMSO-treated control group. Data were expressed as the mean ± SEM. Relative protein expression of RIP140 and PGC-1a after 3 days treatment of DMSO, 9-cis-RA, 13-cis-RA and at-RA were detected by Western blot, respectively, and the relative expression level was calculated using gray value analysis. Treatment group of 9-cis-RA, 13-cis-RA and at-RA was upon normalization to the DMSO-treated control group.
Retinoic acid receptors are involved in the RIP140/PGC-1α axis in vitamin A derivative-induced neural differentiation
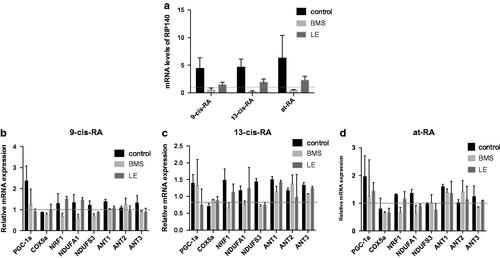
During the neural differentiation of SH-SY5Y cells treated with RAs, the mRNA level and protein level of retinoic acid receptors α, β, and γ (RARα, RARβ and RARγ) were all up-regulated, which were the key factors of the RA signaling pathway (). When treated with RARα and RARβ antagonists, neural differentiation induced by RAs was suppressed to a different degree, where both of the neural markers were down-regulated (). And we had proved these two antagonists don’t affect cell proliferation (). mRNA expression of its target gene RIP140 was also suppressed, and the up-regulated mitochondrial function induced by vitamin A derivatives was decreased in the presence of RARα and RARβ antagonists ().
Figure 9. The mRNA and protein expression of RARα, RARβ and RARγ treated with RAs. The mRNA level were measured by real-time PCR, GAPDH was measured as a loading control. The relative expression level of RARα, RARβ and RARγ after 3 and 7 days treatment of 9-cis-RA, 13-cis-RA and at-RA were calculated respectively by means of the △△CT method, upon normalization to the DMSO-treated control group. Data were expressed as the mean ± SEM. Relative protein expression of RARα, RARβ and RARγ after 3 days treatment of DMSO, 9-cis-RA, 13-cis-RA and at-RA were detected by Western blot, respectively, and the relative expression level was calculated using gray value analysis. Treatment group of 9-cis-RA, 13-cis-RA and at-RA was upon normalization to the DMSO-treated control group.
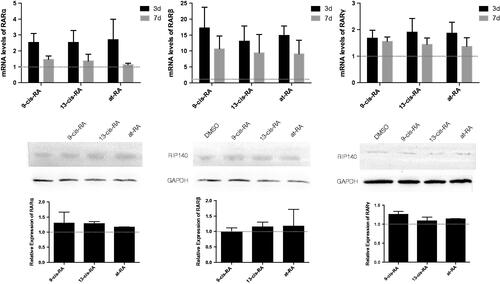
Figure 10. Morphology of cells treated with RAs for 3 days. Cells treated with RARα antagonist BMS (a–d) and RARβ antagonist LE135 (e–h) and control group without antagonist (i–l). Treatment with RAs was as follows: DMSO group (a,e,i), 9-cis-RA group (b,f,j), 13-cis-RA group (c,g,k) and at-RA group (d,h,l). (m) Differentiation rates were calculated as the average of five random fields of each group. Differentiation rates for BMS and LE treatment were decreased significantly in contrast with the no antagonist control group (p < .05). (n,o) The mRNA levels of the two neural markers Nestin and β-III Tubulin were both down-regulated in the BMS and LE groups.
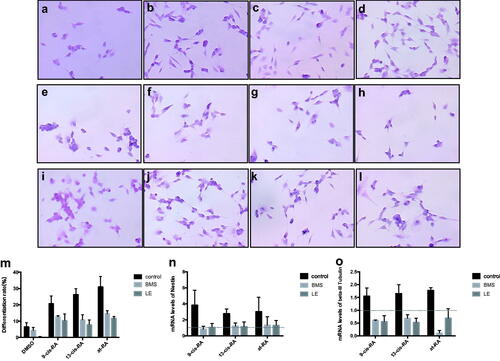
Figure 11. Proliferation rate of cells treated with RARα and RARβ antagonist. It had been proven that RARα and RARβ antagonist BMS and LE135 have no effect on the OD value. Cells were treated with BMS and LE135 for 0, 24, 48 and 72 h, and then proliferation rate were detected using CCK8 test. The control group were maintained in the normal culture medium.
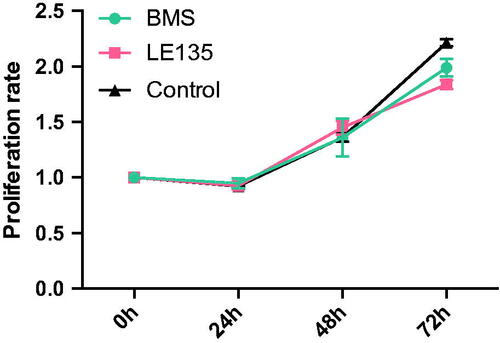
Figure 12. The effect of antagonists on the mRNA expression of RIP140, PGC-1α and NEMGs during RAs-induced differentiation. (a) The mRNA expression of RA target gene RIP140 treated with RAs for 3 days. The expression of RIP140 was up-regulated in the no antagonist control group and down-regulated in both BMS- and LE-treated groups. (b–d) The mRNA expression of PGC-1α and NEMGs in cells treated with RAs for 3 days. The expression of PGC-1α and NEMGs was mostly up-regulated in the no antagonist control group and down-regulated in both BMS- and LE-treated groups.
Discussion
Previous studies demonstrated that vitamin A and its derivatives play an important role in regulating mitochondrial function and neural differentiation [Citation7,Citation11,Citation12], which are highly associated with neural development and neurodegenerative diseases. The serum level of vitamin A and its derivatives could have an important role in the occurrence and development of those disease, and the causes of those diseases can be traced back to low serum level of vitamin A during pregnancy. We chose the three neural differentiation-related derivatives of vitamin A, 9-cis-RA, 13-cis-RA and at-RA, to induce neural differentiation of SH-SY5Y cells and investigate the function of mitochondria and the molecular mechanisms. Our study showed that 9-cis-RA, 13-cis-RA and at-RA all can induce neural differentiation of SH-SY5Y cells and the alteration of mitochondrial morphology and function. The concentration of all these three RAs was 1 µM as reported in our preliminary study [Citation28].
PGC-1α is a key factor of mitochondrial biogenesis. A previous study established that 9-cis-RA can induce PGC-1α mRNA expression in brown adipocytes [Citation20]. Our study also demonstrated that the key factors of mitochondrial biogenesis and function, PGC-1α and NEMGs, were up-regulated in the presence of RAs. Moreover, we observed other metabolic-related changes during neural differentiation of SH-SY5Y cells, such as an increase in glycogen and lipid droplets, which are all associated with energy metabolism. During this process, the mRNA level of retinoic acid receptor α, β, and γ was up-regulated, which means a mobilized RA signaling pathway. When adding the antagonists of retinoic acid receptor α and β, respectively BMS and LE135, the differentiation rate and up-regulation of mitochondrial function were decreased. Therefore, we considered that RAs regulated energy metabolism, especially mitochondrial function, through the RA signaling pathway and the key factor PGC-1α so as to induce neural differentiation of SH-SY5Y cells.
RIP140 is up-regulated in DS and affects cellular biological processes, such as neural migration, differentiation and other biological functions of neural cells. Our previous study showed that the over expression of RIP140 led to the neural differentiation of mouse neuroblastoma N2a cells. In addition, there was a synergy between overexpressed RIP140 and treatment with RA [Citation22]. Furthermore, RIP140 was highly relevant to the directed differentiation of human embryonic stem cells into neural stem cells [Citation23]. In this study, we observed that RIP140 mRNA expression was increased nearly four-fold in RA-induced neural differentiation. RIP140 can act as a transcriptional co-repressor for nuclear receptors, altering the expression of several gene clusters that are required for many metabolic pathways, including mitochondrial metabolism [Citation26]. A previous study indicated that RIP140 and PGC-1α have an antagonistic role in regulating cardiac energy state and mitochondrial biogenesis [Citation32]. Another study indicated that RIP140 contributes to the mitochondrial dysfunction observed in DS by negatively controlling mitochondrial pathways regulated by PGC-1α, which was called the RIP140/PGC-1α axis. In our study, both protein and mRNA levels of RIP140, PGC-1α and NEMGs were up-regulated in the neural differentiation of SH-SY5Y cells treated with RAs and down-regulated when treated with RAs and the antagonists of retinoic acid receptor α and β, BMS and LE135. These findings indicated that treatment with RAs can up-regulate their downstream target gene RIP140 through RA signaling including RARα and RARβ, but we believe that the dysfunction of mitochondria caused by endogenous increase in RIP140 expression can be restored by exogenous RAs. However, further studies, such as with RIP140 overexpressing cells or knockdown cell lines or animal models, are indeed needed to establish the role of RIP140 in mitochondria biogenesis in RA-induced neural differentiation.
In conclusion, our study confirmed that RAs can induce neural differentiation through the RA signaling pathway, accompanied by the alteration of mitochondria. The molecular mechanism maybe related to the RIP140/PGC-1α axis. This study may provide a dietary therapeutic strategy for patients with neurodegenerative diseases or neural development disorders accompanied by low serum vitamin A levels, even for pregnant mothers at risk of neural development disorders occurring in their offspring. Molecular mechanisms testified in this research may provide a possible therapeutic target for clinical prevention, treatment and prognosis.
Acknowledgements
We also thank the editors from BioMed Proofreading LLC for comprehensive editing of this article.
Disclosure statement
No potential conflict of interest was reported by the authors.
Additional information
Funding
Related Research Data
References
- Tanumihardjo SA, Russell RM, Stephensen CB, et al. Biomarkers of nutrition for development (BOND) – vitamin A review. J Nutr. 2016;146:1816S–1848S.
- Ono K, Yamada M. Vitamin A and Alzheimer’s disease. Geriatr Gerontol Int. 2012;12:180–188.
- Shearer KD, Stoney PN, Morgan PJ, McCaffery PJ. A vitamin for the brain. Trends Neurosci. 2012;35:733–741.
- Chávez CJ, Ortega P, Leal J, et al. Deficiencia de vitamina A y estado nutricional en pacientes con Síndrome de Down. Anales De Pediatría. 2010;72:185–190.
- Lee HP, Casadesus G, Zhu X, et al. All-trans retinoic acid as a novel therapeutic strategy for Alzheimer’s disease. Expert Rev Neurother. 2009;9:1615–1621.
- Das BC, Thapa P, Karki R, et al. Retinoic acid signaling pathways in development and diseases. Bioorg Med Chem. 2014;22:673–683.
- Jacobs S, DeCicco KL, Shi Y, et al. Retinoic acid is required early during adult neurogenesis in the dentate gyrus. PNAS. 2006; 103:3902–3907.
- Connolly RM, Nguyen NK, Sukumar S. Molecular pathways: current role and future directions of the retinoic acid pathway in cancer prevention and treatment. Clin Cancer Res. 2013;19:1651–1659.
- Blomhoff R, Blomhoff HK. Overview of retinoid metabolism and function. J Neurobiol. 2006;66:606–630.
- Doldo E, Costanza G, Agostinelli S, et al. Vitamin A, cancer treatment and prevention: the new role of cellular retinol binding proteins. BioMed Res Int. 2015;2015:1–14.
- Berdanier CD, Christina Hermoyian HBE, Mathews CE. Role of vitamin A in mitochondrial gene expression. Diab Res Clin Pract. 2001;54:11–27.
- de Oliveira MR. Vitamin A and retinoids as mitochondrial toxicants. Oxid Med Cell Longev. 2015;2015:140267.
- Tripathy S, Chapman JD, Han CY, et al. All-trans-retinoic acid enhances mitochondrial function in models of human liver. Mol Pharmacol. 2016;89:560–574.
- HroudováJ, Singh N, Fišar Z. Mitochondrial dysfunctions in neurodegenerative diseases: relevance to Alzheimer’s disease. BioMed Res Int. 2014;2014:1–9.
- Izzo A, Nitti M, Mollo N, et al. Metformin restores the mitochondrial network and reverses mitochondrial dysfunction in Down syndrome cells. Hum Mol Genet. 2017;26:1056–1069.
- Helguera P, Seiglie J, Rodriguez J, et al. Adaptive downregulation of mitochondrial function in down syndrome. Cell Metabol. 2013; 17:132–140.
- Izzo A, Manco R, Bonfiglio F, et al. NRIP1/RIP140 siRNA-mediated attenuation counteracts mitochondrial dysfunction in Down syndrome. Hum Mol Genet. 2014;23:4406–4419.
- Piccoli C, Izzo A, Scrima R, et al. Chronic pro-oxidative state and mitochondrial dysfunctions are more pronounced in fibroblasts from Down syndrome foeti with congenital heart defects. Hum Mol Genet. 2013;22:1218–1232.
- Cui L, Jeong H, Borovecki F, et al. Transcriptional repression of PGC-1alpha by mutant Huntingtin leads to mitochondrial dysfunction and neurodegeneration. Cell. 2006;127:59–69.
- Hondares E, Mora O, Yubero P, et al. Thiazolidinediones and rexinoids induce peroxisome proliferator-activated receptor-coactivator (PGC)-1alpha gene transcription: an autoregulatory loop controls PGC-1alpha expression in adipocytes via peroxisome proliferator-activated receptor-gamma coactivation. Endocrinology. 2006;147:2829–2838.
- Garcia-Rojas P, Antaramian A, Gonzalez-Davalos L, et al. Induction of peroxisomal proliferator-activated receptor and peroxisomal proliferator-activated receptor coactivator 1 by unsaturated fatty acids, retinoic acid, and carotenoids in preadipocytes obtained from bovine white adipose tissue1,2. J Anim Sci. 2010;88: 1801–1808.
- Feng X, Yu W, Liang R, et al. Receptor-interacting protein 140 overexpression promotes neuro-2a neuronal differentiation by ERK1/2 signaling. Chin Med J. 2015;128:119–124.
- Zhao ZR, Yu WD, Shi C, et al. Correlation between receptor-interacting protein 140 expression and directed differentiation of human embryonic stem cells into neural stem cells. Neural Regen Res. 2017;12:118–124.
- Heim KC, Gamsby JJ, Hever MP, et al. Retinoic acid mediates long-paced oscillations in retinoid receptor activity: evidence for a potential role for RIP140. PLoS ONE. 2009;4:e7639.
- Wu CY, Feng X, Wei LN. Coordinated repressive chromatin-remodeling of Oct4 and Nanog genes in RA-induced differentiation of embryonic stem cells involves RIP140. Nucleic Acids Res. 2014;42: 4306–4317.
- Christian M, White R, Parker MG. Metabolic regulation by the nuclear receptor corepressor RIP140. Trends Endocrinol Metab. 2006;17:243–250.
- Blondrath K, Steel JH, Katsouri L, et al. The nuclear cofactor receptor interacting protein-140 (RIP140) regulates the expression of genes involved in Abeta generation. Neurobiol Aging. 2016;47:180–191.
- Riddoch FC, Brown AM, Rowbotham SE, et al. Changes in functional properties of the caffeine-sensitive Ca2+ store during differentiation of human SH-SY5Y neuroblastoma cells. Cell Calcium. 2007;41:195–206.
- Ferrari-Toninelli G, Bonini SA, Uberti D, et al. Targeting notch pathway induces growth inhibition and differentiation of neuroblastoma cells. Neuro-Oncology. 2010;12:1231–1243.
- Asson-Batres MA, Rochette-Egly C, editors. The biochemistry of retinoic acid receptors I: structure, activation, and function at the molecular level. Vol. 70. Dordrech, Netherlands: Springer; 2014.
- Lopez-Lluch G, Irusta PM, Navas P, de Cabo R. Mitochondrial biogenesis and healthy aging. Exp Gerontol. 2008;43:813–819.
- Chen Y, Wang Y, Chen J, et al. Roles of transcriptional corepressor RIP140 and coactivator PGC-1alpha in energy state of chronically infarcted rat hearts and mitochondrial function of cardiomyocytes. Mol Cell Endocrinol. 2012;362:11–18.