
Abstract
Renal fibrosis is a common and characteristic symptom of chronic kidney disease (CKD). However, the molecular mechanisms of renal fibrosis remain elusive. Ischemia injury, as a major cause of AKI, deserves more attention in order to improve the knowledge of AKI-induced fibrosis. Transforming growth factor-β (TGF-β)-activated kinase 1 (TAK1) interacts directly with TGF-β, which play a critical role in the progression of fibrosis. Therefore, the present study aimed to investigate the role of TAK1 in the pathogenesis of ischemia-induced renal fibrosis. Compared with mice in the vehicle group, mice intraperitoneally injected with TAK1 inhibitor were found to have lower serum creatinine, less tubular damage and more mild fibrosis following ischemia-induced AKI. Furthermore, inhibition of TAK1 reduced p38 phosphorylation, decreased expression of Bax and caspase 3 and apoptosis cells in kidneys of mice treated with IR-induced AKI. Compared with vehicle-treated renal tubular epithelial cells, TAK1 overexpression cells were found to have a higher apoptosis and fibrosis index level and p38 phosphorylation following hypoxia/reoxygenation (H/R) treatment. Furthermore, the p38 inhibitor combined with TAK1 overexpression verified the role of TAK1/p38 signaling pathway in apoptosis and fibrosis index level of renal tubular epithelial cells treated with H/R. Thus, our results show that TAK1 plays an important role in the pathogenesis of ischemia-induced renal fibrosis and may mediate p38-regulated cell apoptosis.
Introduction
Fibrosis is a common pathologic feature of end stage renal disease, which is progressed by chronic kidney disease (CKD) and has various causes [Citation1]. The typical pathological features of fibrosis include a decrease of cells in the glomeruli, overexpression of extracellular matrix (ECM), hyperplasia of renal interstitial fibroblasts and loss of interstitial capillaries [Citation2,Citation3]. Dysfunction of renal tubular epithelial cells is one of the many etiological mechanisms of renal fibrosis [Citation4]. According to type II epithelial-mesenchymal transition theory, injured epithelial cells can become a direct precursor of myofibroblasts [Citation5]. Although disputes exist with respect to theory, both expression of transforming growth factor-β1 (TGF-β1) and synthesis of ECM protein in renal tubular epithelial cells are increased under pathological conditions and are known to participate in the development of renal interstitial fibrosis [Citation6,Citation7]. However, the molecular mechanisms of renal fibrosis and the role of renal tubular epithelial cells in renal fibrosis remain elusive.
Acute kidney injury (AKI) is a prominent risk factor for the development of CKD [Citation8]. In recent years, ischemia-induced AKI have attracted much attention because of high rate of later renal fibrosis [Citation9,Citation10]. However, the related specific mechanism have not been rigorously explored. A significant body of evidence indicates that the TGF-β signaling pathway mediates the mechanism of CKD [Citation11,Citation12]. Transforming growth factor-β-activated kinase 1 (TAK1) is an important signal transducer within cells and has been shown to be involved in almost all aspects of cell function, as well as located upstream of MAPK [Citation13]. However, the role of TAK1 in renal fibrosis remains unclear. Therefore, we investigated the role of TAK1 in ischemia-induced renal fibrosis model in vivo and in vitro. Our results have shown that TAK1 mediates apoptosis to play an important role for ischemia-induced renal fibrosis via p38 signaling pathway.
Results
Inhibition of TAK1 alleviates ischemia-induced renal fibrosis in vivo
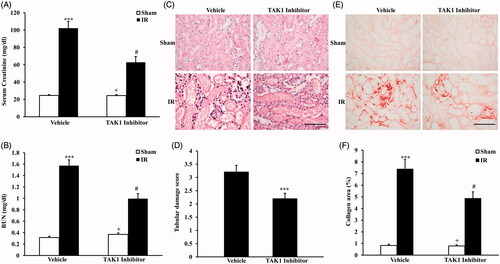
To investigate the effect of TAK1 on ischemia-induced renal fibrosis, BALB/c mice were treated i.p. with saline or TAK1 inhibitor once per day for two times. After the first i.p. with TAK1 inhibitor, animals were administrated with bilateral renal ischemia reperfusion (IR) injury model and, respectively, sacrificed at 24 h and 14 days after IR treatment. Renal function with serum creatinine and urea nitrogen were detected at 24 h after IR treatment. The results showed that mice developed renal dysfunction as reflected by marked elevation of serum creatinine and urea nitrogen 24 h after IR treatment. Renal function was relatively alleviated in mice with i.p. TAK1 inhibitor, whose serum creatinine and urea nitrogen were much lower than vehicle-treated mice (). Meanwhile, kidney sections were stained with HE and scored for histological injury 24 h after IR treatment (). The results showed that the tubular damage score were significantly lower in mice with i.p. TAK1 inhibitor than vehicle mice at 24 h after IR treatment (). These results indicated that our renal IR model were successful. Then, kidney sections were stained with Sirius Red at 14 days after IR treatment (). Sirius Red staining showed that IR-treated mice developed significant collagen deposition in the kidney compared with sham mice. The collagen area were significantly lower in mice with i.p. TAK1 inhibitor than vehicle mice at 14 days after IR treatment (). These data indicated that inhibition of TAK1 alleviates ischemia-induced renal fibrosis in vivo.
Figure 1. Inhibition of TAK1 alleviates ischemia-induced renal fibrosis in vivo. (A) Effect of TAK1 inhibition on serum creatinine in vehicle group and TAK1 inhibitor group mice at 24 h after IR or sham treatment. ***p < .001 versus sham vehicle; +p < .05 versus TAK1 inhibitor IR; #p < .05 versus vehicle IR. n = 6 in each group. (B) Effect of TAK1 inhibition on serum urea nitrogen in Vehicle group and TAK1 inhibitor group mice at 24 h after IR or sham treatment. ***p < .001 versus sham vehicle; +p < .05 versus TAK1 inhibitor IR; #p < .05 versus vehicle IR. n = 6 in each group. (C) HE staining for kidney sections of vehicle group and TAK1 inhibitor group mice at 24 h after IR or sham treatment (original magnification: ×400, Scale bar: 50 μm). (D) Quantitative assessment of tubular damage in vehicle and TAK1 inhibitor group mice at 24 h after IR treatment. ***p < .001 versus vehicle IR. n = 6 in each group. (E) Representative photomicrographs of kidney sections stained with Sirius red for assessment of total collagen deposition in vehicle group and TAK1 inhibitor group mice at 14 days after IR or sham treatment. Scale bar: 50 μm. (F) Quantitative analysis of interstitial collagen content in kidneys of vehicle group and TAK1 inhibitor group mice at 14 days after IR or sham treatment. ***p < .001 versus sham vehicle; +p < .05 versus TAK1 inhibitor IR; #p < .05 versus vehicle IR. n = 6 in each group.
Inhibition of TAK1 decrease collagen I and fibronectin expression in kidney treated with IR
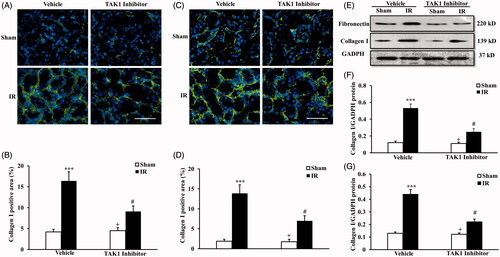
We next examined the expression and accumulation of collagen I and fibronectin, two major components of the ECM with immunofluorescence staining () and western blot (). Immunofluorescence demonstrated that IR treatment significantly increased the protein expression of collagen I and fibronectin in the kidneys at 14 days after IR treatment, the protein expression of collagen I and fibronectin were significantly lower in mice with i.p. TAK1 inhibitor than vehicle mice at 14 days after IR treatment (). The protein level of collagen I and fibronectin with western blot were consistented with the results of immunofluorescence (). These data indicate that IR induces later renal fibrosis and inhibiton of TAK1 can restrain IR-induced renal fibrosis.
Figure 2. Inhibition of TAK1 decrease collagen I and fibronectin expression in kidney treated with IR. (A) Representative photomicrographs of collagen I immunofluorescence staining in kidneys of mice in vehicle group and TAK1 inhibitor group at 14 days after IR or sham treatment. (B) Quantitative analysis of collagen I positive area in kidneys of mice in vehicle group and TAK1 inhibitor group at 14 days after IR or sham treatment. ***p < .001 versus sham vehicle; +p < .05 versus TAK1 inhibitor IR; #p < .05 versus vehicle IR. n = 6 in each group. (C) Representative photomicrographs of fibronectin immunofluorescence staining in kidneys of mice in vehicle group and TAK1 inhibitor group at 14 days after IR or sham treatment. (D) Quantitative analysis of fibronectin positive area in kidneys of mice in Vehicle group and TAK1 inhibitor group at 14 days after IR or sham treatment. ***p < .001 versus sham vehicle; +p < .05 versus TAK1 inhibitor IR; #p < .05 versus Vehicle IR. n = 6 in each group. (E) Representative western blots showed protein levels of collagen I and fibronectin in kidneys of mice in vehicle group and TAK1 inhibitor group at 14 days after IR or sham treatment. (F) Quantitative analysis of collagen I protein expression of kidneys in vehicle group and TAK1 inhibitor group mice at 14 days after IR or sham treatment. ***p < .001 versus sham vehicle; +p < .05 versus TAK1 inhibitor IR; #p < .05 versus vehicle IR. n = 6 in each group. (G) Quantitative analysis of fibronectin protein expression of kidneys in vehicle group and TAK1 inhibitor group mice at 14 days after IR or sham treatment. ***p < .001 versus sham vehicle; +p < 0.05 versus TAK1 inhibitor IR; #p < .05 versus vehicle IR. n = 6 in each group.
Inhibition of TAK1 decrease apoptotic cell death and p38 phosphorylation in kidney treated with IR
We next determine the effect of TAK1 inhibition on tubular epithelial cell apoptosis in the pathogenesis of IR-induced renal fibrosis. The results with TUNEL staining () showed that IR treatment significantly increased the number of tubular apoptotic cells in the kidneys at 24 h after IR treatment, the apoptotic cells number in IR kidneys of mice with TAK1 inhibitor treatment were significantly decreased compared with vehicle treatment mice at 24 h after IR treatment ().
Figure 3. Inhibition of TAK1 decrease apoptotic cell death and p38 phosphorylation in kidney treated with IR. (A) Representative photomicrographs of kidney sections stained for apoptotic cells and counterstained with methyl green in kidneys. Scale bar: 50 μm. (B) Quantitative analysis of TUNEL-positive cells in the kidneys. ***p < .001 versus sham vehicle; +p < .05 versus TAK1 inhibitor IR; #p < .05 versus Vehicle IR. n = 6 in each group. HPF, high power field; TUNEL, terminal transferase dUTP nick-end labeling. (C) Representative western blots show Bax and cleaved caspase 3 protein levels in the kidneys after sham or IR. (D) Quantitative analysis of Bax protein levels in the kidneys. ***p < .001 versus sham vehicle; +p < .05 versus TAK1 inhibitor IR; #p < .05 versus vehicle IR. n = 6 in each group. (E) Quantitative analysis of cleaved caspase 3 protein levels in the kidneys. ***p < .001 versus sham vehicle; +p < .05 versus TAK1 inhibitor IR; #p < .05 versus Vehicle IR. n = 6 in each group. (F) Representative western blots showed phosphorylation levels of p38 in the kidneys after sham or IR. (G) Quantitative analysis of p38 phosphorylation in the kidneys after sham or IR. ***p < .001 versus sham vehicle; +p < .05 versus TAK1 inhibitor IR; #p < .05 versus vehicle IR. n = 6 in each group.
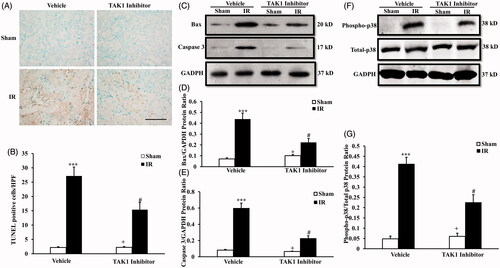
Bax is the pro-apoptotic member of the Bcl-2 family, and determines cytochrome C release and subsequent caspase activation that induces cell apoptosis [Citation14]. Caspase 3 is a frequently activated death protease that is essential for certain processes associated with the formation of apoptotic bodies [Citation15]. Therefore, we then detected the protein level of bax and caspase 3 at 24 h after IR treatment with western blot (). Western blot analysis showed that the levels of bax and cleaved caspase 3 in the kidneys were significantly lower in TAK1 inhibitor-treated mice after IR than vehicle-treated mice at 24 h after IR (). These data indicate that inhibition of TAK1 restrains tubular epithelial cell apoptosis in the pathogenesis of IR-induced renal fibrosis.p38MAPK is a member of the MAPK family that can be activated by various environmental stressors. Numerous studies have defined critical roles of p38MAPK in different biological processes, including cell growth, differentiation, apoptosis and inflammation [Citation16,Citation17]. To explore the mechanisms of cells apoptosis responsible for TAK1 involved in IR-induced renal fibrosis, we examined the level of activated p38 in kidney treated with TAK1 inhibitor or vehicle with IR treatment using western blot (). The results revealed that phosphorylation levels of p38 were upregulated significantly in the kidneys of IR-treated mice compared with sham treatment at 24 h after IR. Phosphorylation levels of p38 were significantly decreased in the kidneys of TAK1 inhibitor-treated mice compared with vehicle mice at 24 h after IR (). These data reminder that TAK1 might mediates p38 signaling pathway involved in IR-induced renal fibrosis.
TAK1 expression pattern in vivo and the correlation between TAK1 or TUNEL and p38
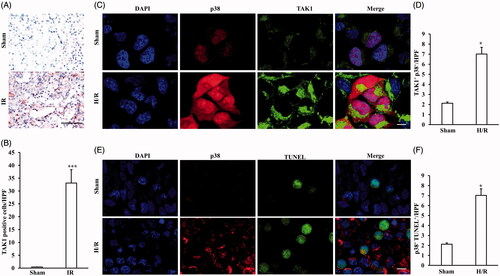
To investigate the role of TAK1 in the pathological process of ischemia-induced renal fibrosis, TAK1 expression pattern in kidney of mice in IR group and Sham group were observed (). The results revealed that TAK1 were mainly expressed in renal tubules and there was a significant increase in the number of TAK1-positive cells in kidneys of IR-treated mice compared with sham group mice (). Therefore, we further confirmed the correlation between TAK1 or TUNEL and p38 in renal tubular epithelial cells with H/R treatment. The co-immunohistochemistry results showed that the number of TAK1+ and p38+ positive cells were significant increased in renal tubular epithelial cells with H/R treatment compared with sham treatment (). The results showed that the number of TUNEL+ and p38+ positive cells were also significant increased in renal tubular epithelial cells with H/R treatment compared with sham treatment (F)). These data prompt that TAK1 might mediates apoptosis via p38 signaling pathway in renal tubular epithelial cells.
Figure 4. TAK1 expression pattern and the correlation between TAK1 or TUNEL and p38. (A) Representative photomicrographs of TAK1 immunohistochemical staining in kidneys of mice with IR model or Sham (original magnification: ×400, Scale bar: 50 μm). (B) Quantitative analysis of TAK1 positive cells in kidneys of mice with IR model or Sham. ***p < .001 versus sham, n = 6 each. (C) Representative photomicrographs of renal tubular epithelial cells with H/R or sham treatment stained for TAK1, p38 and DAPI. Scale bar: 10 μm. (D) Quantitative analysis of TAK1+ and p38+ renal tubular epithelial cells with H/R or sham treatment. *p < 0.05 versus sham, n = 4 per group. (E) Representative photomicrographs of renal tubular epithelial cells with H/R or sham treatment stained for p38, TUNEL and DAPI. Scale bar: 10 μm. (F) Quantitative analysis of p38+ and TUNEL+ renal tubular epithelial cells with H/R or sham treatment. *p < .05 versus sham, n = 4 per group.
Upregulation of TAK1 aggravates apoptosis of renal tubular epithelial cells with H/R treatment
Substantial evidence has indicated that tubular cell apoptosis contributes to the pathogenesis of AKI, which plays an important role in renal fibrosis [Citation18]. Therefore, we examined the effect of vehicle and TAK1 overexpression transfection treatment on apoptosis of renal tubular epithelial cell with sham or H/R treatment. We observed apoptotic cell death with TUNEL (), as well as cell apoptosis ratio with flow cytometry analysis (), in renal tubular epithelial cells after H/R treatment. Results showed that TUNEL-positive cells in renal tubular epithelial cells following H/R treatment were increased significantly. In addition, the number of TUNEL positive-cells were markedly increased in TAK1 overexpression transfection cells treated with H/R compared with vehicle cells (). The flow cytometry analysis data also showed that TAK1 overexpression aggravated the apoptosis ratio of renal tubular epithelial cells with H/R treatment ().
Figure 5. Upregulation of TAK1 aggravates apoptosis of renal tubular epithelial cells with H/R treatment. (A) TUNEL assay of apoptosis with mouse renal tubular epithelial cells. (B) Quantitative analysis of apoptosis ratio from vehicle and TAK1 overexpression plasmid transfected mouse renal tubular epithelial cells with sham or H/R treatment. *p < .05 versus vehicle sham; +p < .05 versus TAK1 overexpression H/R; #p < .05 versus vehicle H/R, n = 4 each. (C) Flow cytometry of apoptosis rate with mouse renal tubular epithelial cells. (D) The percentage of apoptotic cells from vehicle and TAK1 overexpression plasmid transfected mouse renal tubular epithelial cells with sham or H/R treatment. *p < .05 versus vehicle sham; +p < .05 versus TAK1 overexpression H/R; #p < .05 versus vehicle H/R, n = 4 each. (E) Representative western blots show Bax and cleaved caspase 3 protein levels in the renal tubular epithelial cells of mice with H/R or sham treatment after TAK1 overexpression plasmid or vehicle transfection. (F) Quantitative analysis of Bax protein levels in the renal tubular epithelial cells. *p < .05 versus vehicle sham; +p < .05 versus TAK1 overexpression H/R; #p < .05 versus vehicle H/R, n = 4 each. (G) Quantitative analysis of cleaved caspase 3 protein levels in the renal tubular epithelial cells. *p < .05 versus vehicle sham; +p < .05 versus TAK1 overexpression H/R; #p < .05 versus vehicle H/R, n = 4 each.
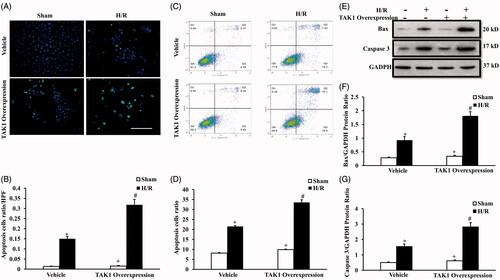
We next investigated the effect of TAK1 overexpression on Bax expression and caspase-3 activation of renal tubular epithelial cells with H/R treatment with western blot (). The results revealed Bax and cleaved caspase-3 were induced in renal tubular epithelial cells following H/R treatment. In addition, TAK1 overexpression significantly increased the protein levels of Bax () and cleaved caspase-3 () in renal tubular epithelial cells with H/R treatment.
Upregulation of TAK1 aggravates collagen I and fibronectin expression and p38 phosphorylation of renal tubular epithelial cells with H/R treatment
To dissect the role of TAK1 in IR-induced renal fibrosis, we next examined the effect of TAK1 overexpression on the expression of collagen I and fibronectin in the renal tubular epithelial cell after H/R treatment with western blot (). Western blot analysis demonstrated that TAK1 overexpression exacerbated the upregulation of collagen I and fibronectin protein in the renal tubular epithelial cells after H/R treatment ().
Figure 6. Upregulation of TAK1 aggravates collagen I and fibronectin expression and p38 phosphorylation of renal tubular epithelial cells with H/R treatment. (A) Representative western blots show collagen I and fibronectin protein levels in the renal tubular epithelial cells of mice with H/R or sham treatment after TAK1 overexpression plasmid or vehicle transfection. (B) Quantitative analysis of collagen I protein levels in the renal tubular epithelial cells. *p < .05 versus vehicle sham; +p < .05 versus TAK1 overexpression H/R; #p < 05 versus vehicle H/R, n = 4 each. (C) Quantitative analysis of fibronectin protein levels in the renal tubular epithelial cells. *p < .05 versus vehicle sham; +p < .05 versus TAK1 overexpression H/R; #p < .05 versus vehicle H/R, n = 4 each. (D) Representative western blots show phosphorylation levels of p38 in the renal tubular epithelial cells of mice with H/R or sham treatment after TAK1 overexpression plasmid or vehicle transfection. (E) Quantitative analysis of phosphorylation levels of p38 in the renal tubular epithelial cells. *p < .05 versus vehicle sham; +p < .05 vs. TAK1 overexpression H/R; #p < .05 versus vehicle H/R, n = 4 each.
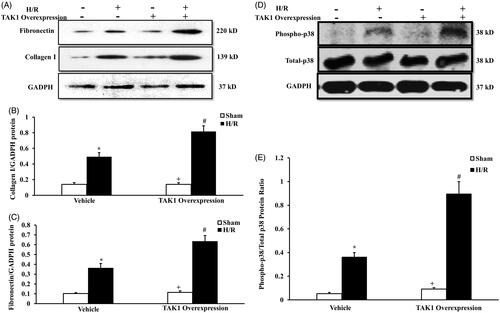
To further verify the effect of TAK1 on p38 activation in H/R-treated renal tubular epithelial cells, we detected the phosphorylation of p38 in the renal tubular epithelial cell treated with vehicle or TAK1 overexpression after H/R treatment with western blot (). Western blot analysis demonstrated that TAK1 overexpression exacerbated the phosphorylation of p38 in the renal tubular epithelial cells after H/R treatment ().
TAK1-mediated apoptosis and induced fibrosis via p38 activation in renal tubular epithelial cells treated with H/R
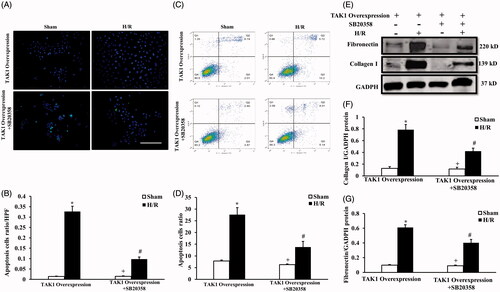
To dissect TAK1 via p38 activation mediated apoptosis and induced fibrosis in renal tubular epithelial cells treated with H/R, we examined the effect of H/R treatment on renal tubular epithelial cell apoptosis in the condition of TAK1 overexpression or TAK1 overexpression plus p38 specific inhibitor using TUNEL staining () and flow cytometry analysis (). The results of TUNEL () and flow cytometry analysis () showed that inhibition of p38 activation alleviated the increase in apoptosis of renal tubular epithelial cells with H/R treatment in the TAK1 overexpression condition. We next detected the effect of H/R treatment on collagen I and fibronectin protein of renal tubular epithelial cell apoptosis in the condition of TAK1 overexpression or TAK1 overexpression plus p38 specific inhibitor using western blot method (). Western blot analysis demonstrated that inhibition of p38 activation alleviated the increase in collagen I and fibronectin protein of renal tubular epithelial cells with H/R treatment in the TAK1 overexpression condition (). These data suggest that TAK1 via p38 activation mediated apoptosis and induced fibrosis in renal tubular epithelial cells treated with H/R.
Figure 7. TAK1-mediated apoptosis and induced fibrosis via p38 activation in renal tubular epithelial cells treated with H/R. (A) TUNEL assay of apoptosis with mouse renal tubular epithelial cells. (B) Quantitative analysis of apoptosis ratio from TAK1 overexpression plasmid transfected mouse renal tubular epithelial cells plus vehicle or SB20358 with sham or H/R treatment. *p < .05 versus TAK1 overexpression sham; +p < .05 versus TAK1 overexpression + SB20358 H/R; #p < .05 versus TAK1 overexpression H/R, n = 4 each. (C) Flow cytometry of apoptosis rate with mouse renal tubular epithelial cells. (D) The percentage of apoptotic cells from TAK1 overexpression plasmid transfected mouse renal tubular epithelial cells plus vehicle or SB20358 with sham or H/R treatment. *p < .05 versus TAK1 overexpression sham; +p < .05 versus TAK1 overexpression + SB20358 H/R; #p < .05 versus TAK1 overexpression H/R, n = 4 each. (E) Representative western blots show collagen I and fibronectin protein levels in the renal tubular epithelial cells of mice with H/R or sham treatment after TAK1 overexpression plasmid transfection plus SB20358 or vehicle. (F) Quantitative analysis of collagen I protein levels in the renal tubular epithelial cells. *p < .05 versus TAK1 overexpression sham; +p < .05 versus TAK1 overexpression + SB20358 H/R; #p < .05 versus TAK1 overexpression H/R, n = 4 each. (G) Quantitative analysis of fibronectin protein levels in the renal tubular epithelial cells. *p < .05 versus TAK1 overexpression sham; +p < .05 versus TAK1 overexpression + SB20358 H/R; #p < .05 versus TAK1 overexpression H/R, n = 4 each.
Discussion
AKI can induce CKD, which typically presents pathologically as renal fibrosis [Citation19]. As a major cause of AKI, IR-induced renal fibrosis deserves greater attention in both the research and clinical setting. Myofibroblasts have been shown to contribute significantly to the production of ECM proteins and the development of renal fibrosis. Although the research on myofibroblasts remains controversial, a large number of in vitro and in vivo experiments have shown that renal epithelial differentiate into myofibroblasts, as well as produce a large amount of ECM via the action of cytokines, which play a role in renal fibrosis [Citation20–22]. However, the molecular mechanisms of myofibroblasts in renal fibrosis are not defined. Transforming growth factor-β is a pleiotropic cytokine that has been established as a central mediator of kidney fibrosis [Citation23]. There is a growing body of evidence indicating that the TGF-β signaling pathway is seemingly important and an attractive molecular target mediated complex scheme of signaling networks in the development of renal fibrosis [Citation24,Citation25]. TGF-β-activated kinase 1 (TAK1) has been emerged as a critical downstream of signaling pathway of TGF-β [Citation24,Citation26], but at present, the role of TAK1 in the pathogenesis of renal fibrosis remains poorly understood. In this study, we observed the role of TAK1 in the pathogenesis of IR-induced renal fibrosis in vitro and vivo. We have demonstrated the following: (1) Inhibition of TAK1 alleviates ischemia-induced renal fibrosis; (2) Inhibition of TAK1 decrease apoptotic cell death and p38 phosphorylation in the pathological process of IR-induced renal fibrosis; (3) Upregulation of TAK1 aggravates apoptosis, fibrosis and p38 phosphorylation in vitro; (4) Inhibition of p38 activation alleviated the apoptosis and fibrosis with H/R treatment mediated by TAK1 in vitro. These data indicate that TAK1 play an important role in the mechanism of IR-induced renal fibrosis pathogenesis by regulating apoptosis via p38 signaling pathway.
Our previous studies have shown that TAK1 was implicated in the processes of inflammation and renal fibrosis [Citation27]. In order to confirm whether TAK1 has a key role in the process of IR-induced renal fibrosis, we applied the specific inhibitor of TAK1 and TAK1 overexpression vector to double authenticate the role of TAK1 using IR-induced renal fibrosis model in vivo and the experiment with renal tubular epithelial cells treated with H/R treatment in vitro. Our results showed that inhibition of TAK1 preserves renal function, ameliorates tubular damage and attenuates renal fibrosis after IR treatment. Although we presented TAK1 may act as a key factor in IR-induced renal fibrosis, the TAK1 expressing cell in vivo was not clear. The immunohistochemical results firstly showed TAK1 were expressed in renal tubular epithelial cells of mice treated with IR injury. Then, the results of co-immunohistochemistry verified the relationship between TAK1 and p38, TUNEL and p38 in renal tubular epithelial cells treated with H/R model. These data are the precondition of our hypothesis and the foundation of subsequent trails in vitro. Therefore, we next explore the effect on production of ECM proteins with TAK1 overexpression vector in H/R experiment with renal tubular epithelial cells in vitro. The results also indicated upregulation of TAK1 exacerbated the production of ECM proteins of renal tubular epithelial cells induced by H/R treatment. These data suggest that TAK1 plays a key role in renal fibrosis induced by IR.
Renal fibrosis is characterized not only by the accumulation of ECM but also by tubular cell atrophy. Hypoxia or drug toxicity leads to dedifferentiation and apoptosis of renal tubular epithelial cells and regulates profibrotic factors, such as TGF-β, which mediate fibroblast activation and recruit leukocytes, leading to the development of fibrosis [Citation15,Citation28]. Qi Z provided clear evidence that TAK1 was a key intracellular molecule participating in cell apoptosis death [Citation29]. Weng T demonstrated that modulation of apoptosis via TAK1 signaling pathway has been proposed to increase sensitivity to chemotherapy [Citation30]. Therefore, we speculated that TAK1 may mediate transdifferentiation from renal tubular epithelial cells to fibroblasts by regulating apoptosis of tubular epithelial cells. Our results showed that inhibition of TAK1 alleviates apoptosis of mice kidney with IR treatment, and upregulation of TAK1 aggravates apoptosis of renal tubular epithelial cells with H/R treatment. These data are in support of our hypothesis.
Research has identified a role for p38 signaling in renal cell apoptosis and the early inflammatory response in the obstructed kidney [Citation31]. Evidence suggests that chronic intermittent hypoxia induced renal injury involving inflammatory (NF-κB, TNF-α and IL-6), apoptotic (Bcl-2/Bax), and mitogen-activated protein kinases (phosphorylation of P38, ERK and JNK) signal transduction pathways [Citation32]. TGF-β 1 and TAK1-binding protein 1 cooperate to mediate TGF-β1-induced MKK3-p38 MAPK activation and stimulation of type I collagen [Citation33]. The previous studies established TAK1 as a major upstream activator of JNK, p38 and NF-κB signaling in the obstructed kidney, and they define a pathologic role for TAK1 in renal inflammation and fibrosis [Citation34]. Yet, there has not direct proofs regarding TAK1-mediated apoptosis via p38 signaling pathway in IR-induced renal fibrosis. In our study, we found that inhibition of TAK1 alleviates ischemia-induced renal fibrosis, and decreases apoptotic cell death and p38 phosphorylation in the pathological process of IR-induced renal fibrosis; Inhibition of p38 activation alleviated the apoptosis and fibrosis of tubular epithelial cell treated with H/R treatment mediated by TAK1 in vitro. These results show that TAK1 plays a critical role in the mechanism of IR-induced renal fibrosis pathogenesis. TAK1 is mediated by p38 signaling to regulate apoptosis in the pathogenesis of IR-induced renal fibrosis, which could constitute a novel therapeutic strategy for CKD induced by AKI.
Methods
Animals and IR treatment
The animal experiments were conducted according to the guidelines of laboratory animal care and were approved by the Institutional Animal Care and Use Committee of the First People Hospital of Foshan. BALB/c mice with TAK1 inhibitor or 0.9% normal saline received renal IR treatment or sham control, respectively. Forty-eight mice, 8–12 weeks old, 12 in each group, were implemented with renal IR model. The implementation of IR-induced AKI model steps are described as the reference [Citation19]. Sham control mice underwent an identical surgical procedure but without pedicle clamping. Six mice in each group were randomly chosen and had blood sampled (0.3 ml) from the orbital venous plexus and then were perfused and harvested kidneys at 24 h after IR treatment. The remaining six mice in each group were euthanized at 14 days after IR treatment. Kidneys were perfused and harvested.
Cell culture and experimental grouping
Mouse renal tubular epithelial cells (EpiCM-a) (Sciencell, San Diego, CA) were thawed in a 38 °C water bath and then centrifuged at 1000 rpm for 5 min. The supernatant was discarded and the cells were cultured in DMEM medium in an incubator containing 5% CO2 at 37 °C. The medium was replaced when cells adhered to the bottle wall. The cells were subcultured until the cells covered 80% of the bottle bottom. The cells with traces TAK1 overexpression plasmid or vehicle plasmid treatment were divided into four groups: Vehicle plasmid sham group, Vehicle plasmid H/R group, TAK1 overexpression plasmid sham group and TAK1 overexpression plasmid H/R group. The HR trial was performed as described previously, hypoxia 3 h or sham control for 72 h in each group [Citation35]. The cells with trail of p38 specific inhibitor (SB203580) and TAK1 overexpression plasmid treatment were divided into four groups: TAK1 overexpression plasmid sham group and TAK1 overexpression plasmid H/R group, TAK1 overexpression plasmid plus SB203580 sham group and TAK1 overexpression plasmid plus SB203580 H/R group. After TAK1 overexpression plasmid transfection for 24 h, cells were pre-treated with SB20358 (10 μM) 30 min before treatment with H/R or sham control model in each group.
TAK1 overexpression plasmid construction and cell transfection
The overexpression plasmid of the TAK1 gene was manufactured by Mingshanshang Medical Biotechnology Co., Ltd. (Guangzhou City, P.R. China). It was verified via polymerase chain reaction (PCR), restriction enzyme digestion, and DNA sequencing. One day before transfection, plate 0.5–2 × 10⁵ cells in 500 µl of growth medium without antibiotics so that cells will be 90–95% confluent at the time of transfection. Suspension cells: Just prior to preparing complexes, plate 4–8 × 10⁵ cells in 500 µl of growth medium without antibiotics. For each transfection sample, prepare complexes as follows: Dilute DNA in 50 µl of Opti-MEM® I Reduced Serum Medium without serum. Mix Lipofectamine™ 2000 gently before use, then dilute the appropriate amount in 50 µl of Opti-MEM® I Medium. Incubate for 5 min at room temperature. After the 5-min incubation, combine the diluted DNA with diluted Lipofectamine™ 2000 (total volume =100 µl). Mix gently and incubate for 20 min at room temperature. Add the 100 µl of complexes to each well containing cells and medium. Mix gently by rocking the plate back and forth. Incubate cells at 37 °C in a CO2 incubator prior to treat with H/R model.
Measurement of renal function
Serum creatinine was measured using a creatinine assay kit (BioAssay Systems, Hayward, CA) according to the manufacturer’s instructions. Blood urea nitrogen was detected fluorometrically as described [Citation36].
Renal morphology
Kidney tissue was fixed in 10% buffered formalin and embedded in paraffin, then cut at 4-μm thickness. After deparaffinization and rehydration, sections were stained with hematoxylin–eosin (HE). Tissue damage was examined in a blinded manner and scored according to a previous study [Citation37]. After deparaffinization and rehydration, sections were stained with Sirius red to evaluate collagen fibers, which were calculated as a percentage of the total area. The Sirius red-stained sections were scanned with a microscope digital camera (Nikon Instruments), and quantitative evaluation was performed using NIS-Elements Br 3.0 software, as described [Citation38].
Immunohistochemistry
Immunohistochemical staining was performed on paraffin sections. Antigen retrieval was performed with antigen unmasking solution (Vector Laboratories, Burlingame, CA). Slides were incubated with the primary antibody (TAK1, Abcam, Cambridge, UK) and appropriate secondary antibody for a suitable period of time after blocking. Immunohistochemical staining was performed using the Avidin Biotin Complex (ABC) method according to the protocol of the Vector ABC kit (Vector Laboratories). The images from these slides were acquired and analyzed by NIS Element software with a Nikon microscope imaging system.
Immunofluorescence
Renal tissues were embedded in OCT compound, snap-frozen on dry ice, cut at 5 μ m thickness and mounted. For immunofluorescence of collagen I or fibronectin in the kidneys, sections were blocked with protein block (Dako, Carpinteria, CA) and then incubated with rabbit anti-collagen I antibody (Rockland Immunochemicals, Gilbertsville, PA) or rabbit anti-fibronectin antibody (Sigma-Aldrich, St. Louis, MO) followed by Alexa-488 conjugated donkey anti-rabbit antibody (Invitrogen, Carlsbad, CA). For double immunofluorescence, the slides of cells were fixed and stained with rabbit anti-p38 (Santa Cruz Biotechnology) and mouse anti-TAK1 or TUNEL kits (Promega) followed by appropriate secondary antibodies sequentially. Slides were mounted with medium containing DAPI. Immunofluorescence was visualized using a microscope equipped with a digital camera (Nikon Instruments Inc., Melville, NY). Quantitative evaluation of sections stained was performed using NIS-Elements Br 3.0 software.
Western blot analysis
Protein was extracted using RIPA buffer containing cocktail proteinase inhibitors and quantified with a Bio-Rad protein assay. An equal amount of protein was separated on SDS-polyacrylamide gels in a Tris/SDS buffer system, and then transferred onto nitrocellulose membranes. Blotting was performed according to standard procedures with primary antibodies of phosphorylated p38, total p38, collagen I, fibronectin, Bax and cleaved caspase3 overnight followed by incubation with appropriate fluorescence-conjugated secondary antibodies. The proteins of interest were analyzed after film exposure, and signal intensities were quantified using NIH Image/J software.
TUNEL assay with cells
Cells were added into 96-well plates (100 μL/well; 2 × 10⁴ cells/well) and incubated overnight, followed by cell transfection. After cells were treated with H/R or sham, the medium was discarded and cells were fixed with 4% paraformaldehyde. The cells were incubated at room temperature for 30 min and washed with PBS. Permeabilization solution (0.1% Triton X-100 dissolved in 0.1% sodium citrate solution) was added into plates for a 2-min incubation in an ice-bath. With the addition of 50 μL TUNEL reagent, the cells were cultured in a humidified incubator at 37 °C for 60 min. After three PBS washes, 50 μL of DAPI was added to the cells, followed by incubation at 37 °C in the dark and another three PBS washes. Cells were observed under a fluorescence microscope and images were captured.
Flow cytometry analysis
An Annexin V-PE and 7-AAD (7-amino-actinomycin D) double-staining Apoptosis Detection kit (KeyGEN, Nanjing, China) was used to detect apoptotic activity according to the manufacturer’s instructions. The cells were subjected to FACS analysis within an hour using CellQuest software version 3.3.
Statistical analyses
All datawere expressed as mean ± SEM. Multiple group comparisons were performed by ANOVA followed by the Bonferroni procedure for comparison of means. p < .05 was considered statistically significant.
Disclosure statement
The authors declared that they have no conflicts of interest to this work. We declare that we do not have any commercial or associative interest that represents a conflict of interest in connection with the work submitted.
Additional information
Funding
References
- Webster AC, Nagler EV, Morton RL, et al. Chronic kidney disease. Lancet. 2017;389:1238–1252.
- Farris AB, Colvin RB. Renal interstitial fibrosis: mechanisms and evaluation. Curr Opin Nephrol Hypertens. 2012;21:289–300.
- Zeisberg M, Neilson EG. Mechanisms of tubulointerstitial fibrosis. J Am Soc Nephrol. 2010;21:1819–1834.
- Rastaldi MP, Ferrario F, Giardino L, et al. Epithelial-mesenchymal transition of tubular epithelial cells in human renal biopsies. Kidney Int. 2002;62:137–146.
- Gong Q, Hou F. Silencing of angiotensin II type-1 receptor inhibits high glucose-induced epithelial-mesenchymal transition in human renal proximal tubular epithelial cells via inactivation of mTOR/p70S6K signaling pathway. Biochem Biophys Res Commun. 2016;469:183–188.
- Rhyu DY, Yang Y, Ha H, et al. Role of reactive oxygen species in TGF-beta1-induced mitogen-activated protein kinase activation and epithelial-mesenchymal transition in renal tubular epithelial cells. J Am Soc Nephrol. 2005;16:667–675.
- Xiao Y, Liu J, Peng Y, et al. GSTA3 attenuates renal interstitial fibrosis by inhibiting TGF-Beta-induced tubular epithelial-mesenchymal transition and fibronectin expression. PLoS One. 2016;11:e0160855.
- Ferenbach DA, Bonventre JV. Mechanisms of maladaptive repair after AKI leading to accelerated kidney ageing and CKD. Nat Rev Nephrol. 2015;11:264–276.
- Roberts V, Campbell DJ, Lu B, et al. The differential effect of apyrase treatment and hCD39 overexpression on chronic renal fibrosis after ischemia-reperfusion injury. Transplantation. 2017;101:e194–e204.
- Guo J, Guan Q, Liu X, et al. Relationship of clusterin with renal inflammation and fibrosis after the recovery phase of ischemia-reperfusion injury. BMC Nephrol. 2016;17:133.
- Ding Y, Choi ME. Regulation of autophagy by TGF-β: emerging role in kidney fibrosis. Semin Nephrol. 2014;34:62–71.
- Sureshbabu A, Muhsin SA, Choi ME. TGF-β signaling in the kidney: profibrotic and protective effects. Am J Physiol Renal Physiol. 2016;310:F596–F606.
- Mihaly SR, Ninomiya-Tsuji J, Morioka S. TAK1 control of cell death. Cell Death Differ. 2014;21:1667–1676.
- Liu Z, Lu Y, Xiao Y, et al. Upregulation of miR-21 expression is a valuable predicator of advanced clinicopathological features and poor prognosis in patients with renal cell carcinoma through the p53/p21-cyclin E2-Bax/caspase-3 signaling pathway. Oncol Rep. 2017;37:1437–1444.
- Zhou X, Bai C, Sun X, et al. Puerarin attenuates renal fibrosis by reducing oxidative stress induced-epithelial cell apoptosis via MAPK signal pathways in vivo and in vitro. Ren Fail. 2017;39:423–431.
- Wang Y, Zhang J, Zhang L, et al. Adiponectin attenuates high glucose-induced apoptosis through the AMPK/p38 MAPK signaling pathway in NRK-52E cells. PLoS One. 2017;12:e0178215.
- Yuen CM, Yeh KH, Wallace CG, et al. EPO-cyclosporine combination therapy reduced brain infarct area in rat after acute ischemic stroke: role of innate immune-inflammatory response, micro-RNAs and MAPK family signaling pathway. Am J Transl Res. 2017;9:1651–1666.
- Liang H, Zhang Z, He L, et al. CXCL16 regulates cisplatin-induced acute kidney injury. Oncotarget. 2016;7:31652–31662.
- Zhou J, Zhong J, Lin S, et al. Inhibition of PTEN activity aggravates post renal fibrosis in mice with ischemia reperfusion-induced acute kidney injury. Cell Physiol Biochem. 2017;43:1841–1854.
- Erikci A, Ucar G, Yabanoglu-Ciftci S. Role of serotonin in the regulation of renal proximal tubular epithelial cells. Ren Fail. 2016;38:1141–1150.
- Liu Q, Liu S, Shi Y, et al. Suppressors of cytokine signaling inhibit tubular epithelial cell-myofibroblast transdifferentiation. Am J Nephrol. 2011;34:142–151.
- Rodrigues-Diez R, Rodrigues-Diez RR, Lavoz C, et al. Gremlin activates the Smad pathway linked to epithelial mesenchymal transdifferentiation in cultured tubular epithelial cells. Biomed Res Int. 2014;2014:802841.
- Chen WD, Yeh JK, Peng MT, et al. Circadian CLOCK mediates activation of transforming growth factor-β signaling and renal fibrosis through cyclooxygenase 2. Am J Pathol. 2015;185:3152–3163.
- Choi ME, Ding Y, Kim SI. TGF-β signaling via TAK1 pathway: role in kidney fibrosis. Semin Nephrol. 2012;32:244–252.
- Kim SI, Choi ME. TGF-β-activated kinase-1: new insights into the mechanism of TGF-β signaling and kidney disease. Kidney Res Clin Pract. 2012;31:94–105.
- Yu J, Zhang F, Wang S, et al. TAK1 is activated by TGF-β signaling and controls axonal growth during brain development. J Mol Cell Biol. 2014;6:349–351.
- 8. Wu H, Zhou J, Ou W, et al. TAK1 as the mediator in the protective effect of propofol on renal interstitial fibrosis induced by ischemia/reperfusion injury. Eur J Pharmacol. 2017;811:134–140.
- Salvadori M, Rosso G, Bertoni E. Update on ischemia-reperfusion injury in kidney transplantation: pathogenesis and treatment. World J Transplant. 2015;5:52–67.
- Qi Z, Shen L, Zhou H, et al. Phosphorylation of heat shock protein 27 antagonizes TNF-α induced HeLa cell apoptosis via regulating TAK1 ubiquitination and activation of p38 and ERK signaling. Cell Signal. 2014;26:1616–1625.
- Weng T, Koh CG. POPX2 phosphatase regulates apoptosis through the TAK1-IKK-NF-κB pathway. Cell Death Dis. 2017;8:e3051.
- Ma FY, Tesch GH, Flavell RA, et al. MKK3-p38 signaling promotes apoptosis and the early inflammatory response in the obstructed mouse kidney. Am J Physiol Renal Physiol. 2007;293:F1556–F1563.
- Wu X, Gu W, Lu H, et al. Soluble receptor for advanced glycation end product ameliorates chronic intermittent hypoxia induced renal injury, inflammation, and apoptosis via P38/JNK signaling pathways. Oxid Med Cell Longev. 2016;2016:1015390.
- Kim SI, Kwak JH, Zachariah M, et al. TGF-beta-activated kinase 1 and TAK1-binding protein 1 cooperate to mediate TGF-beta1-induced MKK3-p38 MAPK activation and stimulation of type I collagen. Am J Physiol Renal Physiol. 2007;292:F1471–F1478.
- Ma FY, Tesch GH, Ozols E, et al. TGF-β1-activated kinase-1 regulates inflammation and fibrosis in the obstructed kidney. Am J Physiol Renal Physiol. 2011;300:F1410–F1421.
- Chen H, Huang RS, Yu XX, et al. Emodin protects against oxidative stress and apoptosis in HK-2 renal tubular epithelial cells after hypoxia/reoxygenation. Exp Ther Med. 2017;14:447–452.
- Ramesh G, Zhang B, Uematsu S, et al. Endotoxin and cisplatin synergistically induce renal dysfunction and cytokine production in mice. Am J Physiol Renal Physiol. 2007;293:F325–F332.
- Chen G, Lin SC, Chen J, et al. CXCL16 recruits bone marrow-derived fibroblast precursors in renal fibrosis. J Am Soc Nephrol. 2011;22:1876–1886.
- Yang J, Chen J, Yan J, et al. Effect of interleukin 6 deficiency on renal interstitial fibrosis. PLoS One. 2012;7:e52415.