
Abstract
Surgical resection remains the preferred approach for some patients with glioblastoma (GBM), and eradication of the residual tumour niche after surgical resection is very helpful for prolonging patient survival. However, complete surgical resection of invasive GBM is difficult because of its ambiguous boundary. Herein, a novel targeting material, c(RGDyk)-poloxamer-188, was synthesized by modifying carboxyl-terminated poloxamer-188 with a glioma-targeting cyclopeptide, c(RGDyk). Quantum dots (QDs) as fluorescent probe were encapsulated into the self-assembled c(RGDyk)-poloxamer-188 polymer nanoparticles (NPs) to construct glioma-targeted QDs-c(RGDyk)NP for imaging-guided surgical resection of GBM. QDs-c(RGDyk)NP exhibited a moderate hydrodynamic diameter of 212.4 nm, a negative zeta potential of –10.1 mV and good stability. QDs-c(RGDyk)NP exhibited significantly lower toxicity against PC12 and C6 cells and HUVECs than free QDs. Moreover, in vitro cellular uptake experiments demonstrated that QDs-c(RGDyk)NP specifically targeted C6 cells, making them display strong fluorescence. Combined with ultrasound-targeted microbubble destruction (UTMD), QDs-c(RGDyk)NP specifically accumulated in glioma tissue in orthotropic tumour rats after intravenous administration, evidenced by ex vivo NIR fluorescence imaging of bulk brain and glioma tissue sections. Furthermore, fluorescence imaging with QDs-c(RGDyk)NP guided accurate surgical resection of glioma. Finally, the safety of QDs-c(RGDyk)NP was verified using pathological HE staining. In conclusion, QDs-c(RGDyk)NP may be a potential imaging probe for imaging-guided surgery.
Introduction
Glioblastoma (GBM) is the most common primary malignant tumour of the central nervous system (CNS) and accounts for 80% of all malignant brain tumours [Citation1]. GBM easily metastasizes and is refractory to treatment, and GBM patients exhibit high recurrence and mortality rates and poor prognosis. For patients with GBM, the median overall survival is 15–23 months, and the 5-year survival is less than 6% [Citation2]. Currently, the standard treatment for newly diagnosed GBM is surgery with radiotherapy and concomitant and adjuvant temozolomide [Citation3]. However, because of tumour invasive growth and peri-tumour brain oedema, the ambiguous boundary between GBM cells and normal brain tissue cells usually result in incomplete removal of the tumour during surgery, ultimately leading to a poor prognosis [Citation4–6]. Accurate identification of the primary glioma border and metastatic tumour cells is not only the primary factor in complete resection but also the key factor in preventing the recurrence of glioma [Citation7]. At present, glioma resection typically requires preoperative localization with the help of computed tomography (CT) and magnetic resonance imaging (MRI), and the CT and MR images are guides for surgical resection. Although the images can indicate the location and size of the tumour and peri-tumour oedema, a major limitation of this technique is the phenomenon of intraoperative brain shift, which leads to alternation of the preoperative anatomy during tumour resection and a reduction in accuracy [Citation8]. Therefore, combined, multimodal imaging for glioma surgical resection has become a hot research topic in recent years. For example, Doglietto et al. combined the fluorescent substance 5-aminolevulinic acid (5-ALA) with a high-definition, three-dimensional exoscope for glioma surgical resection, and Martinez-Moreno et al. combined 5-ALA with a handheld spectroscopic probe for glioma surgical resection [Citation9,Citation10]. Although many studies have used fluorescent substances, such as 5-ALA and fluorescein sodium, to guide resection of glioma, there are still some unsolved problems, such as poor fluorescence stability and low fluorescence efficiency [Citation11].
As an alternative, quantum dots (QDs) are inorganic, nano-sized fluorescent probes that have many advantages, such as good fluorescent signal and stability, a broad excitation spectrum and a narrow emission spectrum [Citation12], and have been applied to label specific cells and tissues to achieve multicolour bioimaging [Citation13,Citation14]. Due to poor organic biocompatibility, lipid-soluble QDs are liable to accumulate in the body and are not easy to excrete and thus are not used in for detection in living organisms [Citation15]. Instead, water-soluble QDs have good biocompatibility and can be directly applied in the body [Citation16]. However, the core–shell structure of water-soluble QDs is susceptible to physicochemical characteristics and environmental influence, such as QD size [Citation17], oxidative damage and ultraviolet light [Citation18,Citation19], resulting in cell toxicity, which limits the application of QDs in tracing and detection of tumours and other major diseases. Nevertheless, nanotechnology can be used to overcome the aforementioned limitations. QD delivery to cancer sites can be enhanced by the enhanced permeability and retention (EPR) effect [Citation20]. It has been found that water-soluble QDs combined with nanocarriers exhibit improved physical stability, maintain their fluorescence properties and have greatly reduced biotoxicity [Citation15,Citation21]. Additionally, it has been demonstrated that intravenous administration of nanoparticles (NPs) can improve drug penetration to the CNS by increasing blood–brain barrier (BBB) permeability [Citation22–25]. If nanocarriers are modified with targeting molecules, it is expected that they can be used for tracing tumours in vivo [Citation26].
Fortunately, glioma cells express αvβ3 integrins, which can specifically bind with a synthetic peptide containing an arginine–glycine–aspartic acid (RGD) sequence [Citation27,Citation28]. It has been found that compared with the linear peptide, cyclic RGD short chain polypeptide c(RGDyk) has a better affinity for integrins and can be used as a highly selective αvβ3 inhibitor to work better in against brain glioma activity [Citation29–31]. However, application of c(RGDyk) in vivo is problematic because of the BBB. The BBB consists of tight junctions between endothelial cells of the cerebral vasculature and limits transfer of blood-borne drugs into the brain and consequently brain tumours [Citation32]. Furthermore, it is worth noting that the BBB is always leaky in the malignant brain tumour centre, the well-vascularized actively proliferating tumour edge and the normal brain tissue adjacent to the tumour despite complex barrier integrity [Citation33]. As mentioned above, it is likely to enhance drug delivery across the BBB with nanotechnology, but the enhancement is expected to be limited considering the characteristics of the BBB. Therefore, the issue of the BBB has received considerable critical attention. Interestingly, it has been reported that ultrasound-targeted microbubble destruction (UTMD) technology, which combines low-intensity ultrasound (US) with microbubbles (MBs), can induce a reversible, non-invasive, local and transient disruption in the BBB [Citation34–36]. After MBs with NPs carrying drugs enter the vessels of the brain through the body circulation, it can cause continuous blasting under localized US and form a cavitation with high velocity turbulence and jet, high temperature and high pressure, leading to mechanical expansion of blood vessels, which can disrupt the tight connections between capillaries to open the BBB and prompt targeted penetration of NPs carrying drugs into the brain [Citation37–39]. Overall, based on previous studies, if c(RGDyk) is used as a targeted ligand modified to NPs, with the help of BBB opening technology and QDs efficient trace technology, it may play a role in the effective binding of glioma cells and guide surgical resection.
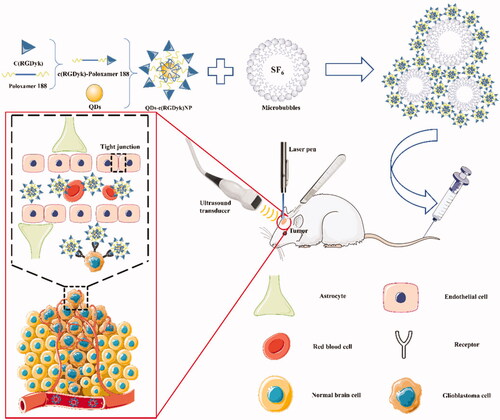
The purpose of this study was to develop a novel strategy for glioma tracing and to carry out accurate surgical treatment under its guidance (). Combined with UTMD technology in reversible BBB opening, QDs-c(RGDyk)NP can be transferred into the brain, realizing highly efficient glioma-targeted QD tracing. In this study, C6 glioma cells were used as a standard cell model of GBM [Citation40]. Specifically, this study had three main objectives: (1) to evaluate the various physicochemical and in vitro biological characteristics of QDs-c(RGDyk)NP, (2) to study the effect of combined UTMD and QDs-c(RGDyk)NP on the in vivo biodistribution of QDs in a rat model with glioma and (3) to evaluate residual glioma under empirical surgery and QD-guided surgery. Based on the above findings, comprehensively evaluate and summarize the safety and efficacy of UTMD technology combined with QDs-c(RGDyk)NP to trace glioma cells, and analyse its deep mechanism, and finally, the application of UTMD technology combined with QDs-c(RGDyk)NP in the application of body tracing to guide glioma surgery is designed.
Figure 1. Schematic diagram illustrating accurate tracing of glioma in the brain using the UTMD technique combined with QD-loaded nanoparticles to guide glioma surgery.
Materials and methods
Materials
ZnCdSe/ZnS QDs were provided by JiaYuan Quantum Dots Co., Ltd. (Wuhan, China). Poloxamer 188, morpholineethanesulphonic acid (MES), 1-ethyl-3-(3-dimethylaminopropyl)-carbodiimide (EDC) and N-hydroxy-succinimide (NHS) were purchased from Aladdin Bio-Chem Technology Co., Ltd. (Shanghai, China). c(RGDyk) was purchased from GL Bio-Chem Co., Ltd. (Shanghai, China). C6 cells were obtained from the Institute of Biochemistry and Cell Biology, Shanghai Institutes for Biological Sciences, Chinese Academy of Sciences (Shanghai, China). Cell counting kit-8 (CCK-8) was purchased from Dojindo (Minato-ku, Japan). Dulbecco's modified Eagle’s medium (DMEM) (high glucose) cell culture medium was purchased from Life Technologies (Grand Island, NY). Sulphur hexafluoride (SF6) MBs for injection were purchased from Bracco Co., Ltd. (Milan, Italy). Rabbit anti-GFAP antibody was purchased from Abcam Trading Co., Ltd. (Shanghai, China). The other reagents were obtained from commercial sources.
Synthesis of c(RGDyk)-poloxamer 188
COOH-terminated poloxamer 188 was first synthesized using the following procedure. Poloxamer 188 (9.01 g), succinic anhydride (0.54 g), 4-dimethylaminopyridine (0.27 g) and triethylamine (0.5 ml) were dissolved in anhydrous 1,4-dioxane (30 ml) and stirred at room temperature overnight. The reaction liquid was then dialysed against deionized water for three days at room temperature using a dialysis bag (MWCO = 3500 Da) to obtain purer carboxylated poloxamer 188 (blank-NP) solutions. Finally, the lyophilizate was obtained by freeze-drying under vacuum conditions for two days in a freeze dryer.
c(RGDyk)-poloxamer 188 was then synthesized using the following procedure. MES (0.1 g) was dissolved in distilled water (10 ml) and stirred for 10 min. EDC (0.4 g) and NHS (0.2 g) were added to the solution and stirred until the solutes were completely dissolved in the distilled water. Then, blank-NP (0.30 g) and c(RGDyk) (0.02 g) were added and stirred well for 24 h at room temperature. The dialysis and lyophilization methods were the same as those used for preparation of COOH-terminated poloxamer 188.
The structures of COOH-terminated poloxamer 188 and c(RGDyk)-poloxamer 188 were confirmed with FI-TC and 1H NMR. The samples were prepared by pressing with KBr powder, the background from a blank KBr pellet was deducted, and samples were analysed by FI-TC. The scanning range was 4000–800 cm−1, the resolution was 4 cm−1, and the accuracy of peak reading was 0.01 cm−1. 1H NMR analysis was performed on a Bruker AV-600 NMR (Billerica, MA), and all samples were treated with DMSO-d6.
Preparation of QDs-c(RGDyk)NP
In this study, QDs-c(RGDyk)NP was prepared via film hydration followed by sequential extrusion. Briefly, c(RGDyk)-poloxamer 188, blank-NP and QDs were dissolved in absolute ethanol at a mass ratio of 8:32:5. The organic solvent was evaporated via rotary evaporation at room temperature, and a homogenous dry film was obtained after drying in a vacuum for 24 h. The dry film was hydrated using distilled water at room temperature, and the solution was further processed via Probe Sonication (100 W, on 2 s, off 3 s, total 5 min). Afterward, the solution was extruded through a polycarbonate membrane with a pore size of 0.45 μm to remove any dust. All of the above steps were carried out in the dark. QDs-poloxamer 188 was prepared using a procedure similar to that described above but without addition of c(RGDyk)-poloxamer 188.
Characterization of QDs-c(RGDyk)NP
Size and zeta potential of QDs-c(RGDyk)NP
The hydrodynamic sizes and zeta potential values of QDs, QDs-poloxamer 188 and QDs-c(RGDyk)NP were determined with Series Particle Analysers (Litesizer™ 500, Anton Paar GmbH, Shanghai, China) at 25 °C and a scattering angle of 90°. The concentration of the QD formulations was 100 nmol/l.
Morphology of QDs-c(RGDyk)NP
Particle size measurements and morphological examination of QDs-poloxamer 188 and QDs-c(RGDyk)NP were performed via transmission electron microscopy (TEM) (JEM1200EX, Tokyo, Japan). The samples were dripped into a copper net for 5 min and then sucked away. After the copper was dried, the samples were observed via TEM.
Fluorescence stability of QDs-c(RGDyk)NP
The spectra of QDs, QDs-poloxamer 188 and QDs-c(RGDyk)NP were first collected using a fluorescence spectrophotometer (RF-6000, Shimadzu, Kyoto, China). The excitation wavelength was set at 450 nm, the scanning wavelength range was 450–750 nm with a 1.0-nm scanning interval, and the scanning speed was 2000 nm/min.
To detect the fluorescence stability of QDs-c(RGDyk)NP under different pH conditions, different QD formulations were dissolved in PBS at pH 6.0, 7.0 and 7.4 and then injected into 96-well plates at 200 μl per well. After 24 h, the fluorescence intensity of each well was measured with a Microplate Reader (MultiskanMK3, Thermo, Waltham, MA) at an excitation wavelength of 450 nm and an emission wavelength of 610 nm. The solution concentration of the QD formulations mentioned above was 50 nmol/l.
In vitro cytotoxicity assay of QDs-c(RGDyk)NP
The in vitro cell viability of C6 glioma cells exposed to different formulations was assessed using a CCK-8 kit. C6 cells were seeded into 96-well plates at a seeding density of 3000 cells per well and incubated for 24 h in 0.1 ml F12K medium supplemented with 10% FBS in a humidified incubation chamber at 37 °C with 5% CO2. PC12 cells and HUVECs were treated as described above but incubated in DMEM. The medium was then replaced with fresh medium containing QDs, QDs-poloxamer 188 or QDs-c(RGDyk)NP at various QD concentrations ranging from 5 nmol/l to 40 nmol/l. The blank-NP was served as a control and was added at concentrations ranging from 5 μg/ml to 40 μg/ml. After 24 h of incubation, 10 μl CCK-8 and 90 μl medium were added into each well. After 2 h, the absorption at 450 nm was measured using a microplate reader.
Targeting of QDs-c(RGDyk)NP towards glioma in vitro
C6 cells were seeded on coverslips in six-well plates at a density of 1 × 10⁵ cells per well. After incubation in an incubator at 37 °C for 24 h, each well was treated with QDs, QDs-poloxamer 188 or QDs-c(RGDyk)NP at a QD concentration of 30 nmol/l. Cells treated with blank-NP served as a control with a set concentration of 30 μg/ml. In addition, some wells were pre-treated with 10 μg/ml or 30 μg/ml c(RGDyk) solution, and 2 h later, 30 nmol/l QDs-c(RGDyk)NP was added to these wells. After incubation for 0.5 h or 1.5 h, the cells were rinsed with PBS (0.01 M), fixed with 4% paraformaldehyde and rinsed with PBS (0.01 M) again. For qualitative analysis, cells were stained with DAPI (1 mg/ml) before observation with a fluorescence microscope (ECLIPSE NI, Nikon, Tokyo, Japan). The fluorescence intensities were analysed with ImageJ software (V1.8.0).
In vivo imaging of glioma using QDs-c(RGDyk)NP combined with UTMD
Construction of the glioblastoma model
Adult male Sprague-Dawley (SD) rats (200–280 g) were purchased from the Laboratory Animal Centre of Wenzhou Medical University and housed in an animal facility. The animal facility maintained a temperature- and light-controlled environment with an alternating 12 h light/dark cycle. The in situ glioma model was established according to a previously reported method [Citation41]. In brief, C6 cells were harvested with trypsin and resuspended for intracranial implantation. SD rats were deeply anaesthetized via an intraperitoneal injection of 10% chloral hydrate (350 mg/kg) and immobilized in a stereotactic head frame (KOPF900, David Kopf, Tujunga, CA). After the hair on the head of the rats was shaved, a sagittal incision was made with a sterile blade in the skin covering the calvarium, and a small dental drill was used to create a hole (approximately 1.0 mm in diameter) in the cranium 1.0 mm posterior to the bregma and 3 mm lateral to the sagittal suture (right hemisphere of the brain). In the above operation, care was taken to ensure that the dura mater was not damaged. C6 cells in suspension (approximately 1 × 10⁶/10 μl) were implanted into the hole with a microinjection syringe. The needle fell 6.0 mm followed by a 1.0-mm rise perpendicular to the hole, and thus, the net depth of the microinjection syringe in the hole was 5.0 mm from the calvarium surface. The C6 cells were injected slowly, and the injection process was completed in approximately 5 min. The needle was pulled out slowly after its placement was maintained for another 5 min. The hole was closed with bone wax, and the skin was sutured together. The operation was performed under aseptic conditions, and the surgical site was disinfected. Three days after the operation, each SD rat was injected with antibiotics (0.1 ml/d) to prevent infection. The growth of rat brain tumours was evaluated using MRI. MRI images were acquired using a 3T MRI system (TRIO 3-TMRI, Siemens AG MAGNETOM, Erlangen, Germany) using the standard wrist coil (Chenguang Medical Technologies Company, Shanghai, China) with an inside diameter of 13 cm. Tumour progression was assessed 5 days after cell implantation. SD rats were anaesthetized with chloral hydrate (350 mg/kg) 5 min before the MRI procedure. The tumour location was determined by performing a gradient echo FLASH sequence to acquire T1W images with the following imaging parameters: pulse repetition time (TR)/echo time (TE) = 560/27 ms; NEX = 2; matrix size = 256 × 256; FOV = 56 mm × 70 mm; slice thickness = 2.4 mm; slice spacing = 2.9 mm, tumour size in animals in the experimental group was quantified using turbo-spin-echo-based T2-weighted images with the following parameters: pulse repetition time (TR)/echo time (TE)=2300/110 ms; NEX = 2; matrix size = 256 × 256; FOV = 56 mm × 70 mm; slice thickness = 2.4 mm; slice spacing = 2.9 mm. To achieve enhanced T1-weighted images, gadopentetate dimeglumine (Gd-DTPA, 0.4 mmol/kg) MRI contrast agent (Magnevist, Berlex Laboratories, Wayne, NJ) was administered via tail vein injection 10 min before scanning. All the animal experiments were performed with the approval and guidance of the Laboratory Animal Ethics Committee of Wenzhou Medical University and Laboratory Animal Centre of Wenzhou Medical University.
Experimental design
After tumour implantation, SD rats were randomly divided into seven groups (six SD rats per group) as follows:
Group 1 (Control): normal saline (0.9% NaCl).
Group 2 (QD solution alone): QD solution only.
Group 3 (QDs-poloxamer 188 alone): QDs-poloxamer 188 only.
Group 4 (QDs-c(RGDyk)NP alone): QDs-c(RGDyk)NP only.
Group 5 (QD solution + UTMD): QD solution/SF6 MB mixture.
Group 6 (QDs-poloxamer 188 + UTMD): QDs-poloxamer 188/SF6 MB mixture.
Group 7 (QDs-c(RGDyk)NP + UTMD): QDs-c(RGDyk)NP/SF6 MB mixture.
The experiment began on day 7 after tumour implantation, and drugs were administered by intravenous injection. The QD concentration in the QD-containing groups (QD solution, QDs-poloxamer 188 or QDs-c(RGDyk)NP) was 50 nmol/l. The SF6 MB dose in the SF6 MB groups was approximately 1–5 × 10⁸ MBs/ml in the final injection. For each group, the total tail vein injection volume was 1 ml.
C6 rats were deeply anaesthetized via intraperitoneal injection of 10% chloral hydrate (350 mg/kg) before the experiment. Experimental solution was infused via the tail vein using a sterile syringe. In groups 5–7, US transmission gel was placed on the surface of the C6 rat brain corresponding to the glioma. The linear array transducer (Acuson Sequoia 512C system, Siemens, Erlangen, Germany) was placed on the skull of the hemisphere at the locations of tumour cell implantation as well as the contralateral normal hemisphere to generate the UTMD effect (frequency = 14 MHz, acoustic power = 3 W, burst length = 10 ms, pulse repetition frequency = 1 Hz, sonication time = 120 s).
Fluorescence analysis in glioma tissue and other normal tissues
At 2 h post-injection, the C6 rats were anaesthetized, and the hearts were perfused with normal saline through the cardiac ventricle until colourless infusion fluid was obtained from the right atrium. The brains were collected and washed with normal saline. Ex vivo NIR fluorescence images of glioma-bearing brains were acquired with an in vivo IVIS spectrum imaging system. The glioma-bearing brains were then used to prepare 5-μm thick consecutive frozen sections. Nuclei were stained with DAPI (1 mg/ml) for 7 min. The distribution of fluorescence was observed with a fluorescence microscope.
In addition, the tumour tissues, para-tumoural tissues, normal brain tissues, heart, liver, spleen, lung and kidney tissues were collected from each group. Each of the above tissues (0.1 g) was cut into fragments, RIPA lysis buffer was added, and the tissues were placed on a Tissuelyser (SCIENTZ-48, Ningbo, China) and lysed at a frequency of 70 Hz for 2 min. Afterwards, the lysis buffers were centrifuged (ST16R, Thermo, Bremen, Germany) at 12,000 r/min for 15 min at 4 °C. The supernatant was injected into 96-well plates at 100 μl per well. The fluorescence intensity of each well was measured with a microplate reader at an excitation wavelength of 450 nm and an emission wavelength of 610 nm.
Accurate surgical resection of glioma via fluorescence imaging of QDs-c(RGDyk)NP
In addition, glioma-bearing rats were divided into two groups. One group was administered QDs-c(RGDyk)NP via intravenous injection without UTMD, and the other group received QDs-c(RGDyk)NP + UTMD. After 2 h of intravenous injection, a median sagittal incision was made in the skin above the skull of glioma-bearing rats to expose the cranium. A small portion of cranium covering the glioma site was surgically removed using a drill. The covering dura was slightly peeled back from the cortical surface to expose GBM. The relationship between tumour tissue and peripheral normal brain tissue was observed under an Olympus SZX10 microscope (Tokyo, Japan). Both groups of glioma-bearing rats were irradiated at the tumour site with a 450-nm laser pen to observe the red fluorescence area, and the GBM was surgically removed with microscopic forceps and scissors under the laser until no fluorescence signal could be observed. The scope of the operation was limited to the highly focussed red fluorescence area. The bright light and fluorescence images of the surgical horizon were taken using a DP-72 camera before and after surgery.
To assess whether there was residual glioma lesion tissue at the surgical margin, a biopsy sample with a 3-mm thickness was extracted from the surgical margin and fixed with 4% paraformaldehyde for haematoxylin and eosin (HE) staining.
Brain tumours were fixed in 4% paraformaldehyde. A portion of the glioma-bearing brains were cut for paraffin embedding and sectioned at 5-μm thickness. Sections were stained with HE. For GFAP immunocytochemistry staining, paraffin sections of the brain tumour tissues were dewaxed with xylene and different concentrations of alcohol and washed three times with PBS (5 min each time). Endogenous peroxidase blocking solution was added and incubated with the tissues at 37 °C for 10 min. Afterwards, antigen retrieval was performed with citrate buffer, and the tissues were washed with PBS three times. Next, 5% bovine serum albumin (BSA) was added and incubated with the tissues at 37 °C for 30 min. After removal of the BSA, the tissues were incubated overnight with anti-GFAP antibody (1:250, rabbit monoclonal antibody) at 4 °C. After three washes with PBS at room temperature, the tissues were incubated with goat anti-rabbit IgG (H + L) FITC (1:1000), which recognized the primary antibody, at 37 °C for 1 h and then stained with DAB and counterstained with haematoxylin. Under a light microscope, tumour histology was observed and imaged.
In vivo toxicity evaluation of QDs-c(RGDyk)NP
To evaluate the toxicity of QDs, QDs-poloxamer 188 and QDs-c(RGDyk)NP, samples of the heart, liver, spleen, lung and kidney tissue were collected from rats after sacrifice and routinely stained with HE.
Statistical analysis
Statistical analyses were performed using GraphPad Prism version 7 for Windows (GraphPad Software, San Diego, CA). All results are expressed as the means ± SD for each group. Student’s t-tests were performed to determine the significance of differences between two groups. One-way analysis of variance (ANOVA) was utilized to determine significant differences between multiple groups. p < .05 was considered statistically significant.
Results
Synthesis and characterization of c(RGDyk)-poloxamer 188 polymer
c(RGDyk)-poloxamer 188 was synthesized using a two-step method. First, blank-NP was synthesized from poloxamer 188 carboxylated with succinic anhydride. Second, the carboxyl terminal group of blank-NP was activated by EDC/NHS and condensed with the amino group of the c(RGDyk) peptide to prepare c(RGDyk)-poloxamer 188. The structures of blank-NP and c(RGDyk)-poloxamer 188 were confirmed by FT-IR and 1H NMR (Figure S1, Supporting Information). As shown in Figure S1(A), compared with the FT-IR spectrum of poloxamer 188, the FT-IR spectrum of blank-NP showed that in addition to bands correlated with the poloxamer 188 skeleton, such as 3300 cm−1 (OH stretching vibration), 2852 cm−1 (CH2 stretching vibration) and 1100 cm−1 (C–O–C stretching vibration), COOH-related characteristic bands, such as 1735 cm−1 (C=O stretching vibration), were also present. Moreover, the FT-IR results for c(RGDyk)-poloxamer 188 showed not only the bands correlated with blank-NP but also c(RGDyk)-related characteristic bands, such as 1650 cm−1 (amide-I band) and 1580 cm−1 (amide-II band). Similarly, as shown in Figure S1(B), the 1H NMR spectra of blank-NP showed not only bands correlated with the poloxamer 188 skeleton, such as those at 3.5 ppm (–OCH2CH2O–) and 1.3 ppm (–OCH2CH2CH2O–) but also bands correlated with succinic acid, such as the band at 2.5 ppm (O=C–CH2CH2–C=O). In addition, bands correlated with c(RGDyk) appeared in the 1H NMR spectra of c(RGDyk)-poloxamer 188, such as the peak at 2.5–3.2 ppm. Thus, the above results verify that the synthesis of c(RGDyk)-poloxamer 188 was successful.
Preparation and characterization of NPs
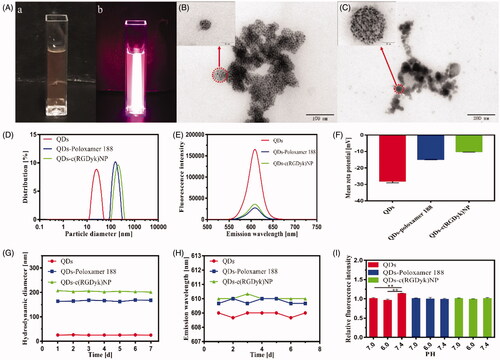
shows the representative characterization of QDs, QDs-poloxamer 188 and QDs-c(RGDyk)NP. The prepared QDs-c(RGDyk)NP macroscopically exhibited light orange in the bright-field images, while a strong red fluorescence was observed under laser excitation (450 nm) in dark field (. As characterized by TEM in , a spherical shape or a sphere-like morphology of QDs-poloxamer 188 and QDs-c(RGDyk)NP was observed. A number of fine, black, 5- to 10-nm particles were seen in these spherical vesicles. These fine particles in the vesicles represented the encapsulated QDs (. However, the dry particle sizes of QDs-poloxamer 188 and QDs-c(RGDyk)NP observed via TEM were significantly smaller than their hydrodynamic diameters determined with Series Particle Analysers. As shown in , the mean hydrodynamic diameters of QDs, QDs-poloxamer 188 and QDs-c(RGDyk)NP were 25.3 ± 0.75 nm, 163.5 ± 2.3 nm and 212.4 ± 4.3 nm, respectively. These were different from the particle sizes observed with TEM, which indicated that dense PEO hydrophilic chains were distributed on the vesicle shells of QDs-poloxamer 188 and QDs-c(RGDyk)NP, and when the samples were dried, dehydrated and vacuumed before TEM determination, the hydration layer of the samples shrank and the particle sizes were reduced [Citation42]. The emission wavelength and fluorescence intensity of QDs, QDs-poloxamer 188 and QDs-c(RGDyk)NP at the same concentrations were measured with a fluorescence spectrophotometer, and the emission spectra were narrow and symmetrical with an obvious fluorescence emission peak at 610 nm (. The fluorescence intensities of the prepared QDs-poloxamer 188 and QDs-c(RGDyk)NP were significantly lower than that of the QDs, which indirectly indicated that the QDs were encapsulated. To detect the dispersion stabilities of QDs, QDs-poloxamer 188 and QDs-c(RGDyk)NP, their zeta potential values were measured and found to be –28.0 ± 1.1 mV, –14.8 ± 0.2 mV and –10.1 ± 0.3 mV, respectively. As seen, the zeta potential values of the NPs decreased as particle size increased, and all had a moderate negative zeta potential value, indicating that the electrostatic repulsive forces provided adequate dispersion stability. NPs with negative charges are less susceptible to elimination by the reticuloendothelial system (RES) than those with positive charges. In contrast, NPs with positive charges are highly cytotoxic and easily enter both cancer cells and normal cells without selectivity. Meanwhile, to detect the stability of the QD formulations, their hydrodynamic diameters and emission wavelengths were measured for seven days. There were no significant differences in the mean hydrodynamic diameters of the QD formulations, and their fluorescence emission peaks were not shifted (), which indicates that the formulations were stable for at least seven days. As shown in , the fluorescence intensity of the QD solution in PBS at pH 7.4 is significantly higher than that in PBS at pH 6.0 and 7.0 (p < .01). However, there were no significant differences in the fluorescence intensities of QDs-poloxamer 188 and QDs-c(RGDyk)NP under different pH conditions (p>.05), which indicated that the QDs were not affected by external pH after being encapsulated. Based on these results, QDs-c(RGDyk)NP could be an efficient delivery system for tracers.
Figure 2. Physicochemical characteristics of the QDs, QDs-poloxamer 188 and QDs-c(RGDyk)NP. (A) Bright-field image (a) and fluorescence image (b) of QDs-c(RGDyk)NP; (B) TEM images of QDs-poloxamer 188; (C) TEM images of QDs-c(RGDyk)NP; (D) hydrodynamic diameter of QDs, QDs-poloxamer 188 and QDs-c(RGDyk)NP at the same concentration; (E) emission wavelength and fluorescence intensity of QDs, QDs-poloxamer 188 and QDs-c(RGDyk)NP at the same concentration; (F) mean zeta potential of QDs, QDs-poloxamer 188 and QDs-c(RGDyk)NP; (G) variation in particle size of QDs, QDs-poloxamer 188 and QDs-c(RGDyk)NP; (H) variation in emission wavelength of QDs, QDs-poloxamer 188 and QDs-c(RGDyk)NP; and (I) stabilities of QDs, QDs-poloxamer 188 and QDs-c(RGDyk)NP under different pH conditions (**p < .01).
Cytotoxicity of NPs against PC12 and C6 cells and HUVECs
The biocompatibility of blank-NP with PC12 and C6 cells and HUVECs was assessed using a CCK-8 kit. As shown in , blank-NP showed little effects on cell viabilities (p>.05). The cell viabilities of PC12 and C6 cells and HUVECs after treatment with blank-NP remained greater than 95% at all tested concentrations after 24 h, which indicated that blank-NP was biocompatible and only slightly cytotoxic to cells.
Figure 3. Viability of PC12 and C6 cells and HUVECs after incubation with blank-NP (A) and different QD formulations (B–D) for 24 h (*p < .05 vs. Control of the same cells; **p < .01 vs. Control of the same cells; ***p < .001 vs. Control of the same cells; #p < .05 vs. QD group of the same cells and concentration; ##p < .01 vs. QD group of the same cells and concentration; ###p < .001 vs. QD group of the same cells and concentration).
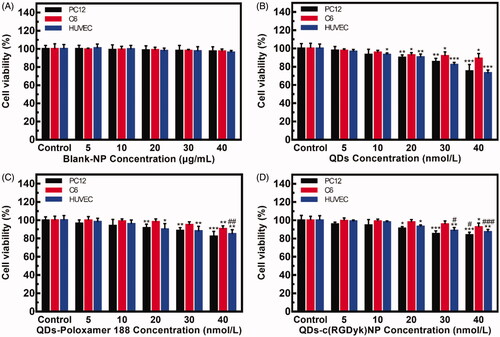
The in vitro cytotoxicity of the QDs-poloxamer 188 and QDs-c(RGDyk)NP against PC12 and C6 cells and HUVECs was also determined with a CCK-8 kit using QD solution as a positive control. As shown in , all QD formulations displayed dose-dependent cytotoxicity. Comparing with , the cell viabilities after exposure to a high concentration of QDs-poloxamer 188 and QDs-c(RGDyk)NP were higher than that in QD solution, which indicated that encapsulation of QDs in an NP effectively reduced their cytotoxic effect. These results indicate that QDs-c(RGDyk)NP can be used as a traceable drug in vivo due to its low cytotoxicity.
QDs-c(RGDyk)NP targeting of glioma for in vitro imaging
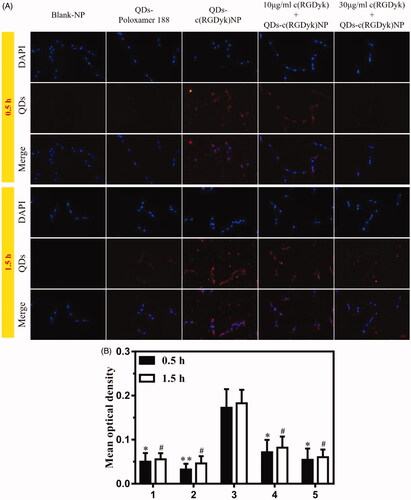
The in vitro cellular uptake of QDs, QDs-poloxamer 188 and QDs-c(RGDyk)NP by C6 cells was investigated and compared using blank-NP as a control. The results are shown in and Figure S2. As expected, because QDs and QDs-poloxamer 188 do not have c(RGDyk) in their structure, they have no affinity for integrins on C6 cells. Therefore, it can be observed that the QDs and QDs-poloxamer 188 groups showed little fluorescence around the C6 cells after incubation for 0.5 h and 1.5 h. In the QDs-c(RGDyk)NP group, distinctly, QDs-c(RGDyk)NP adsorbed on the cell membrane and entered the cytoplasm, exhibiting strong red fluorescence around the nucleus after 0.5 h of incubation. However, although the fluorescence intensity increased slightly after 1.5 h of incubation (), there was no significant difference compared with 0.5 h of incubation (p>.05), which indicated that QDs-c(RGDyk)NP could accurately target C6 glioma cells in a short time. In the 10 μg/ml c(RGDyk)+QDs-c(RGDyk)NP and 30 μg/ml c(RGDyk)+QDs-c(RGDyk)NP groups, the red fluorescence in both groups was quite obviously less than that in the QDs-c(RGDyk)NP group at the same incubation time (p < .05), which confirmed that c(RGDyk) has a high affinity for integrins on C6 glioma cells. These results indicate that QDs-c(RGDyk)NP could be used as a tracer for C6 glioma in rat brain.
Figure 4. (A) C6 cells were observed to assess their uptake of the QD formulations via fluorescence microscopy after incubation for 0.5 h and 1.5 h (the concentrations of the blank-NP and QD formulations were 30 μg/ml and 30 nmol/l, respectively). Red: QDs; blue: cell nuclei; original magnification: ×200. (B) The fluorescence intensities of the QD formulations after incubation for 0.5 h and 1.5 h (1 = QDs, 2 = QDs-poloxamer 188, 3 = QDs-c(RGDyk)NP, 4 = 10 μg/ml c(RGDyk)+QDs-c(RGDyk)NP, 5 = 30 μg/ml c(RGDyk)+QDs-c(RGDyk)NP; *p < .05 vs. QDs-c(RGDyk)NP 0.5 h; **p < .01 vs. QDs-c(RGDyk)NP 0.5 h; #p < .05 vs. QDs-c(RGDyk)NP 1.5 h).
Evaluation of glioblastoma model
To demonstrate that C6 glioma cells were successfully implanted in the brain of SD rats, we evaluated them via scanning MRI on the 5th day after tumour implantation. Figure S3 shows the MR images at the same brain level in an SD rat. On T1WI, glioma appeared hypointense with an unclear boundary and can be seen to have invaded the contralateral hemisphere. Conversely, on T2WI, glioma appeared hyperintense with a boundary that was still blurred. In enhanced T1W images, glioma presented uniform enhancement. As this was early glioma (only five days after implantation), no oedema was observed around the tumour. Therefore, Figure S3 verified that establishment of the glioma model was successful.
Brain glioma targeting of QDs-c(RGDyk)NP
To investigate whether QDs encapsulated in QDs-c(RGDyk)NP were capable of being delivered to glioma, ex vivo QD fluorescence imaging of the brain was carried out at 2 h post-injection of normal saline, QDs, QDs-poloxamer 188 or QDs-c(RGDyk)NP in the presence or absence of UTMD in rats bearing gliomas. As shown in and Figure S4B, using normal saline as a control, a weak QD fluorescence signal was observed in the brains of rats post injection of QDs and QDs-poloxamer 188 regardless of the presence of UTMD. However, the brains of rats administered QDs-c(RGDyk)NP still displayed relatively weak QD fluorescence without UTMD. Compared with the QDs-c(RGDyk)NP – UTMD group, strong QD fluorescence was observed in the QDs-c(RGDyk)NP + UTMD group, indicating that QDs-c(RGDyk)NP was capable of carrying QDs to the brain and that this effect was more obvious under the influence of UTMD. These results also confirmed that UTMD has a significant effect on opening of the BBB.
Figure 5. Representative ex vivo NIR fluorescence images of dissected brains from rats bearing C6 gliomas sacrificed at 2 h and qualitative evaluation of QD fluorescence in the glioma zone in rat brains after administration of QD formulations. Black circle: glioma zone; red: QDs; blue: cell nuclei; yellow line: glioma border; yellow arrow: direction of glioma growth. Original magnification: ×200.
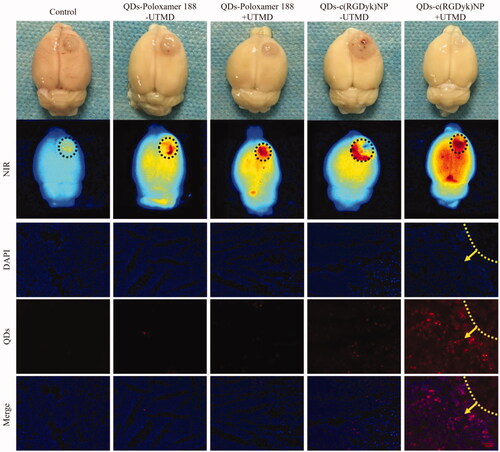
To investigate whether the QDs distributed to the brain tissue were able to further migrate into the tumours, gliomas were isolated from the brain, sectioned, stained and observed with a fluorescence microscope. As shown in Figure S4A, in all groups, red fluorescence was barely observed in the contralateral normal brain zone. Similarly, in the glioma zone ( and Figure S4B), little QD fluorescence appeared in rats treated with QDs and QDs-poloxamer 188 regardless of the presence of UTMD. However, in the QDs-c(RGDyk)NP – UTMD group, only slight QD fluorescence was observed in the glioma tissues. In contrast, the strongest QD fluorescence was observed in the QDs-c(RGDyk)NP + UTMD group, indicating that QDs-c(RGDyk)NP in the presence of UMTD facilitated more QD distribution to glioma tissues, which was consistent with the above results. Therefore, under the guidance of UTMD, QDs-c(RGDyk)NP can effectively cross the BBB and bind to glioma cells.
Accurate surgical resection of glioma under fluorescence imaging
Glioma-bearing rats were divided into two groups, and both groups were intravenously injected with QDs-c(RGDyk)NP, but UTMD technology was only used in one group and not the other. The bright light and fluorescence images of the surgical horizon were taken before and after surgery, and the results are shown in . Obvious glioma zones could be observed in both groups in bright-field images taken before surgical resection, but the boundary between glioma and normal brain parenchyma was very blurred, and glioma haemorrhage could be seen in the QDs-c(RGDyk)NP – UTMD group. In fluorescence images, no fluorescence was found in the glioma zone in the QDs-c(RGDyk)NP – UTMD group. By contrast, strong red fluorescence was concentrated in the neoplasm zone in rats in the QDs-c(RGDyk)NP + UTMD group. Therefore, glioma in the QDs-c(RGDyk)NP – UTMD group was empirically resected under bright light, while the fluorescence-guided resection was practised for glioma-bearing rats in the QDs-c(RGDyk)NP + UTMD group. The glioma was surgically excised until no fluorescence signal was observed in the tumour zone. After surgery, there was an obvious cavity in the brain, and no fluorescence was found after laser irradiation of the cavity.
Figure 6. (A) Bright-light-guided and fluorescence-guided surgical resection of glioma in the QDs-c(RGDyk)NP + UTMD and QDs-c(RGDyk)NP – UTMD groups, respectively (yellow circle: glioma zone; black circle: cavity after tumour resection). (B) HE staining of a biopsy sample at the boundary of the cavity postresection in the (a) QDs-c(RGDyk)NP + UTMD group and (b) QDs-c(RGDyk)NP – UTMD group (red dash line: glioma border; T: residual glioma; P: normal parenchyma; original magnification: ×20).
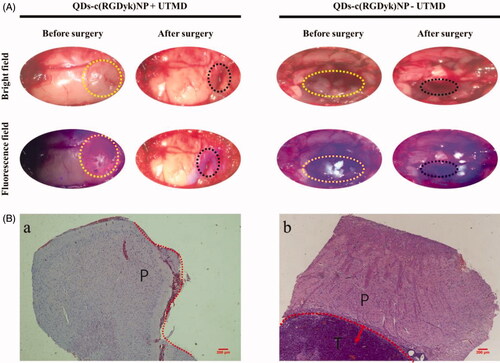
To confirm whether residual glioma lesion remained at the surgical margin, a biopsy sample with a 3-mm thickness was excised from brain tissue at the surgical incision and evaluated with HE staining. The results are shown in . There existed no residual tumour niche at the surgical incision boundary (marked by red dash line) in the biopsy sample from the QDs-c(RGDyk)NP + UTMD group (,a)). By contrast, the residual glioma (T) was observed near normal parenchyma (P) in the biopsy sample in the QDs-c(RGDyk)NP – UTMD group (,b)), which indicated that there was still residual tumour around the cavity. Therefore, real-time fluorescence imaging can guide the accurate and complete surgical resection of intracranial glioma.
HE and immunohistochemistry staining of glioma
From HE staining of glioma from rats in all the groups, it can be seen that the number of nuclei was significantly increased with derangement in the glioma zone, and the richness and pleomorphism of tumour cells were also obvious ( and Figure S5). In addition, local microvascular proliferation was observed. Rapid glioma growth and invasion compressed the surrounding normal brain tissue, resulting in ischaemia and cell necrosis in the adjacent brain zone.
Figure 7. (A) HE and immunohistochemistry staining of C6 glioma sections from rats receiving different QD formulations (brown staining reflects expression of GFAP protein; yellow line: glioma border; yellow arrow: the direction of glioma growth; original magnification: ×200). (B) Fluorescence intensity analysis of glioma tissue and other normal tissues (1 = QDs – UTMD; 2 = QDs + UTMD; 3 = QDs-poloxamer 188 – UTMD; 4 = QDs-poloxamer 188 + UTMD; 5 = QDs-c(RGDyk)NP – UTMD; 6 = QDs-c(RGDyk)NP + UTMD; **p < .01, n = 3).
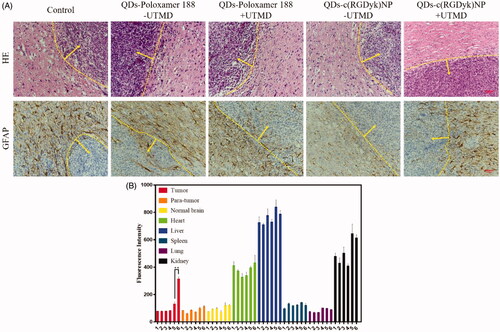
GFAP assays were carried out to assess cell differentiation in tumour tissues ( and Figure S5). It can be seen that GFAP was abundantly expressed in the normal brain tissue zone but was barely expressed in the glioma zone. This was consistent with the previous findings, which demonstrated that C6 cells remain in an undifferentiated state and cannot be recognized by GFAP [Citation43]. Based on their histological traits and biological behaviour, C6 glioma cells have been reported to correspond to human anaplastic astrocytoma of grade II/III [Citation44], indicating that QDs-c(RGDyk)NP might be used as a tracer of human glioma in the future.
In vitro fluorescence analysis of dissected tissues
The tumour tissues, para-tumoural tissues, normal brain tissues, heart, liver, spleen, lung and kidney tissues were collected and lysed to measure their fluorescence content. The results are shown in . QDs primarily accumulated in the liver, followed by the kidney, which was consistent with the literature. In the QDs-c(RGDyk)NP + UTMD group, the fluorescence intensity was significantly higher than that in the QDs-c(RGDyk)NP – UTMD group (p < .01). However, there were no significant differences in para-tumour and normal brain tissues compared with other groups (p > .05), indicating that QDs-c(RGDyk)NP can accurately identify glioma cells and that UTMD plays an important role in opening the BBB.
Toxicity evaluation of different QD formulations against normal tissues
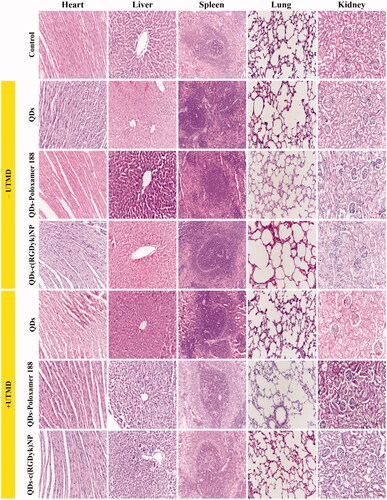
HE staining was performed using paraffin-embedded tumour tissues to evaluate the toxicity of different QD formulations. In addition, organs involved in the RES, such as the liver, spleen, lung and kidney, are considered to be the main distribution sites of nanoscale drug carriers after injection. Thus, the toxicity of QD formulations against these organs was also detected (). As reported in the literature, hepatotoxicity and nephrotoxicity are the most common side effects of QDs. As shown in , liver and kidney damage was present in the QDs group with or without UTMD. Similarly, liver and kidney damage could be seen in the QDs-poloxamer 188 groups (both the + UTMD and –UTMD groups), but to a lesser extent than in the QDs group. There were no obvious indications of toxicity in the liver and kidney of rats treated with QDs-c(RGDyk)NP (both the + UTMD and –UTMD groups) at the same drug dose, indicating that the QD-loaded NPs reduced the liver and kidney toxicity of QDs. There was no significant difference in the heart, spleen and lung between the groups.
Figure 8. Toxicity analysis via pathological HE staining of organs from C6 rats after treatment with different QD formulations. Original magnification: ×200. The scale bar represents 100 μm.
Discussions
Due to the aggressive growth of GBM and its blurred boundary, surgery often leads to tumour residuals, which in turn increases the recurrence rate of GBM. Therefore, it is still an urgent problem to accurately locate the GBM boundary. According to previous reports, there are many techniques to help maximize the extent of tumour resection. For example, navigated transcranial magnetic stimulation (nTMS) and diffusion tensor imaging (DTI) can be checked before surgery, and US navigation and direct cortical stimulation (DCS) can be checked during surgery [Citation45]. However, due to the high cost and limitations of these technologies, they have not been widely used clinically. In our study, targeted delivery of QDs through an NP delivery system for accurate tracing was shown to be a potential strategy to overcome these limitations.
In recent years, UTMD has become increasingly popular as a very promising, novel, non-invasive technology for application of drugs and gene delivery at specific sites in the body. UTMD enhances delivery of drugs to the brain by transiently increasing the permeability of the BBB [Citation46]. It has been reported that UTMD can open the BBB and increase the concentration of drugs in brain tissue [Citation47–49]. In addition, the whole process of opening the BBB is reversible and will not cause damage to the nervous system [Citation34–36,Citation50]. The present study utilized c(RGDyk) as a neovascular targeting ligand, primarily because it can specifically bind with αvβ3 integrins, which are overexpressed on glioma cells [Citation28,Citation51,Citation52]. As a non-ionic surfactant, poloxamer 188 is a block copolymer composed of polyoxyethylene and polypropylene blocks. It is widely used in various applications because of its absence of physiological activity, low haemolysis induction and low toxicity. For example, it has been used as a solubilizer, emulsifier and carrier of genetic drugs in many drug delivery systems [Citation53,Citation54]. Therefore, we synthesized QDs-c(RGDyk)NP and QDs-poloxamer 188 for comparison and observed them via TEM (). All the NPs exhibited properties suitable for systemic delivery, including an appropriate size (QDs-poloxamer 188 ≈ 160 nm, QDs-c(RGDyk)NP ≈ 210 nm), a moderately negative zeta potential (QDs-poloxamer 188 ≈ –15 mV, QDs-c(RGDyk)NP ≈ –10 mV), a uniform morphology and good stability. Since dense PEO hydrophilic chains were distributed on the vesicle shells of QDs-poloxamer 188 and QDs-c(RGDyk)NP, their sizes after drying for TEM analysis were significantly smaller than those measured with Series Particle Analysers. In addition, rapid cell proliferation in tumours leads to an insufficient supply of oxygen and the accumulation of acidic substances, and the majority of tumours have an extracellular pH of 6.0–7.0, which is much lower than that in normal cells [Citation55]. Therefore, we measured the fluorescence intensity changes of different QD formulations under different pH conditions. The results confirmed that the fluorescence intensity of QDs-c(RGDyk)NP did not change significantly when it reached the tumour site.
The cellular toxicity of blank-NP, QDs, QDs-poloxamer 188 and QDs-c(RGDyk)NP was assessed using a CCK-8 kit. The blank-NP showed no toxicity in different cells and at different concentrations. This result is consistent with the reported low toxicity of poloxamer 188. In our study, the inorganic components of the QDs we used were ZnCdSe/ZnS. A high concentration of QD solution showed strong cytotoxicity after incubation for 24 h with normal cells (PC12 and HUVECs). This may be due to the instability of the QD surface coating, which exposes the CdSe core of the QDs to UV damage or air oxidation, resulting in the release of cadmium ions from the QD core; although the ZnS capping protects the core from air oxidation but not from UV damage [Citation56,Citation57]. The size and shape of NPs are also factors affecting cytotoxicity [Citation58,Citation59]. The synthesized QDs-c(RGDyk)NP exhibited weaker cytotoxicity than the QD only solution, possibly because modification of the QDs with c(RGDyk)-poloxamer 188 increases the stability of the surface coating, making release of cadmium ions more difficult.
For in vitro cell uptake experiments, we considered that a high concentration of QD formulations is likely to lead to cell death because of their high toxicity, while a low concentration of QD formulations is not conducive to observation of cellular uptake. Therefore, we selected 30 μg/ml blank-NP and 30 nmol/l QD formulations to carry out these experiments. The results clarified two key issues before we proceeded to extensive in vivo studies. First, it was confirmed that c(RGDyk) has an affinity for integrins on C6 cells, which is consistent with most reports in the literature [Citation51,Citation52]. Second, it was also verified that QDs-c(RGDyk)NP binds rapidly to integrins on C6 cells. Therefore, these findings will be helpful for rapid binding of QDs-c(RGDyk)NP to C6 glioma cells within the short time that UTMD opens the BBB during in vivo animal experiments.
To investigate whether the designed QDs-c(RGDyk)NP could be delivered to glioma via UTMD, brain tissue was examined via ex vivo imaging and evaluation of frozen sections. In ex vivo NIR imaging (), the strongest QD fluorescence was observed in the QDs-c(RGDyk) NP + UTMD group. However, in other groups, weak red fluorescence was observed, which may not be the result of binding of QDs to C6 glioma cells but may be caused by binding of QDs to plasma proteins. Therefore, weak fluorescence signals can also be seen in normal brain zones. In addition, cerebral haematoma or tumour haemorrhage during establishment of the glioma model may also be causes of the red fluorescence. The rats were sacrificed on the 7th day after the model was constructed, and the cerebral haematoma did not subside, which inevitably affected the ex vivo imaging. Therefore, to further verify whether the QDs migrated into the tumour, frozen sections were observed. As previously discussed, the results also validated the feasibility of using UTMD to open the BBB and showed the affinity of c(RGDyk) for integrins on glioma. In frozen sections of the normal brain zone of the contralateral hemisphere (Figure S4), no red fluorescence was observed in any groups, which indicated that the red fluorescence in the normal brain zone in ex vivo NIR imaging was not due to binding of the QDs to normal brain cells.
With the growth of glioma, the nutrient supply of the original vascular system is far from rapid glioma cells proliferation, which leads to local hypoxia and up-regulation of vascular endothelial growth factor (VEGF). VEGF could initiate the process of neovascularization inside glioma, which forms another new barrier between neovascularization and glioma―blood brain tumour barrier (BBTB) to hinder drug permeability [Citation60]. It was previously reported that αvβ3 integrin was also overexpressed on the neovascularized endothelial cells of BBTB [Citation61], which could specifically bind with c(RGDyk). In this study, two possible mechanisms may involve in targeting of QDs-c(RGDyk)NP towards BBTB. On the one hand, the auxiliary UTMD made the temporary opening of BBTB, followed by QDs-c(RGDyk)NP across the space between endothelial cells directly targeted glioma cells. On the other hand, because of the specific binding with αvβ3 receptors on BBTB, QDs-c(RGDyk)NP was actively accumulated in the tumour site via the receptor-mediated endocytosis [Citation62].
In this study, the imaging capability of QDs-c(RGDyk)NP was also evaluated through fluorescence imaging (. In the QDs-c(RGDyk)NP + UTMD group, an obvious glioma mass was seen in one hemisphere in the bright field, but the boundary between glioma and normal brain tissue was not clear. However, in the fluorescence field, it could be seen that the glioma had invaded the other hemisphere. Compared with traditional surgery, fluorescence-guided surgery will greatly reduce the amount of residual glioma. Therefore, accurate fluorescence imaging is extremely important to guide surgical resection of glioma.
In addition, we evaluated the toxicity of the QD formulations to other normal tissues (). Considering metabolism in the liver and excretion by the kidneys, we increased the concentration to 50 nmol/l when the QD formulations were administered via the tail vein. As reported in a large number of studies, QDs shows toxicity in diverse systems, such as the respiratory system, cardiovascular system, hepatorenal system, nervous system and immune system [Citation57,Citation59]. However, with the degradation of QDs in vivo, the released cadmium ions accumulate most prominently in the liver and kidney. In acute exposure, free cadmium ions may be redistributed to the kidneys via production of metallothionein by the liver [Citation63]. Moreover, QD formulations with a size larger than the renal filtration threshold are likely to be taken up non-specifically by the RES after administration via the tail vein. As shown in , the amount of QDs-c(RGDyk)NP accumulated in the kidney was higher than that in other groups, which confirmed the above statement. Therefore, to minimize the accumulation of QDs in the RES, the size of the QD formulations can be reduced to allow maximum renal filtration.
One noteworthy issue is the difference in the amount of QDs-c(RGDyk)NP bound to glioma cells between in vitro and in vivo conditions. Because QDs-c(RGDyk)NP was directly exposed to C6 cells in vitro, the binding of QDs-c(RGDyk)NP is very obvious. However, because of liver metabolism, renal excretion and the role of the BBB, the binding of QDs-c(RGDyk)NP to glioma cells in vivo was significantly reduced. To increase the binding rate of QDs-c(RGDyk)NP to glioma cells, we increased the concentration of QDs-c(RGDyk)NP in vivo, but this also brings toxicity problems. Therefore, in recent years, maximizing the binding of QDs to glioma and reducing the toxicity of QDs to other normal organs have become the focus of attention.
Although QDs are known for their toxicity, this still does not frustrate the enthusiasm of scientists. Researchers have been working to reduce their toxicity in a variety of ways [Citation64,Citation65]. In our study, a novel drug-targeted delivery system was used to trace glioma by combining as many QDs as possible with each glioma cell to achieve accurate positioning of glioma boundaries. QDs-c(RGDyk)NP can even be used to accurately identify glioma metastases by combining with tumour cells that separated from the glioma. This will be very helpful for surgery.
To summarize, this experiment effectively combined efficient QD tracing technology, tumour-targeted NP formulation technology and UTMD technology to make full use of the advantages of new materials, new formulations and clinical US-mediated methods, thereby solving the technical bottleneck of the difficulty in positioning tumour boundaries and the omission of metastases in glioma surgery. Thus, a new, safe and effective strategy for improving the quality of glioma surgical resection was explored.
Conclusions
In this study, we established a unique delivery system using QDs-c(RGDyk)NP as a traceable drug for imaging of glioma. First, the physiochemical properties of QDs-c(RGDyk)NP, including particle size, zeta potential, emission wavelength and stability, were carefully characterized. The results showed that the NPs were of moderate size and maintained good stability. Second, in vitro experiments demonstrated that QDs-c(RGDyk)NP could reduce QD cytotoxicity and significantly enhance cellular uptake by C6 cells. Furthermore, through utilization of UTMD, QDs-c(RGDyk)NP can effectively cross the BBB and target the tumour site. Finally, precise surgical treatment of glioma was achieved under fluorescence guidance. In conclusion, QDs-c(RGDyk)NP may be very promising as a traceable drug for accurate surgical resection of glioma.
| Abbreviations | ||
| CNS | = | central nervous system |
| NPs | = | nanoparticles |
| QDs | = | quantum dots |
| RGD | = | arginine– glycine–aspartic acid |
| EPR | = | enhanced permeability and retention |
| BBB | = | blood–brain barrier |
| BBTB | = | blood–brain tumour barrier |
| GBM | = | glioblastoma |
| US | = | ultrasound |
| UTMD | = | ultrasound-targeted microbubble destruction |
| MBs | = | microbubbles |
| SF6 | = | sulphur hexafluoride |
| TEM | = | transmission electron microscopy |
| MRI | = | magnetic resonance imaging |
| RES | = | reticuloendothelial system |
Supplementary_information.docx
Download MS Word (6 MB)Disclosure statement
No potential conflict of interest was reported by the author(s).
Additional information
Funding
References
- Chen J, McKay RM, Parada LF. Malignant glioma: lessons from genomics, mouse models, and stem cells. Cell. 2012;149(1):36–47.
- Shergalis A, Bankhead A 3rd, Luesakul U, et al. Current challenges and opportunities in treating glioblastoma. Pharmacol Rev. 2018;70(3):412–445.
- Sepulveda JM, Sanchez-Gomez P, Vaz Salgado MA, et al. Dacomitinib: an investigational drug for the treatment of glioblastoma. Expert Opin Investig Drugs. 2018;27(10):823–829.
- Qiu XX, Chen L, Wang CH, et al. High delta-like ligand 4 (DLL4) is correlated with peritumoral brain edema and predicts poor prognosis in primary glioblastoma. Medicine (Baltimore). 2014;93(8):e57.
- Parker NR, Khong P, Parkinson JF, et al. Molecular heterogeneity in glioblastoma: potential clinical implications. Front Oncol. 2015;5:55.
- Chen J, Li Y, Yu TS, et al. A restricted cell population propagates glioblastoma growth after chemotherapy. Nature. 2012;488(7412):522–526.
- Martirosyan NL, Cavalcanti DD, Eschbacher JM, et al. Use of in vivo near-infrared laser confocal endomicroscopy with indocyanine green to detect the boundary of infiltrative tumor. J Neurosurg. 2011;115(6):1131–1138.
- Jenkinson MD, Barone DG, Bryant A, et al. Intraoperative imaging technology to maximise extent of resection for glioma. Cochrane Database Syst Rev. 2018;1:CD012788.
- Doglietto F, Belotti F, Panciani P, et al. High-definition 3-dimensional exoscope for 5-ALA glioma surgery: 3-dimensional operative video. Oper Neurosurg (Hagerstown). 2019.
- Martinez-Moreno M, Kiesel B, Woehrer A, et al. Ex-vivo analysis of quantitative 5-ALA fluorescence intensity in diffusely infiltrating gliomas with a handheld spectroscopic probe: correlation with histopathology, proliferation and microvascular density. Photodiagn Photodyn Ther. 2019;27:354–361.
- Su X, Huang QF, Chen HL, et al. Fluorescence-guided resection of high-grade gliomas: a systematic review and meta-analysis. Photodiagn Photodyn Ther. 2014;11(4):451–458.
- Michalet X, Pinaud PF, Bentolila LA, et al. Quantum dots for live cells, in vivo imaging, and diagnostics. Science. 2005;307(5709):538–544.
- Cai W, Shin DW, Chen K, et al. Peptide-labeled near-infrared quantum dots for imaging tumor vasculature in living subjects. Nano Lett. 2006;6(4):669–676.
- Arndt-Jovin DJ, Kantelhardt SR, Caarls W, et al. Tumor-targeted quantum dots can help surgeons find tumor boundaries. IEEE Transon Nanobiosci. 2009;8(1):65–71.
- Al-Jamal WT, Al-Jamal KT, Tian B, et al. Lipid-quantum dot bilayer vesicles enhance tumor cell uptake and retention in vitro and in vivo. ACS Nano. 2008;2(3):408–418.
- Li Y, Wang W, Zhao D, et al. Water-soluble fluorescent CdTe/ZnSe core/shell quantum dot: aqueous phase synthesis and cytotoxicity assays. J Nanosci Nanotechnol. 2015;15(6):4648–4652.
- Lovrić J, Bazzi HS, Yan C, et al. Differences in subcellular distribution and toxicity of green and red emitting CdTe quantum dots. J Mol Med. 2005;83(5):377–385.
- Derfus AM, Chan WCW, Bhatia SN. Probing the cytotoxicity of semiconductor quantum dots. Nano Lett. 2004;4(1):11–18.
- Zheng H, Mortensen LJ, DeLouise LA. Thiol antioxidant-functionalized CdSe/ZnS quantum dots: synthesis, characterization, cytotoxicity. J Biomed Nanotechnol. 2013;9(3):382–392.
- Maeda H, Nakamura H, Fang J. The EPR effect for macromolecular drug delivery to solid tumors: improvement of tumor uptake, lowering of systemic toxicity, and distinct tumor imaging in vivo. Adv Drug Deliv Rev. 2013;65(1):71–79.
- van Schooneveld MM, Vucic E, Koole R, et al. Improved biocompatibility and pharmacokinetics of silica nanoparticles by means of a lipid coating: a multimodality investigation. Nano Lett. 2008;8(8):2517–2525.
- Koffie RM, Farrar CT, Saidi LJ, et al. Nanoparticles enhance brain delivery of blood–brain barrier-impermeable probes for in vivo optical and magnetic resonance imaging. Proc Natl Acad Sci USA. 2011;108(46):18837–18842.
- Beduneau A, Saulnier P, Benoit JP. Active targeting of brain tumors using nanocarriers. Biomaterials. 2007;28(33):4947–4967.
- Nance EA, Woodworth GF, Sailor KA, et al. A dense poly(ethylene glycol) coating improves penetration of large polymeric nanoparticles within brain tissue. Sci Transl Med. 2012;4(149):149ra119.
- Zhang J, Liu H, Du X, et al. Increasing of blood–brain tumor barrier permeability through transcellular and paracellular pathways by microbubble-enhanced diagnostic ultrasound in a C6 glioma model. Front Neurosci. 2017;11:86.
- Weng KC, Hashizume R, Noble CO, et al. Convection-enhanced delivery of targeted quantum dot–immunoliposome hybrid nanoparticles to intracranial brain tumor models. Nanomedicine. 2013;8(12):1913–1925.
- Hood JD, Cheresh DA. Role of integrins in cell invasion and migration. Nat Rev Cancer. 2002;2(2):91–100.
- Gao H, Xiong Y, Zhang S, et al. RGD and interleukin-13 peptide functionalized nanoparticles for enhanced glioblastoma cells and neovasculature dual targeting delivery and elevated tumor penetration. Mol Pharm. 2014;11(3):1042–1052.
- Fisher MJ, Gunn B, Harms CS, et al. Non-peptide RGD surrogates which mimic a Gly-Asp beta-turn: potent antagonists of platelet glycoprotein IIb-IIIa. J Med Chem. 1997;40(13):2085–2101.
- Saraf P, Li X, Wrischnik L, et al. In vitro and in vivo efficacy of self-assembling RGD peptide amphiphiles for targeted delivery of paclitaxel. Pharm Res. 2015;32(9):3087–3101.
- Hu G, Liu C, Liao Y, et al. Ultrasound molecular imaging of arterial thrombi with novel microbubbles modified by cyclic RGD in vitro and in vivo. Thromb Haemost. 2012;107(1):172–183.
- Doolittle ND, Muldoon LL, Culp AY, et al. Delivery of chemotherapeutics across the blood–brain barrier: challenges and advances. Adv Pharmacol. 2014;71:203–243.
- Vykhodtseva N, McDannold N, Hynynen K. Progress and problems in the application of focused ultrasound for blood–brain barrier disruption. Ultrasonics. 2008;48(4):279–296.
- Geis NA, Katus HA, Bekeredjian R. Microbubbles as a vehicle for gene and drug delivery: current clinical implications and future perspectives. Curr Pharm Des. 2012;18(15):2166–2183.
- Mayer CR, Geis NA, Katus HA, et al. Ultrasound targeted microbubble destruction for drug and gene delivery. Expert Opin Drug Deliv. 2008;5(10):1121–1138.
- Rodriguez-Frutos B, Otero-Ortega L, Ramos-Cejudo J, et al. Enhanced brain-derived neurotrophic factor delivery by ultrasound and microbubbles promotes white matter repair after stroke. Biomaterials. 2016;100:41–52.
- Lu CT, Zhao YZ, Wong HL, et al. Current approaches to enhance CNS delivery of drugs across the brain barriers. Int J Nanomedicine. 2014;9:2241–2257.
- Zhao YZ, Lu CT, Li XK, et al. Ultrasound-mediated strategies in opening brain barriers for drug brain delivery. Expert Opin Drug Deliv. 2013;10(7):987–1001.
- Tung YS, Vlachos F, Feshitan JA, et al. The mechanism of interaction between focused ultrasound and microbubbles in blood–brain barrier opening in mice. J Acoust Soc Am. 2011;130(5):3059–3067.
- Grobben B, De Deyn PP, Slegers H. Rat C6 glioma as experimental model system for the study of glioblastoma growth and invasion. Cell Tissue Res. 2002;310(3):257–270.
- Zhao YZ, Lin Q, Wong HL, et al. Glioma-targeted therapy using Cilengitide nanoparticles combined with UTMD enhanced delivery. J Control Release. 2016;224:112–125.
- Zhang L, Hu Y, Jiang X, et al. Camptothecin derivative-loaded poly(caprolactone-co-lactide)-b-PEG-b-poly(caprolactone-co-lactide) nanoparticles and their biodistribution in mice. J Control Release. 2004;96(1):135–148.
- Chao CC, Kan D, Lo TH, et al. Induction of neural differentiation in rat C6 glioma cells with taxol. Brain Behav. 2015;5(12):e00414.
- Ristic S, Miric M, Jovic S, et al. Histological characteristics and markers of proliferation and differentiation in rat brain with experimental glioma. Vojnosanit Pregl. 2014;71(9):828–832.
- Krivosheya D, Prabhu SS, Weinberg JS, et al. Technical principles in glioma surgery and preoperative considerations. J Neurooncol. 2016;130(2):243–252.
- Etame AB, Diaz RJ, Smith CA, et al. Focused ultrasound disruption of the blood–brain barrier: a new frontier for therapeutic delivery in molecular neurooncology. Neurosurg Focus. 2012;32(1):E3.
- McDannold N, Vykhodtseva N, Hynynen K. Effects of acoustic parameters and ultrasound contrast agent dose on focused-ultrasound induced blood–brain barrier disruption. Ultrasound Med Biol. 2008;34(6):930–937.
- Sheikov N, McDannold N, Sharma S, et al. Effect of focused ultrasound applied with an ultrasound contrast agent on the tight junctional integrity of the brain microvascular endothelium. Ultrasound Med Biol. 2008;34(7):1093–1104.
- Kroll RA, Neuwelt EA. Outwitting the blood–brain barrier for therapeutic purposes: osmotic opening and other means. Neurosurgery. 1998;42(5):1083–1099.
- Hynynen K, McDannold N, Vykhodtseva N, et al. Non-invasive opening of BBB by focused ultrasound. Acta Neurochir Suppl. 2003;86:555–558.
- Liu S. Radiolabeled multimeric cyclic RGD peptides as integrin alphavbeta3 targeted radiotracers for tumor imaging. Mol Pharm. 2006;3(5):472–487.
- Kenny LM, Coombes RC, Oulie I, et al. Phase I trial of the positron-emitting Arg-Gly-Asp (RGD) peptide radioligand 18F-AH111585 in breast cancer patients. J Nucl Med. 2008;49(6):879–886.
- Tian JL, Zhao YZ, Jin Z, et al. Synthesis and characterization of Poloxamer 188-grafted heparin copolymer. Drug Dev Ind Pharm. 2010;36(7):832–838.
- Homayouni A, Sadeghi F, Nokhodchi A, et al. Preparation and characterization of celecoxib solid dispersions; comparison of poloxamer-188 and PVP-K30 as carriers. Iran J Basic Med Sci. 2014;17(5):322–331.
- Liu Q, Zheng C, Zhao H, et al. Tumor cell pH detection based on fluorescence characteristics of CdSe quantum dots. Technol Health Care. 2019;27(5930):1–9.
- Azzazy HM, Mansour MM, Kazmierczak SC. From diagnostics to therapy: prospects of quantum dots. Clin Biochem. 2007;40(13–14):917–927.
- Smith AM, Duan H, Mohs AM, et al. Bioconjugated quantum dots for in vivo molecular and cellular imaging. Adv Drug Deliv Rev. 2008;60(11):1226–1240.
- Swift BJ, Baneyx F. Microbial uptake, toxicity, and fate of biofabricated ZnS:Mn nanocrystals. PLoS One. 2015;10(4):e0124916.
- Wang Y, Tang M. Review of in vitro toxicological research of quantum dot and potentially involved mechanisms. Sci Total Environ. 2018;625:940–962.
- Ruan H, Chen X, Xie C, et al. Stapled RGD peptide enables glioma-targeted drug delivery by overcoming multiple barriers. ACS Appl Mater Interfaces. 2017;9(21):17745–17756.
- Belhadj Z, Ying M, Cao X, et al. Design of Y-shaped targeting material for liposome-based multifunctional glioblastoma-targeted drug delivery. J Control Release. 2017;255:132–141.
- Belhadj Z, Zhan C, Ying M, et al. Multifunctional targeted liposomal drug delivery for efficient glioblastoma treatment. Oncotarget. 2017;8(40):66889–66900.
- Liu J, Liu Y, Michalska AE, et al. Distribution and retention of cadmium in metallothionein I and II null mice. Toxicol Appl Pharmacol. 1996;136(2):260–268.
- Parani S, Pandian K, Oluwafemi OS. Gelatin stabilization of quantum dots for improved stability and biocompatibility. Int J Biol Macromol. 2018;107(Pt A):635–641.
- Zhao P, Xu Q, Tao J, et al. Near infrared quantum dots in biomedical applications: current status and future perspective. Wires Nanomed Nanobiotechnol. 2018;10(3):e1483.