
Abstract
Accumulating evidence links osteopontin (OPN), a pro-fibrogenic extracellular matrix protein, to the pathogenesis of non-alcoholic fatty liver disease (NAFLD). In this study, liver tissues isolated from non-alcoholic steatohepatitis (NASH) patients expressed higher OPN than those of controls. However, the exact mechanism(s) for this phenomenon is yet to be clarified. Autophagy is the natural, regulated degradation and recycling of a cell's dysfunctional components, in order to maintain homeostasis. Increasing evidence supports that autophagy can constitute an effective Defence mechanism against NAFLD conditions. Herein, we constructed NAFLD mice model by high-fat (HF) and methionine-choline-deficient (MCD) diet and found that OPN is upregulated in livers of NAFLD mice. Besides, secreted OPN inhibited autophagosome-lysosome fusion via binding with its receptors integrin αVβ3 and αVβ5 in HepG2 cells supplemented with free fatty acids (FFA) and the livers of NAFLD mice. Silencing of OPN attenuated autophagy impairment and reduced lipid accumulation, while supplementation of OPN exhibited the opposite effect. Furthermore, treatment with anti-OPN Ab significantly attenuated steatosis as well as autophagy impairment in the liver. Our findings indicated that OPN plays a vital role in the pathogenesis of the development of NAFLD via autophagy impairment, which might represent a potential new therapeutic target for the treatment of NAFLD.
Introduction
Non-alcoholic fatty liver disease (NAFLD) ranges from steatosis alone to the more aggressive form termed, non-alcoholic steatohepatitis (NASH), characterized by triglyceride (TG) accumulation within lipid droplets in addition to necroinflammatory changes and ultimately leading to advanced fibrosis and cirrhosis [Citation1,Citation2]. Although lipid metabolism dysfunction and proinflammatory cytokines are known to be involved in the pathologies to some extent, a more specific type of molecular mechanism contributing to the progression of NAFLD remains unclear.
Osteopontin (OPN) is a phosphorylated glycoprotein that induces the fabrication of a variety of chemokines and proinflammatory cytokines in peripheral blood mononuclear cells [Citation3]. OPN is sensitive to oxidative stress and highly induced upon liver damage, playing a pathogenic role in the progress of NAFLD [Citation4,Citation5]. Mechanistic studies revealed first that OPN deficiency not only prevents high-fat diet (HFD) induced accumulation of lipids but also the development of inflammation by improving insulin signalling and insulin sensitivity through the enhancement of the phosphorylation of IRS-2 and AKT, both stimulated by insulin, and the downregulation of factor FOXO1 and its coactivator PGC-1a [Citation6]; and second, that the increased expression of OPN via leptin signalling through Ob-Ra contribute to increasing pathological collagen-I deposition in the livers of the insulin resistant/diabetic db/db mouse model of NAFLD mice induced by a diet deficient in methionine and choline (MCD). In addition further mediators downstream of OPN, possibly with lipogenic potential, could participate in increasing fat accumulation by hepatocytes [Citation7]. In recent times, OPN neutralization mediated by antibodies was shown to protect against D-galactosamine-induced inflammatory liver injury [Citation8] and HFD-induced hepatic macrophage infiltration [Citation9]. Besides, OPN deficiency markedly improved liver steatosis, obesity-driven hepatic inflammation and macrophage infiltration. Yet, very little is known about the pathophysiological significance of OPN and the more specific pathological mechanism(s) of OPN’s involvement in NAFLD remains unclear.
Autophagy, a lysosomal pathway to maintain energy homeostasis, is a process of cellular self-digestion that targets cell components, such as unfolded proteins, damaged organelles and intracellular pathogens, to lysosomes for degradation [Citation10,Citation11]. There are three major steps involved in that regulate autophagy: autophagosome formation and fusion with lysosomes, which then fuse with lysosomes for breakdown [Citation12,Citation13], among which the third pathway is microtubule-associated protein 1 light chain 3 (LC3-I) converted to the membrane-bound form LC3-II. Converting LC3A/B-I to LC3A/B-II plays a crucial part in the maturation of autophagosomes, allowing their fusion with lysosomes and autophagosome cargo degradation [Citation14]. The presence of LC3-II on both the inner and outer isolation membranes serves as a recognition site for LC3-binding chaperones such as p62/SQSTM1 (p62) whose cargo is delivered to autophagosomes. Protein p62 is a selective substrate for autophagy. Accumulated evidence suggests that autophagy regulates the hepatic energy homeostasis of intracellular lipids. Treatment with autophagy inhibitor 3-methyladenine strongly increased hepatocyte TG content with or without oleate. Besides, hepatic autophagy is induced by starvation which increases FFAs delivery to the liver from lipolysis of adipose tissue. Decreased autophagy contributes to hepatic lipid accumulation that further impairs autophagy, thereby additionally increasing lipid retention, which may form a harmful cycle [Citation15,Citation16].
In this study, we demonstrated that secreted OPN promoted progression of NAFLD through impairing autophagy maturation. Curbing OPN overexpression can be a potential therapeutic choice for regulating NAFLD development and progression.
Materials and methods
Patients
Liver specimens were obtained from hepatic haemangioma patients with (n = 20) or without (n = 20) NASH who received hepatic haemangioma resection in Tongji Hospital (Shanghai, China). All patients had fulfilled the inclusion criteria, according to the ultrasonography and eligibility criteria [Citation17]. The use of specimens was approved by the Research Ethics Committee of Tongji Hospital (2015-KYSB-11) with Patients’ consent and approval.
Animals and diets
Male C57BL/6J mice (8 weeks) were purchased from Shanghai Experimental Animal Centre of Chinese Academy of Sciences (Shanghai, People’s Republic of China). They were then divided into four groups, randomly. Each cage housed 10 mice. Two groups of these were placed for 16 weeks on either a HFD group (60 kcal% fat, TP23500; Trophic, China) or normal chow diet (CD group, n = 10/group), respectively. The other two were placed for 8 weeks on a MCD diet or methionine–choline-supplement (MCS) diet, respectively. All mice were maintained at a 12-h light/dark cycle in a specific pathogen-free facility and treated with human care. Moreover, the protocol was approved by and in accordance with the guidelines of the Animal Experiment Committee of Tongji Hospital.
Antibody treatment
In HFD group, 20 male mice (8 weeks) were divided into four groups, respectively. Every group of five mice was housed in a cage. Among the four groups, two groups were fed with HFD for 16 weeks; the other two were fed with MCD for 8 weeks. In HFD groups, one group of mice was treated with a neutralizing anti-mouse OPN antibody (50 μg/mouse/wk) and the other control group mice were treated with goat IgG by tail-vein injection for 8 weeks. The same method was used in MCD groups for 4 weeks. Besides, the mice were sacrificed within 24 h after the last antibody application.
ELISA
Culture media was harvested when cells were grown to 80–90% confluence. ELISA kit (Westang Shanghai, China) was used to detect OPN concentration in cell supernatant.
Real-time quantitative PCR
Total RNA in cells was collected by RNAfast-1000 (Fastagen, Shanghai, China). Total RNA in frozen liver tissues was extracted by a TRIzol extraction kit (Invitrogen, Carlsbad, CA, USA) following the manufacturer’s protocol. The cDNAs were generated by a Prime Script TM RT kit (Takara Bio Inc., Dalian, China) in reverse transcription reactions. Total amount of mRNA of the target genes was normalized to endogenous β-actin expression. Quantitative real-time PCR was performed in Light Cycler (Roche, Germany) using SYBR Green reagent. All primer sequences are listed in Supplementary Table S1 and synthesized by Huagene (Shanghai, China).
HE and Oil Red O staining
Liver tissue samples (four selected specimens from four regions of the liver) were fixed in 4% buffered formalin for about 40 min and embedded in paraffin. Tissue sections at a thickness of 4 μm were stained with H&E and Masson’s trichrome. Oil Red O staining was also performed with all the livers to estimate the degree of hepatic steatosis.
Immunohistochemistry
The expression of OPN and αSMA were analyzed in formalin-fixed, paraffin-embedded sections. The slides were briefly dewaxed, hydrated and washed, and the endogenous peroxidase activity quenched. After microwave antigen retrieval, slides were blocked and then incubated with the antibody against OPN or αSMA overnight at 4 °C. Subsequently, sections were rinsed and incubated with the working solution of horseradish peroxidase (HRP)-labelled goat anti-rabbit for 60 min at 37 °C. After being rinsed three times and counterstained by haematoxylin, the slides were dehydrated in graded alcohol and mounted. Negative controls were prepared in the absence of primary antibody.
Western blotting analysis
Total protein was extracted with RIPA lysis buffer (Beyotime Biotechnology, Shanghai, China) and centrifuged at 14,000 g for 15 min at 4 °C. Supernatant was collected and the protein concentration was measured by BCA Protein Assay Kits (Beyotime Biotechnology, Shanghai, China). The same amount of proteins was separated by SDS-PAGE and transferred to PVDF membranes. The membranes were blocked with 5% BSA for 2 h at room temperature and incubated with primary antibody diluted at the ratio of 1:1000 at 4 °C for at least 8 h. After being washed three times, the membrane was further reacted with HRP-conjugated secondary antibody at the ratio of 1:5000 dilution. All antibodies used in the experiments are shown in Supplementary Table 2.
Measurement of ALT
The peripheral blood of mice was collected and their ALT value was measured according to the manufacturer’s instructions (Alanine aminotransferase Assay Kit, Nangjing Jiancheng, China).
Cell culture
HepG2 cell line was kindly provided by Dr. Jian Zhao (Shanghai Key Laboratory for Molecular Imaging, Shanghai University of Medicine & Health Sciences). HepG2 was cultured in DMEM with 10% FBS in a humidified atmosphere of 5% CO2 at 37 °C. Cells were treated with 1 mM long-chain fatty acid (FFA), which consisted of palmitic acid and oleic acid dissolved in 5% bovine serum albumin (BSA) in a ratio of 1:2 (PA, OA, Sigma-Aldrich, St. Louis, MO) to a final concentration of 1 mM, for 24 h. To inhibit autophagy, chloroquine (CQ; 50 nM; Sigma Aldrich) was added to the medium. To induce autophagy, rapamycin (Rapa; 25 ng/ml; Sigma Aldrich) was added to the medium.
RNA interference
HepG2 cells at 70–80% confluence were transfected with siRNA specific for human OPN and control siRNA (5 μl, 100 nM) using transfection reagent interferin (Polyplus Transfection, USA) following the manufacturer’s instruction (RIOBIO, Shanghai, China). The medium was changed 24 h later. The efficiency of transfection was evaluated by real-time PCR for 24 h and western blot for 48 h.
Analysis of autophagic flux
Cells were transfected with recombinant adenovirus mRFP-GFP-LC3 (Hanbio Biotechnology Co. Ltd., Shanghai, China) transiently. Yellow or red puncta was detected from at least 20 cells after different treatment by confocal microscope for each individual experiment.
Electron microscopy
The liver tissue samples were collected and fixed with 3% glutaraldehyde in 0.2 M sodium cacodylate buffered at Ph 7.4 [Citation18]. Images were acquired using a transmission electron microscope.
Statistical significance
Data were expressed as “mean ± SEM”. Student’s t test associated with GraphPad version 7.0 (GraphPad Software, La Jolla, CA) was used to analyze the differences between groups in the condition of performing experiments at least three times. Statistical significance was set to *, p < .05; **, p < .01, ***, p < .001.
Results
OPN is elevated in NASH patients
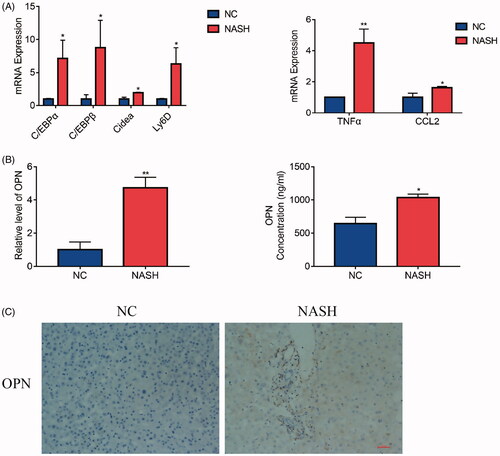
In order to determine the existence and levels of OPN in patients with NASH, OPN expression was evaluated in human liver specimens. Expression of lipogenesis-related genes, such as C/EBPα and C/EBPβ [Citation19–21], was increased in NASH livers. Besides, NASH livers also had markedly higher hepatic gene expression of Cidea [Citation22,Citation23], which is a key player for hepatic lipid storage, and Ly6D [Citation24], presumed to be positively associated with fat content in the liver (). Next, we compared the OPN content in NASH patients compared to the control group. The results showed that OPN mRNA in livers and secreted OPN protein from serum () were significantly higher in NASH patients compared to those in controls. Besides, we examined the expression of OPN in archived human liver biopsies embedded in paraffin from de-identified controls and from patients clinically proven to have NASH. Liver biopsies from NASH patients showed induction of OPN expression compared with control explants ().
Figure 1. Osteopontin (OPN) is elevated in non-alcoholic steatohepatitis (NASH) patients. Liver samples obtained from hepatic haemangioma patients with or without NASH as described in the method and materials section were divided into two groups. (A) qRT-PCR analysis of lipogenesis related molecules in livers with or without NASH. (B) The expression of OPN mRNA in liver from patients with or without NASH (left); The serum was collected from these patients and centrifuged at 14,000×g for 15 min. The OPN concentration was measured by ELISA (right). (C) OPN immunohistochemistry (IHC) analysis in livers from patients with or without NASH (scale bars are shown). Values are means ± SEM. *p < .05; **p < .01; ***p < .001. All experiments were repeated at least thrice.
Increased expression of OPN with impaired autophagy in the livers of NAFLD animal models
To investigate the significance of OPN in the regulation of autophagy in the development of NAFLD, we constructed two experimental NAFLD mice by feeding them with HFD for 16 weeks and with MCD for 8 weeks. Control mice were fed with CD or MCS diet, respectively. HFD and MCD feeding induced liver inflammation, steatosis and injury, as evidenced by HE, Oil Red O staining, and ALT analysis (). Besides, gene expression of C/EBPα, C/EBPβ, Cidea and Ly6D were higher in NAFLD mice models (). All these indicated that NAFLD mouse models were successfully constructed. Liver Masson’s staining, which visualizes collagen in blue, and immunostaining for α-SMA, a marker of HSCs activation, were significantly increased by the HFD and MCD, suggesting that HFD and MCD markedly increased the accumulation of collagen in the liver compared to that of the control group ().
Figure 2. Increased expression of OPN with impaired autophagy in the livers of non-alcoholic fatty liver disease (NAFLD) animal models. Here we constructed two NAFLD models induced by high fat diet (HFD) and methionine-choline-deficient diet (MCD). The control groups were induced by chow diet (CD) and methionine-choline sufficient diet (MCS), respectively. (A) Representative images of H&E, Oil Red O, Masson and αSMA (brown) staining of liver tissue from NAFLD mice and controls (scale bars are shown). (B) Serum ALT levels were compared in NAFLD mice and controls. (C) The mRNA expression of lipogenic molecules in liver from NAFLD mice and controls. (D) The mRNA expression of OPN (brown, the scale bar indicates 100 μm, upper panel). Red arrows indicate autophagosomes, and red arrowheads indicate isolation membranes (lower panel). (E) Hepatic OPN expression measured by qRT-PCR and serum OPN concentration measured by ELISA. (F) The expression of OPN, LC3II and p62 was analyzed by Western blot. Scale bars are shown. Values are means ± SEM. *p < .05; **p < .01; ***p < .001. All experiments were repeated at least thrice.
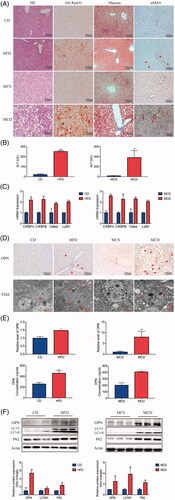
Next, we focussed on OPN. The expression of OPN was increased in NAFLD mice compared with the other control groups ()). In addition, serum OPN protein levels were also increased in NAFLD mice ().
LC3-II, converted by LC3-I conjugated with phosphatidylethanolamine during autophagosome formation [Citation25], increased in livers from HFD and MCD mice (). However, the upregulated LC3-II/LC3-I indicated autophagosomes accumulation instead of direct evidence of increased autophagic flux [Citation11]. Actually, autophagic function should be evaluated by the change in LC3-II levels in the presence and absence of lysosomal inhibitors, such as chloroquine, which measures the rate of LC3-II degradation [Citation25]. Since these methods were not feasible in mouse liver samples, we instead determined protein levels of p62, an autophagic selective substrate (). As the activation of the autophagic flux leads to a decrease in p62 expression [Citation26,Citation27], the accumulation of sequestosome-1 p62 implied that the degradation of autophagy may be suppressed. The electron microscopy (EM) data showed that isolation membranes and autophagosomes were frequently observed in the experimental NAFLD livers compared with control mice (). These data indicate that the increased expression of OPN was in association with impaired autophagic flux.
Increased OPN expression correlated with inhibited autophagy flux in FFA-treated HepG2 cells
To investigate the relationship between OPN and autophagy in NAFLD, HepG2 cell line was cultured and supplemented with free fatty acids (FFAs) to construct an in vitro system [Citation28]. Lipid droplets were accumulated in FFA-treated group compared with those cells treated with BSA (). In addition, lipid-regulating molecules, such as C/EBPα, C/EBPβ, Cidea and Ly6d, were expressed higher in FFA-treated HepG2 cells (). To determine if OPN affects the lipid formation in HepG2 cells, we first detected OPN expression and found out using real-time PCR and western blot that, as the concentration increased, OPN was clearly upregulated in FFA-treated HepG2 cells (). Besides, FFA-treated cells secreted more OPN protein ().
Figure 3. Increased OPN expression correlates with inhibited autophagy flux in HepG2 cells treated with FFA. HepG2 cells were treated with the free fatty acid (FFA) or BSA as controls for 24 h. (A) Lipid accumulation was evaluated by Oil Red O staining and representative images were analyzed by an imaging system (imageJ, National Institutes of Health, the scale bar indicates 100 μm). (B) The mRNA expression of lipogenesis related molecules was analyzed by RT-PCR. (C) HepG2 cells were treated with the indicated concentrations of FFA for 24 h. Expression levels of OPN. (D) Cell culture media were collected and secreted OPN was quantitated by ELISA. (E) Expression levels of OPN and autophagy-related proteins by western blot analysis. (F) LC3 turnover assay for autophagic flux index using chloroquine, a late-phase inhibitor of autophagy. (G-J) HepG2 cells were transfected with two different siRNAs against OPN (siOPN-1, -2) or the negative control (siNC) for 24 h, followed by treatment with or without 1 mM of FFA for 24 h. (G) Lipid accumulation was analyzed by Oil Red O staining and the number of lipid quantification was analyzed by image J (the scale bar indicates 50 μm). (H) The expression of lipogenesis-related genes. (I) Expression levels of OPN, autophagy-related and lipid-related proteins by western blot analysis. (J) HepG2 cells expressing OPN- or control-siRNA were infected with adenovirus containing mRFP-GFP-LC3-PE. After 24 h, the cells were treated with either FFA or BSA for 24 h and the flux rate of autophagy was detected with confocal microscope. Data are schematic drawing of the autophagy process (upper) and microscopy images show red-colored autophagolysosomes or red/green double-colored autophagosomes (lower). Scale bar, 10 μm. Values are means ± SEM. *p < .05; **p < .01; ***p < .001. All experiments were repeated at least thrice.
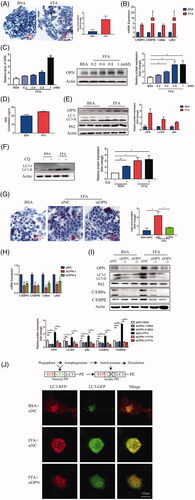
LC3-II that is the lipidation of LC3, is increased in FFA-treated cells according to the western blot analysis (). The latter also showed the accumulation of p62 (), a selective substrate for autophagy [Citation25]. These data implied that FFA treatment suppressed net degradation via autophagy. To confirm this assumption, LC3-II expression levels were compared in the presence and absence of chloroquine (CQ). CQ is a lysosomal inhibitor which inhibits the fusion of autophagosomes with lysosomes [Citation27]. The result showed that CQ sharply increased the levels of LC3-II expression in control of HepG2 cells. However, no further increase was observed in cells supplemented with FFA, which indicated that FFA treatment most likely inhibited the autophagosome maturation to impair autophagic flux ().
Since OPN was related to autophagy, we then further explored the relationship between OPN and autophagy in FFA-induced cell environment. HepG2 cells were interfered with siRNA to knockdown OPN and then followed by supplementary FFA. We observed that silencing of OPN attenuated the accumulation of lipid droplet (). Besides, OPN knockdown (KD) reduced lipid accumulation and attenuated autophagy impairment, evidenced by lower expression of lipid-regulating genes, C/EBPα and C/EBPβ () as well as less conversion of LC3-I to LC3-II and less accumulation of p62 ().
To verify the inhibitory effect of OPN on the control of the autophagic flux, the autophagic flux rate was measured with confocal microscopy using an mRFP-GFP-LC3 reporter construct. The data showed that more ectopically expressed mRFP-GFP-LC3 was detected as red and yellow speckles in FFA-treated control-siRNA cells than in BSA-treated-control-siRNA cells. However, dynamically moving red spots with occasional yellow spots were observed in FFA-treated OPN-siRNA cells, compared to FFA-treated Control-siRNA (), indicating that OPN KD attenuated autophagy impairment. These data suggest that OPN mediates the FFA-suppressed autophagic flux, whereas silencing OPN induces the autophagic flux.
Extracellular OPN exerts its effect on autophagy in FFA-induced HepG2 cells through integrin αv/β3 and αv/β5 containing receptors
To further investigate the role of OPN in autophagy and NAFLD, we used a specific monoclonal antibody to neutralize OPN in vitro. For HepG2 cells supplemented with FFA, the accumulation of lipid droplets was dramatically reduced by the presence of anti-OPN antibody according to the Oil Red O staining (). Besides, the neutralizing antibody significantly reduced the expression of lipid-regulating molecules and attenuated autophagy impairment at the mRNA and protein levels (). CQ was further added to HepG2 cells with neutralizing OPN Ab, and CQ was found to reverse the decrease of C/EBPα and C/EBPβ, as well as the attenuation of autophagy impairment caused by OPN neutralization (). Since OPN exists as two isoforms, secrete OPN (sOPN) and intracellular OPN (iOPN) [Citation29], antibody neutralization study suggests sOPN is very important in regulating autophagy and NAFLD. Here we investigated the secrete form although the participation of intracellular OPN was not excluded. To verify the effect of secrete OPN in autophagy and NAFLD, we added recombinant OPN protein to HepG2 cells with or without FFA. The results showed that exogenous OPN increased lipid accumulation according to the Oil Red O staining () and the expression of lipid-regulating molecules at the RNA and protein levels (). Besides, recombinant OPN protein deteriorated autophagy impairment as evidenced by increases in LC3-II and p62 expression in HepG2 cells supplemented with FFA (). RAPA was further added with recombinant OPN protein and RAPA was found to reverse the increase of lipid-regulating molecules and attenuate the worsened autophagy impairment caused by exogenous OPN ().
Figure 4. Extracellular OPN exerts its effect on autophagy in FFA-induced HepG2 cells through integrin αVβ3 and integrin αVβ5 containing receptors. (A–C) HepG2 cells were supplemented with BSA or FFA treated with control anti-IgG (40 mg/ml) or anti-OPN Ab (40 mg/ml) for 24 h. (A) Lipid accumulation analyzed by Oil Red O staining and quantitated by image J (scale bars are shown). (B) qRT-PCR analysis of C/EBPα, C/EBPβ, Cidea expand Ly6D gene expression (left panel). Analysis of autophagy-related and lipogenesis-related protein expression (right panel). (C) Analysis of autophagy-related and lipogenesis-related proteins expression in samples from HepG2 cells treated with anti-OPN Ab for 24 h and/or CQ (50 nM). (D-F) HepG2 cells were supplemented with BSA or FFA treated with or without recombinant OPN protein (rOPN) (40 ng/ml) for 24 h. (D) Lipid accumulation analyzed by Oil Red O staining and quantitated by image J. (E) qRT-PCR analysis of C/EBPα, C/EBPβ, Cidea and Ly6D gene expression; Analysis of autophagy-related and lipogenesis-related proteins expression. (F) Analysis of autophagy-related and lipogenesis-related proteins expression in samples from HepG2 cells treated with rOPN for 24 h and/or rapamycin (25 ng/ml). (G) HepG2 cells were cultured in control and FFA with anti-lgG or anti-OPN Ab (upper panel) and lgG or rOPN infected with adenovirus containing mRFP-GFP-LC3-PE (lower panel). Red colour shows autophagolysosomes and double-colour red/green shows autophagosomes. Scale bar, 10 μm. (H) mRNA expression of Fasn and Acaca and the FFA oxidation markers Ppara and Ppargc1a in samples from HepG2 cells treated with control IgG or anti-OPN Ab for 24 h. (I) mRNA expression of Fasn and Acaca and the FFA oxidation markers Ppara and Ppargc1a in samples from HepG2 cells treated with control IgG or rOPN for 24 h. (J) Anti-CD44, anti-αVβ3 or anti-αVβ5 antibody was added to the CM in HepG2 cells supplemented with FFA, and qRT-PCR analysis of C/EBPα, C/EBPβ, Cidea and Ly6D gene expression. (K) HepG2 cells were transfected with siNC or siOPN. Anti-CD44, anti-αVβ3 or anti-αVβ5 antibody was added to the CM respectively, and cell lysates were collected for western blotting to detect indicated proteins. Scale bars are shown. Values are means ± SEM. *p < .05; **p < .01; ***p < .001. All experiments were repeated at least thrice.
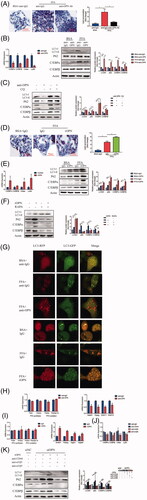
To verify whether inhibitory effect of OPN on autophagy was mediated by secrete form, a specific monoclonal antibody was used to neutralize OPN and exogenous OPN was reintroduced in FFA-treated HepG2 cells. Anti-OPN Ab attenuated autophagy impairment, while exogenous OPN inhibited autophagic flux as evidenced by detected red and yellow speckles ().
Hepatic steatosis is characterized by the rate at which hepatic fatty acid input overweighs the rate of fatty acid oxidation and export and hence an excessive amount of intrahepatic TG is then produced [Citation30]. To investigate the metabolic mechanism involved in the influence of OPN in NAFLD, we examined the expression of genes related to the homeostasis of fatty acid and triacylglycerol in HepG2 cells in order to evaluate the effect of OPN in vivo. No difference was observed in the absence of anti-OPN antibody () or recombinant OPN protein () in the expression of fatty acid synthesis related genes such as Fasn and Acaca or fatty acid oxidation related genes such as Ppara and Ppargc1a [Citation31]. However, the expression of Srebf1, regulator of hepatic lipogenesis was decreased in HepG2 cells with anti-OPN antibody. We next examined the hepatic sterol regulatory element-binding protein 1 (SREBP-1c) target gene Pparg and found that it is also downregulated. The same trend was found in the expression DGAT1 and DGAT2. DGATs, catalysed from diacylglycerol and acylcoenzyme A to form triacylglycerols, are the target genes of Pparg () [Citation32]. The opposite trend was found in the absence of recombinant OPN protein (). These results suggested that OPN may affect hepatic triacylglycerol synthesis via regulating DGATs.
Previous studies showed that sOPN functions by engaging to receptors present on cell surfaces and integrin αVβ3, αVβ5 and CD44 are known receptors for OPN [Citation33]. To investigate which receptor binding with OPN medicate this effect, we used specific antibodies against these receptors. The results showed that autophagy impairment was attenuated and lipid accumulation was reduced when treated with an antibody against integrin αVβ3, αVβ5, mimicking the effect of anti-OPN antibodies. However, anti-CD44 antibody had little effect (). These results strongly suggest that OPN’s effect on autophagy and steatosis is initiated by sOPN binding to integrin αVβ3 and αVβ5.
Antibody-mediated OPN neutralization attenuates hepatic steatosis and recovers the autophagy impairment
To further examine the effect of OPN on NAFLD liver, anti-OPN antibody was used for in vivo study. After the treatment of HFD with anti-OPN Ab and lgG control intravenous injection, the level of serum ALT was lower in anti-OPN group compared to the control group (). In addition, hepatic expression of the inflammatory factors, TNF-α and CCL2, was decreased in anti-OPN group compared with controls (). Notably, liver steatosis was significantly improved evidenced by HE and Oil Red O staining () and difference in the hepatic expression of lipid-related genes such as C/EBPα, C/EBPβ, Cidea and Ly6d (). We next assessed the effect of anti-OPN Ab on the development of liver fibrosis. Liver Masson’s staining and immunostaining for α-SMA were respectively significantly reduced on treatment with anti-OPN Ab, suggesting that anti-OPN Ab supplementation noticeably attenuated collagen accumulation ().
Figure 5. Antibody-mediated OPN neutralization attenuates hepatic steatosis and recovers the autophagy impairment in NAFLD mice induced by HFD. Liver tissues were collected at 24 h after last antibody application. (A) Serum levels of ALT. (B) RT-PCR analysis of TNFα and CCL2. (C) Representative images of H&E, Oil Red O, Masson and αSMA staining of liver tissue. (D) Hepatic mRNA expression of C/EBPα, C/EBPβ, Cidea and Ly6D genes by RT-PCR. (E) Hepatic expression of autophagy-related and lipogenesis-related proteins by western blot analysis and graphs of their quantification. (F) Representative images of TEM observation of the livers of HFD mice treated with anti-OPN Ab, the right panels are amplified from selected areas in the left panels. Red arrows indicate initial or formed autophagosomes which are seen beside or inside the lipid droplets. (G) Hepatic mRNA expression of lipid metabolism-related genes by RT-PCR. Scale bars are shown. Values are means ± SEM. *p < .05; **p < .01; ***p < .001. All experiments were repeated at least thrice.
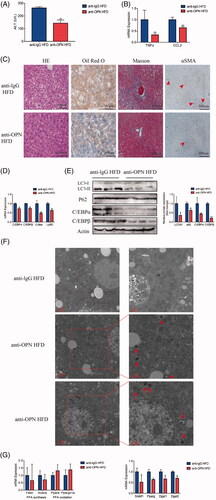
Anti-OPN Ab decreased p62 and LC3-II/LC3-I expression in HFD animals indicating a recovery of the autophagic flux (). TEM revealed that in the livers of the anti-OPN HFD group, a number of autophagosomes beside or inside lipid droplets were observed (). In order to look deeper into plausible processes underlying the impact of OPN in hepatic steatosis, we examined the expression of genes related to the hepatic homeostasis of fatty acid and triacylglycerol. Comparable to the cellular results, anti-OPN Ab protected from hepatic steatosis, or at least partly, by downregulating hepatic triacylglycerol synthesis instead of fatty acid synthesis and oxidation ().
As observed in HFD-fed mice, MCD-fed mice treated with anti-OPN Ab showed lower ALT levels () and decreased hepatic inflammation (). Besides, less lipid was accumulated in anti-OPN group evidenced by HE and Oil Red O staining () and decreased lipid-related genes expression (). Similarly, treatment with anti-OPN Ab reduced collagen accumulation according to liver Masson’s staining and immunostaining for α-SMA.
Figure 6. Antibody-mediated OPN neutralization attenuates hepatic steatosis and recovers the autophagy impairment in NAFLD mice induced by MCD. Liver tissues were collected at 24 h after last antibody application. (A) Serum levels of ALT. (B) RT-PCR analysis of TNFα and CCL2. (C) Representative images of H&E, Oil Red O, Masson and αSMA staining of liver tissue. (D) Hepatic mRNA expression of C/EBPα, C/EBPβ, Cidea and Ly6D genes by RT-PCR. (E) Hepatic expression of autophagy-related and lipogenesis-related proteins by western blot analysis and graphs of their quantification. (F) Representative images of TEM observation of the livers of MCD mice treated with anti-OPN Ab, the right panels are amplified from selected areas in the left panels. Red arrows indicate initial or formed autophagosomes which are seen beside or inside the lipid droplets. (G) Hepatic mRNA expression of lipid metabolism-related genes by RT-PCR. Scale bars are shown. Values are means ± SEM. *p < .05; **p < .01; ***p < .001. All experiments were repeated at least thrice.
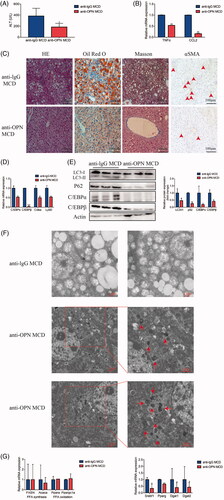
Moreover, autophagy flux was recovered, at least in part, in anti-OPN group of MCD-fed mice compared with the controls (). TEM revealed that in anti-OPN MCD livers, the number of autophagosomes increased inside or beside lipid droplets (). We also confirmed that reduced hepatic triacylglycerol synthesis contributed to the absence of hepatic steatosis in anti-OPN group ().
Discussion
Owing to its high prevalence and relationship to serious cardiometabolic abnormalities, NAFLD has become an important public health issue [Citation34]. Several mechanisms such as perturbation of autophagy and inflammation alteration, as well as mitochondrial dysfunction, are known to be involved [Citation35]. Therefore, the pathogenesis of NAFLD is believed to be a complex and multi-factorial process. OPN is an important inflammatory cytokine, which is upregulated in various models of liver injury [Citation36], but a functional role has not yet been demonstrated clearly.
The breakdown of unnecessary and dysfunctional organelles by autophagy improves hepatic diseases indicating that autophagy may play a significant role in hepatic diseases [Citation37]. In this study, a protein amount of p62 indicated a reciprocal regulation between OPN and autophagy in NAFLD. It has been shown that p62 is a selective substrate for autophagy which means that activation of the autophagic flux causes a decrease in the expression of p62. On the other hand, an accumulation of p62 leads to a decline in autophagic flux [Citation27]. Also, the inhibition of autophagosome-lysosome fusion may lead to the restraint of autophagy maturation [Citation27]. LC3-II scatters evenly within the cytoplasm. Thus, the accumulation of LC3-II and autophagosomes may be the result of a blockage of the autophagic flux. Hence, it is possible that the fusion of elevated p62 and punctuate LC3-II, observed in liver samples from both NAFLD mice models, could be reflecting inhibition of autophagosome degradation. Moreover, we used FFA to induce HepG2 cells to simulate the in vivo environment of NAFLD to verify inhibited autophagic flux, most likely through a block at the maturation step of the autophagosome. In this study, we learned for the first time that OPN exerted its effect via inhibiting autophagic flux in NAFLD. OPN silencing mediated by siRNA clearly inhibited the expression of p62 and LC3-II, further indicating that OPN is a pivotal suppressor of autophagy in FFA-treated cells. These effects of OPN are exerted through integrin αVβ3, αVβ5, which elicit inducing TG synthesis and further the induction of lipid-related genes.
Autophagosomes can engulf and deliver the content of lipid droplets to lysosomes, in which the lipid droplets are degraded by lysosomal acid lipase [Citation38]. This process is termed “lipophagy” and is still not fully understood yet. Our findings indicate that OPN may inhibit lipophagy, leading to an excess accumulation of lipid droplets, at least in part. TEM examination showed abundant lipid droplets that were attached by autophagosomes in the hepatocytes of anti-OPN Ab-treated mice supporting the idea that lipophagy is accelerated in anti-OPN Ab livers thereby rescuing fatty liver and progressive NAFLD.
OPN can be located not only in the nucleus (intracellular OPN, iOPN) but also in the cytoplasm (secreted OPN, sOPN) [Citation39]. Derived from post-translational modified OPN mRNA, the two distinct parts have different biological functions [Citation40]. Here we showed that the secreted OPN was involved in the autophagy impairment, evidenced by anti-OPN antibody or recombinant OPN protein significantly recovered or decreased autophagy flux, respectively. The effect of sOPN was further verified that anti-OPN Ab intravenous injection in mice attenuated autophagy impairment and decreased lipid accumulation. However, the effect of intracellular OPN was not dismissed, since intracellular OPN contributed to signal transduction processes and was associated with cell migration which is very important in the pathogenesis of many diseases including NAFLD [Citation30,Citation41]. Thus, intracellular OPN should not be neglected in future research. OPN belonging to the small integrin binding ligand N-linked glycoprotein (SIBLING) family, engaging to different types of receptors such as integrins and CD44 receptors controls signalling cascades that influence different types of cell behaviours [Citation39]. In this experiment, we discovered that the power of OPN to inhibit autophagy and enhance lipid accumulation is mediated by its receptor integrin αVβ3 and αVβ5, sustained by the fact that the autophagy flux was recovered by blocking the integrin αVβ3 and αVβ5 activity with its specific antibody.
Steatosis, the hallmark feature of NAFLD, occurs when an excessive amount of intrahepatic TG is synthesized [Citation27]. Expression of marker genes showed no change in fatty acid oxidation and synthesis while OPN was neutralized or supplemented. Interestingly, the lipogenic regulator Pparg was significantly altered consequent to the expression of DGATs, which catalyze triacylglycerol formation [Citation27]. Similar results were obtained when we used anti-OPN Ab to investigate the impact of OPN in NAFLD in vivo. Hence, our data point towards OPN induced hepatic triacylglycerol synthesis, underlying the accumulation of steatosis.
Altogether, our results indicated that secreted OPN binded with its receptor integrin αVβ3, αVβ5 and inhibited autophagy maturation, which further promoted TG synthesis thereby promoting the progression of NAFLD [Citation42]. Therefore, targeting OPN would be a potentially novel therapeutic method for halting the progression of NAFLD and our study might prove to be an effective path towards the treatment of NAFLD.
Supplemental_Material.docx
Download MS Word (21.6 KB)Disclosure statement
All authors in this manuscript declare that there is no conflict of interest associated with the work.
Additional information
Funding
Related Research Data
References
- Lomonaco R, Sunny NE, Bril F, et al. Nonalcoholic fatty liver disease: current issues and novel treatment approaches. Drugs. 2013;73(1):1–14.
- Brunt EM: pathology of nonalcoholic fatty liver disease. Nat Rev Gastroenterol Hepatol. 2010;7(4):195–203.
- Ashkar S, Weber GF, Panoutsakopoulou V, et al. Eta-1 (osteopontin): an early component of type-1 (cell-mediated) immunity. Science. 2000;287(5454):860–864.
- Wang X, Lopategi A, Ge X, et al. Osteopontin induces ductular reaction contributing to liver fibrosis. Gut. 2014;63(11):1805–1818.
- Urtasun R, Lopategi A, George J, et al. Osteopontin, an oxidant stress sensitive cytokine, up-regulates collagen-I via integrin alpha(V)beta(3) engagement and PI3K/pAkt/NFkappaB signaling. Hepatology. 2012;55(2):594–608.
- Kiefer FW, Neschen S, Pfau B, et al. Osteopontin deficiency protects against obesity-induced hepatic steatosis and attenuates glucose production in mice. Diabetologia. 2011;54(8):2132–2142.
- Sahai A, Malladi P, Pan X, et al. Obese and diabetic db/db mice develop marked liver fibrosis in a model of nonalcoholic steatohepatitis: role of short-form leptin receptors and osteopontin. Am J Physiol Gastrointest Liver Physiol. 2004;287(5):G1035–1043.
- Kwon HJ, Won YS, Yoon WK, et al. The role of osteopontin in d-galactosamine-induced liver injury in genetically obese mice. Toxicol Appl Pharmacol. 2010;242(3):344–351.
- Kiefer FW, Zeyda M, Gollinger K, et al. Neutralization of osteopontin inhibits obesity-induced inflammation and insulin resistance. Diabetes. 2010;59(4):935–946.
- Czaja MJ. Functions of autophagy in hepatic and pancreatic physiology and disease. Gastroenterology. 2011;140(7):1895–1908.
- Mizushima N, Levine B. Autophagy in mammalian development and differentiation. Nat Cell Biol. 2010;12(9):823–830.
- Neufeld TP. TOR-dependent control of autophagy: biting the hand that feeds. Curr Opin Cell Biol. 2010;22(2):157–168.
- Levine B, Sinha S, Kroemer G. Bcl-2 family members: dual regulators of apoptosis and autophagy. Autophagy. 2008;4(5):600–606.
- Fujita N, Itoh T, Omori H, et al. The Atg16L complex specifies the site of LC3 lipidation for membrane biogenesis in autophagy. MBoC. 2008;19(5):2092–2100.
- Komatsu M, Kurokawa H, Waguri S, et al. The selective autophagy substrate p62 activates the stress responsive transcription factor Nrf2 through inactivation of Keap1. Nat Cell Biol. 2010;12(3):213–223.
- Mialet-Perez J, Vindis C. Autophagy in health and disease: focus on the cardiovascular system. Essays Biochem. 2017;61(6):721–732.
- Ferreira DM, Castro RE, Machado MV, et al. Apoptosis and insulin resistance in liver and peripheral tissues of morbidly obese patients is associated with different stages of non-alcoholic fatty liver disease. Diabetologia. 2011;54(7):1788–1798.
- Tanaka S, Hikita H, Tatsumi T, et al. Rubicon inhibits autophagy and accelerates hepatocyte apoptosis and lipid accumulation in nonalcoholic fatty liver disease in mice. Hepatology. 2016;64(6):1994–2014.
- Rahman SM, Schroeder-Gloeckler JM, Janssen RC, et al. CCAAT/enhancing binding protein beta deletion in mice attenuates inflammation, endoplasmic reticulum stress, and lipid accumulation in diet-induced nonalcoholic steatohepatitis. Hepatology. 2007;45(5):1108–1117.
- Guzman C, Benet M, Pisonero-Vaquero S, et al. The human liver fatty acid binding protein (FABP1) gene is activated by FOXA1 and PPARalpha; and repressed by C/EBPalpha: implications in FABP1 down-regulation in nonalcoholic fatty liver disease. Biochim Biophys Acta. 2013;1831(4):803–818.
- Guillory B, Jawanmardi N, Iakova P, et al. Ghrelin deletion protects against age-associated hepatic steatosis by downregulating the C/EBPalpha-p300/DGAT1 pathway. Aging Cell. 2018;17(1):e12688.
- Zhou Z, Yon Toh S, Chen Z, et al. Cidea-deficient mice have lean phenotype and are resistant to obesity. Nat Genet. 2003;35(1):49–56.
- Zhou L, Xu L, Ye J, et al. Cidea promotes hepatic steatosis by sensing dietary fatty acids. Hepatology. 2012;56(1):95–107.
- Guillen N, Navarro MA, Arnal C, et al. Microarray analysis of hepatic gene expression identifies new genes involved in steatotic liver. Physiol Genom. 2009;37(3):187–198.
- Mizushima N, Yoshimori T, Levine B. Methods in mammalian autophagy research. Cell. 2010;140(3):313–326.
- Bjorkoy G, Lamark T, Brech A, et al. p62/SQSTM1 forms protein aggregates degraded by autophagy and has a protective effect on huntingtin-induced cell death. J Cell Biol. 2005;171(4):603–614.
- Klionsky DJ, Abdelmohsen K, Abe A, et al. Guidelines for the use and interpretation of assays for monitoring autophagy (3rd edition). Autophagy. 2016;12(1):1–222.
- Xie F, Jia L, Lin M, et al. ASPP2 attenuates triglycerides to protect against hepatocyte injury by reducing autophagy in a cell and mouse model of non-alcoholic fatty liver disease. J Cell Mol Med. 2015;19(1):155–164.
- Liu G, Fan X, Tang M, et al. Osteopontin induces autophagy to promote chemo-resistance in human hepatocellular carcinoma cells. Cancer Lett. 2016;383(2):171–182.
- Fabbrini E, Sullivan S, Klein S. Obesity and nonalcoholic fatty liver disease: biochemical, metabolic, and clinical implications. Hepatology. 2010;51(2):679–689.
- Kim JB, Wright HM, Wright M, et al. ADD1/SREBP1 activates PPARgamma through the production of endogenous ligand. Proc Natl Acad Sci USA. 1998;95(8):4333–4337.
- Yen CL, Stone SJ, Koliwad S, et al. Thematic review series: glycerolipids. DGAT enzymes and triacylglycerol biosynthesis. J Lipid Res. 2008;49(11):2283–2301.
- Hu DD, Lin EC, Kovach NL, et al. A biochemical characterization of the binding of osteopontin to integrins alpha v beta 1 and alpha v beta 5. J Biol Chem. 1995;270(44):26232–26238.
- Kopelman PG. Obesity as a medical problem. Nature. 2000;404(6778):635–643.
- Wree A, Broderick L, Canbay A, et al. From NAFLD to NASH to cirrhosis-new insights into disease mechanisms. Nat Rev Gastroenterol Hepatol. 2013;10(11):627–636.
- Bertola A, Deveaux V, Bonnafous S, et al. Elevated expression of osteopontin may be related to adipose tissue macrophage accumulation and liver steatosis in morbid obesity. Diabetes. 2009;58(1):125–133.
- Yang L, Li P, Fu S, et al. Defective hepatic autophagy in obesity promotes ER stress and causes insulin resistance. Cell Metab. 2010;11(6):467–478.
- Singh R, Kaushik S, Wang Y, et al. Autophagy regulates lipid metabolism. Nature. 2009;458(7242):1131–1135.
- Chen Q, Shou P, Zhang L, et al. An osteopontin-integrin interaction plays a critical role in directing adipogenesis and osteogenesis by mesenchymal stem cells. Stem Cells. 2014;32(2):327–337.
- Rangaswami H, Bulbule A, Kundu GC. Osteopontin: role in cell signaling and cancer progression. Trends Cell Biol. 2006;16(2):79–87.
- Kanda T, Matsuoka S, Yamazaki M, et al. Apoptosis and non-alcoholic fatty liver diseases. World J Gastroenterol. 2018;24(25):2661–2672.
- Lavallard VJ, Gual P. Autophagy and non-alcoholic fatty liver disease. Biomed Res Int. 2014;2014:1.