
 ?Mathematical formulae have been encoded as MathML and are displayed in this HTML version using MathJax in order to improve their display. Uncheck the box to turn MathJax off. This feature requires Javascript. Click on a formula to zoom.
Abstract
Celastrol is used in traditional Chinese medicine for treating cancers. However, its low water solubility and poor tumour selection represent major pitfalls for clinical application. In the present study, gold nanoparticle (AuNP) firstly was conjugated with PVP-co-2-dimethylaminoethyl methacrylate (Polymer) and celastrol then modified by folic acid. The as-prepared folate receptor-targeted celastrol AuNP (FCA) was characterized using attenuated total reflection Fourier transform infrared spectroscopy, UV-Vis spectrometry, transmission electron microscope, and inductively coupled plasma mass spectrometry. The physical properties of FCA were also determined in solubility, drug encapsulation and in vitro drug release. Its anticancer activities were assessed in the 2D and 3D breast cancer models. The results showed that FCA was synthesized successfully with good solubility, high encapsulation efficiency and loading content. FCA showed the optimal cumulative release at pH 5.0 and high cellular uptake and exhibited significant inhibition on breast cancer cells. FCA also induced more significant apoptosis either in 2D and 3D breast cancer model than the celastrol AuNP and celastrol alone. These findings demonstrate that FCA improves water solubility of celastrol and enhances its anticancer activities against breast cancer. FCA might be a potential candidate of anticancer drug for breast cancer in the future if further development.
Introduction
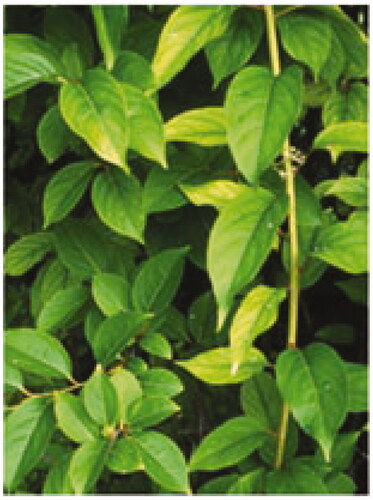
Celastrol (), a pentacyclic triterpenoid isolated from the root extracts of Tripterygium wilfordii (), has been used in traditional Chinese medicine for treating cancers [Citation1]. It induces apoptosis of cancer cells via inhibition of proteasome, topoisomerase activity, vascular endothelial growth factor receptor expression and so on. However, its poor water solubility, low bioavailability in the oral administration, and poor tumour selection limit its clinical applications. Recently, nano delivery system shows promise in improving the water solubility and bioavailability of insoluble drugs and enhancing therapeutic efficacy [Citation2].
Figure 1. Chemical structure of celastrol.
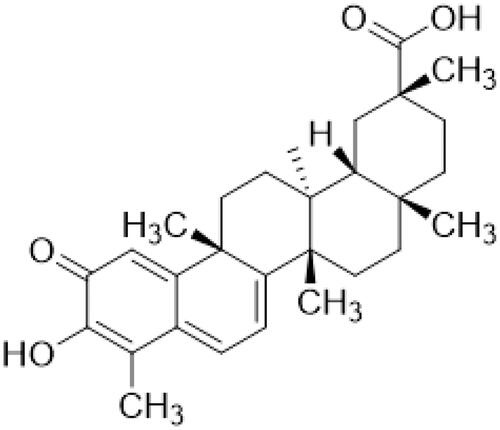
Figure 2. Tripterygium wilfordii.
Nanoparticle encapsulation could improve the solubility of active components from traditional Chinese herbs. For example, triptolide-loaded nanoparticles improved the solubility of triptolide, controlled its release, realised the target delivery of triptolide and avoided the toxicity at non-target site [Citation3]. Nowadays, noble metals like platinum, gold and silver are recently being reckoned as treasured precursors in the design of inventive nano-device systems that are fabricated and incorporated for the functional aspects of nanoparticles [Citation4]. Non-toxic Au is highly unreactive and chemically inert in nature. Gold nanoparticle (AuNP) is used as functional material and exhibited various advantageous properties such as tuneable sizes, facile synthesis, easy modification and strong optical properties that initiate the light absorptivity in biomedical applications including magnetic resonance imaging, cancer drug nanotechnology, etc.
It has been reported that celastrol nanoparticles could increase water solubility and cellular uptake [Citation5]. The celastrol nanoparticle was modified to amphipathic molecules in order to enhance the passive targeting effect on tumour through the absorption and metabolism. Celastrol-loaded poly(ethylene glycol)-block-poly(ɛ-caprolactone) nanopolymeric micelles [Citation6] were also developed to improve the hydrophilicity of celastrol and PEGylated polyaminoacid-capped celastrol-loaded mesoporous silica nanoparticles [Citation7] to control the in vitro drug release behaviour which exhibited high cytotoxicity in different cancer cells. In the previous celastrol research, they mainly focussed on the solubility, cellular uptake, and in vitro drug release. Considering that folic acid (FA) is an important ligand, which can specifically target and bind the folate receptor overexpressing on the surface of breast cancer cells. Folic acid-modified Doxorubicin nanoparticles (Dox-PLD-FA) showed a specific target to cancer cells, which overexpresses the folate receptor [Citation8]. Thus, a celastrol loaded gold nanoparticle with folate-targeting activity was designed in the present study to improve the water solubility and enhance anticancer activity of celastrol.
PVP-co-2-dimethylaminoethyl methacrylate is a bulky, non-toxic, non-ionic polymer with C=O, C–N, and CH2 functional groups [Citation9]. It is a proven drug carrier and more soluble in water compared to PEG because of the PVP molecule contains a strongly hydrophilic component (pyrrolidone moiety) and a hydrophobic group (alkyl group). The polymer is a great stabilizer for preventing the aggregation of nanoparticles through the repulsive forces arising from its hydrophobic carbon chains that extend into solvents and interaction with each other (steric hindrance effect). It has also acted as a linker to facilitate the conjugation of celastrol with gold nanoparticles to improve its water solubility or potentials in controlled release and avoid the toxicity at non-target site which increases the drug specificity.
Experimental sections
Materials
Celastrol (purity:98%) was purchased from Xi’an Lyphar Biotech Co. Ltd, Xi'an city, China. Gold nanoparticle (AuNP) 20 nm was bought from Cline Scientific AB Biotechnology company in Mölndal, Sweden. PVP-co-2-dimethylaminoethyl methacrylate, folic acid, sodium hydroxide, dialysis tubing, dialysis bag, fluorescein isothiocyanate (FITC) and Agar powder were obtained from Sigma Aldrich (St. Louis, MO, USA) in Hong Kong. A 3-(4,5-dimethylthiazol-2-yl)-2,5-diphenyltetrazolium bromide (MTT) and 2,5′-bi-1H-benzimidazole (Hoechst 33342) were purchased from Life Technologies (Waltham, MA, USA). All the other agents were of analytical grade and were used without further purification. Deionised (DI) and ultra-pure water (UPW) were purified by a Milli-Q system (Millipore, St. Louis, MO, USA).
Synthesis of celastrol AuNP (CA)
A lesser amount of 0.68 mg polymer/12.5 ml AuNP solution was added to perform polymer capping and then heated to 80 °C and continuously stirred for 45 min. The solution was cooled down to room temperature (RT) under stirring. It was heated to 60 °C and conjugation of celastrol commenced. About 10 mg of celastrol was dissolved in 2 ml ethanol and added to the pre-heated solution. The heating was terminated after 3 h and continuous cooling with stirring. Superfluous amount of celastrol was removed using centrifugation.
Synthesis of folate receptor targeted celastrol AuNP (FCA)
Celastrol (40 mg) and folic acid was dissolved (50 mg/mL in 1 M NaOH), then added to the above mixture (CA) with stirring at 45 °C. The colour was changed from a yellow-red tone to a deep red and pH was reached to 1. After reaction for 3 h, the product was cooled to RT. Superfluous amount of folic acid was removed using dialysis overnight, then the pH was back to 7.5 and celastrol was added again in the same way as previously.
Structural determination, photochemical properties and morphology
FCA was characterised using attenuated total reflection Fourier transform infrared spectroscopy (ATR-FTIR, Bruker, Billerica, MA, USA) and UV-Vis absorption spectroscopy (UV, Beckman Coulter Inc., San Jose, CA, USA) to acquire the absorption spectrum. Transmission electron microscopy (TEM, Hitachi S-5500, Hitachi, Chiyoda-ku, Tokyo, Japan) was used to observe the morphology and size distribution of nanoparticles in AuNP, CA and FCA.
Concentration of gold in AuNP, CA, and FCA
The gold contents in AuNP, CA and FCA were determined using an inductively coupled plasma mass spectrometry (ICP-MS, Nexion 1000 Perkin Elmer, Kleve, North Rhine-Westphalia, Germany). Briefly, 100 μl of gold solution was pipetted from 1000 ppm (µg/mL) gold standard then made up to 10 ml (10 ppm) in volumetric flask. The calibration curves were prepared by 10 ppm gold solution in four concentrations such as 0.02, 0.04, 0.1 and 1 mg/L. The samples were injected after the calibration curves were established.
Solubility test
The solubility of celastrol, CA and FCA were tested in double-distilled water (DDW), phosphate-buffered saline (PBS; 50 mM, pH 7.4) and Dulbecco’s Modified Eagle Medium (DMEM). Celastrol (0.8 mg/mL) and an aliquot of CA (celastrol content, 0.8 mg/mL calculated from 10 mg of celastrol in 12.5 ml), FCA (celastrol content, 0.8 mg/mL calculated from 40 mg of celastrol in 50 ml) were added to the 3 ml by using above media. These solutions were allowed to stand for 3 days at RT and photographed.
In vitro drug encapsulation
Celastrol carrying capacity of FCA was measured by drug loading and encapsulation efficiency. The amount of non-encapsulated drug was measured in the supernatant after centrifugation then calculated the encapsulation efficiency (EE) and drug loading (LC) by using the following equations:
Encapsulation efficiency (EE) was equal to
Loading content (LC) was equal to
In vitro drug release (Stability test)
About 0.1 g lyophilised powder of FCA was weighed and then dissolved into 1 ml of different pH values PBS such as pH 5, pH 6.8, and pH 7.4. The absorbance was measured at 425 nm wavelength for each time points including 0, 1, 2, 4, 6, 8, 10, 12, 24, 48 and 72 h.
2D breast cancer cell culture
Breast cancer MCF-7 cells (ATCC, Manassas, VA, USA) were cultured and maintained in DMEM containing with 10% FBS and 1% penicillin-streptomycin-neomycin antibiotic mixture. The humidified incubator with 5% CO2 and 95% air was used to culture cells at 37 °C.
Cellular uptake
To measure cellular uptake of folic acid, celastrol, AuNP, CA and FCA in the breast cancer cells. Firstly, 2.5 μM AuNP, 2.5 μM CA and 2.5 μM FCA nanoparticles were dissolved in 2 ml ethanol solution and 0.5 mM of FITC, then stirred for 24 h at RT. After centrifugation for 20 min at 12,000 rpm, the NPs were washed twice with 1 ml of ethanol and dried under air overnight [Citation10]. 2.5 μM folic acid and 2.5 μM celastrol were not added FITC. Cells were rinsed twice with PBS (pH 7.4) and replenished with 1 ml serum-free medium containing the 2.5 μM FITC-AuNP, 2.5 μM FITC-CA, 2.5 μM FITC-FCA nanoparticles, 2.5 μM folic acid and 2.5 μM celastrol. After incubation, the cells were washed three times with chilled PBS. Relative FITC Green Fluorescence Intensity (of control) in breast cancer cells in the control, folic acid treatment group, celastrol treatment group, AuNP treatment group, CA treatment group, and FCA treatment group were analyzed by flow cytometry with the excitation wavelength at 488 nm (FL1).
Cytotoxicity in 2D breast cancer model
The cytotoxicity of celastrol, folic acid, AuNP, CA and FCA against breast cancer cells were assessed at various time points using an MTT assay. In brief, cells were seeded in 96-well plates at a density of 5 × 10⁴ cells per well overnight, then treated with various concentrations (Celastrol: 20, 10, 5, 2.5, 1.25, 0.625, 0.313, 0.156, 0.078, 0 μM; folic acid: 20, 10, 5, 2.5, 1.25, 0.625, 0.313, 0.156, 0.078, 0 μM; AuNP:5, 2.5, 1.25, 0.625, 0.325, 0.156, 0.078, 0 μM; CA: 40, 20, 10, 5, 2.5, 1.25, 0.625, 0.313, 0.156, 0 μM; FCA: 160, 80, 40, 20, 10, 5, 2.5, 1.25, 0.625, 0 μM of each NP for 24 h). The celastrol content for CA and FCA were adjusted by the control samples through the mass and ratio in order to make sure the concentration of celastrol were consistent for both samples. The absorbance at 570 nm was measured using a microplate reader and relative cell viability was calculated.
Colony-forming unit assay
Breast cancer cells were plated at a density of 7 × 10² cells per well in 24 well plates and treated with celastrol, folic acid, AuNP, CA and FCA at various concentrations as described above. The breast cancer cells alone (Control) also have been maintained. Media was altered after 48 h of incubation and the colonies were observed further for 14 days. Cells were stained using crystal violet. Colony number was counted manually.
Cell apoptosis
Breast cancer cells were placed in a six-well culture plate at a density of 5 × 10⁵ cells per well and treated with 2.5 μM of each celastrol, folic acid, AuNP, CA and FCA for 24 h. Normal, apoptotic and necrotic cells were distinguished using an Annexin V-FITC/propidium iodide assay kit. Cells were washed with PBS, resuspended in 500 μL of binding buffer and 1 μL of AnnexinV-FITC was added to the samples. After incubation for 5 min at 4 °C in the dark, 1 μL of propidium iodide was added and the mixture was incubated for 5 min at 4 °C. Cell apoptosis was evaluated using flow cytometry after 24 h of exposure.
Nuclear staining
Breast cancer cells were seeded in a 24-well plate at a seeding density of 2 × 10⁴ cells per well and incubated with 2.5 μM of each celastrol, folic acid, AuNP, CA and FCA for 24 h. After cells were washed twice, cells were stained with Hoechst 33342 (10 g/L) for 5 min at 37 °C in the dark. The stained cells were washed three then observed immediately under a confocal laser scanning microscopy. A filter set of ex/em (excitation wavelength/emission wavelength) of BP395-380/LP450 nm was used and images were recorded by a colourful colour charge-coupled device camera.
Assessment of mitochondrial membrane potential (MMP)
The assessment of MMP was conducted using flow cytometric analysis with JC-1 staining. Breast cancer cells were placed in a six-well culture plate at a density of 5 × 10⁵ cells per well and treated with 2.5 μM of each celastrol, folic acid, AuNP, CA and FCA for 24 h. After cells were incubated for 20 min at 37 °C in 1 ml of culture medium containing JC-1, the cells were rinsed twice with ice-cold JC-1 staining buffer and subsequently analysed using flow cytometry.
Tumour growth and apoptosis assay in 3D breast cancer model
Firstly, 3D breast cancer model was established according to routine method [Citation11]. The 3D model cells were randomly divided by eight experimental groups including (1) breast cancer cells alone (Control), (2) folic acid treatment, (3) celastrol treatment, (4) celastrol and folic acid treatment, (5) AuNP treatment, (6) AuNP and folic acid treatment, (7) CA treatment, (8) FCA treatment. The formation of 3D breast cancer in each group was observed after 3, 5, 7 days, respectively using light microscope. Cell apoptosis in each group were investigated using an Annexin V-FITC/propidium iodide assay kit. Cell apoptosis in each group were evaluated using flow cytometry after 24 h of exposure.
Statistical analysis
Data were expressed as mean SD and determined by one-way or two-way ANOVA with Tukey’s multiple comparison tests by using GraphPad Prism 5.0 software (San Diego, California, USA). The difference between control and test groups was considered as statistically significant if P < 0.05.
Results and discussion
Synthesis of CA and FCA
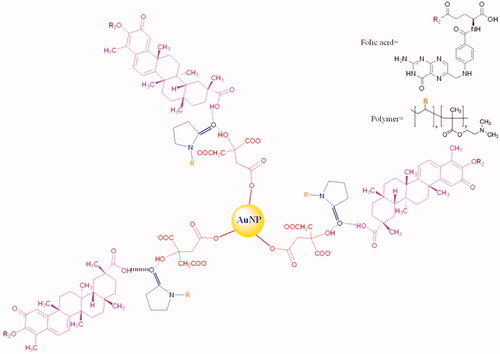
CA and FCA was prepared successfully. Celastrol, AuNP and folic acid were the major components in FCA but CA with celastrol and AuNP only. Bascially, trisodium citrate was used to produce three of the citric acids on AuNP surface. PVP-co-2-dimethylaminoethyl methacrylate (PVP) was acting as linker conjugated to the citric acid and celastrol by capping. There was a strong intermolecular force formed, called “Hydrogen bonding” since the lone pair electrons from oxygen atom in pyrrolidin-2-one donated to the hydroxyl group (–OH) of citric acid and carboxylic group (–COOH) of celastrol, respectively. The electrons were donated by PVP and adsorbed on gold surface. It increased the electron density on Au core and induced the formation of Auδ- surface states to activate dioxygen generating superoxo- or peroxo-like species. These species enhanced the catalyst activity and protected AuNP () [Citation12]. Thus, CA () was prepared as a control group for FCA (). FCA was finally synthesised by acid-base reaction. The colour changed from a yellow-red tone to a deep red because the hydroxyl group (–OH) of celastrol reacted with the carboxylic group (–COOH) of folic acid. Celastrol was in excess (around four times, 40 mg) and folic acid (50 mg/mL) dissolved in 1 M NaOH during the synthesis of FCA in order to ensure that celastrol and folic acid were reacted completely. This maintained the mole ratio of celastrol and folic acid in 1:1. Three of the celastrol linked with three folic acid and conjugated by the PVP and citric acids which attached to the surface of AuNP.
Figure 3. Dioxygen activation by PVP-induced charge transfer.
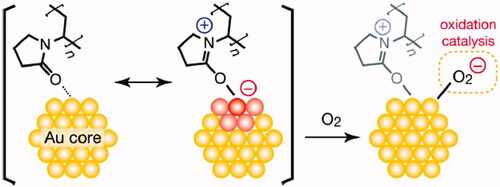
Figure 4. Chemical structure of celastrol AuNP (CA).
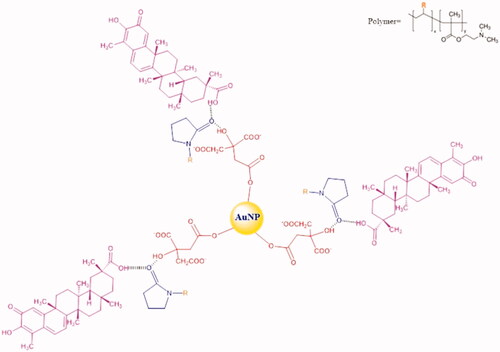
Figure 5. Chemical structure of folate receptor targeted celastrol AuNP (FCA).
Structural determination
The infra-red spectrum of (i) folic acid (Figure S1), (ii) celastrol (Figure S2), (iii) PVP-co-2-dimethylaminoethyl methacrylate (Figure S3), (iv) CA (Figure S4) and (v) FCA (Figure S5) were determinate using ATR-FTIR (Table S1). It was indicated that CA and FCA were capped by the PVP-co-2-dimethylaminoethyl methacrylate successfully because there was a shift for C–H stretching and N–H bending. FCA was linked with folic acid, hence, there was an additional CO–O–CO stretching appeared.
Photochemical properties
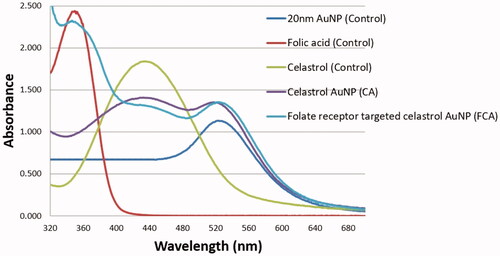
UV–Vis spectra () was shown of (i) AuNP, (ii) folic acid, (iii) celastrol, (iv) CA and (v) FCA in aqueous medium. There were two absorption peaks in 425 nm and 518 nm for CA, three absorption peaks in 345 nm, 425 nm and 518 nm for FCA. An absorption peak at 425 nm which was the quinone methide chromophore group of celastrol. The remaining absorption peaks in 345 nm and 518 nm that were the pteridine ring of folic acid and characteristic peak of AuNP. The UV-Vis spectra of CA and FCA were clearly shown two or three distinct peaks at 345 nm, 425 nm and 518 nm which confirmed that the folic acid, celastrol and AuNP were interacted. There was a little bit shift (red shift) in the absorption peaks for folic acid, celastrol and AuNP of FCA because these absorption peaks were attributed to the conjugation of PVP functionalised gold nanoparticle (AuNP) and folic acid with celastrol [Citation13].
Figure 6. UV–Vis spectra of gold nanoparticle (AuNP), folic acid, celastrol, celastrol AuNP (CA), and folate receptor targeted celastrol AuNP (FCA).
Morphology
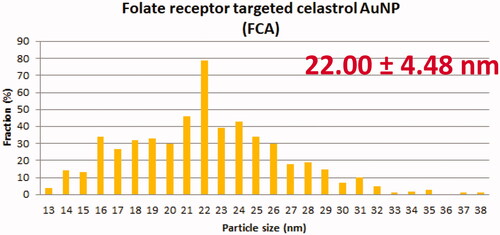
TEM showed that AuNP (), CA () and FCA () were equally distributed at nanoscale size. The size of AuNP (), CA () and FCA () were ranged from 11 nm to 38 nm in different percentage of fractions. The average size of as-prepared AuNP was 20.02 4.70 nm. The average sizes of CA and FCA were around 21.45
4.76 nm and 22.00
4.48 nm. The mean sizes of FCA increased from 20 nm to 22 nm because PVP-co-2-dimethylaminoethyl methacrylate and folic acid were conjugated. FCA average size was the greatest compared to CA and AuNP.
Figure 7. TEM image of gold nanoparticle (AuNP). Scale bar = 200 nm.
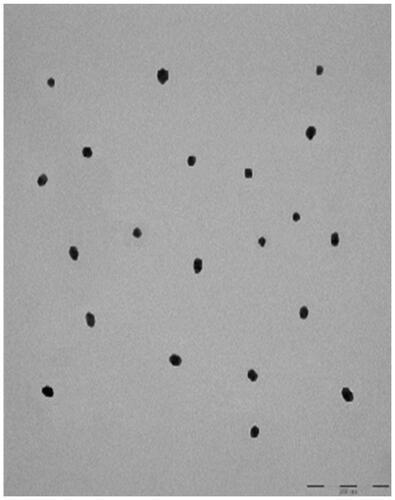
Figure 8. TEM image of celastrol AuNP (CA). Scale bar = 200 nm.
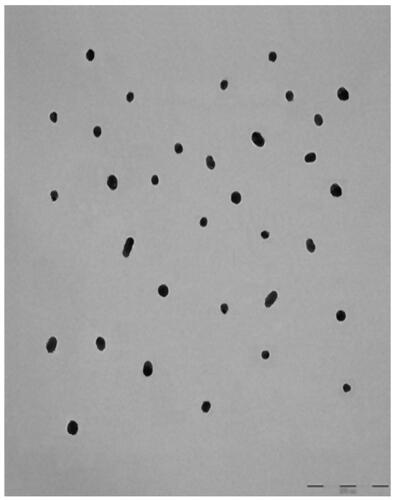
Figure 9. TEM image of folate receptor targeted celastrol AuNP (FCA). Scale bar = 200 nm.
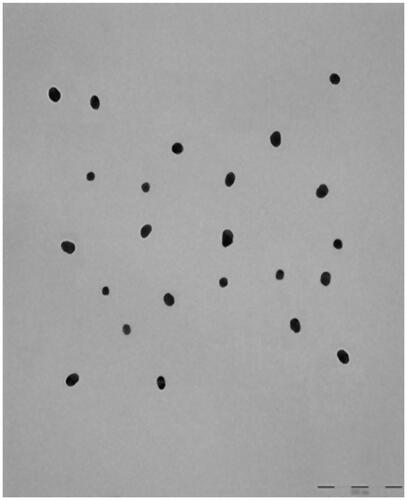
Figure 10. Nanoparticle size of gold (AuNP).
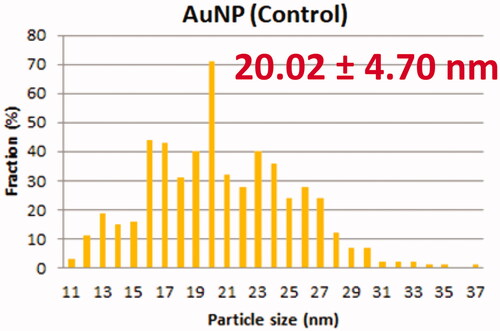
Figure 11. Nanoparticle size of celastrol AuNP (CA).
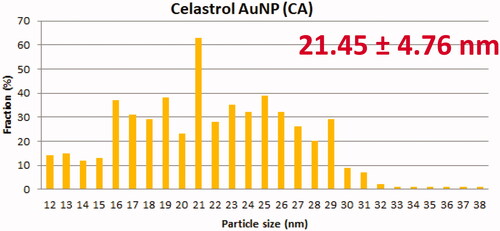
Figure 12. Nanoparticle size of folate receptor targeted celastrol AuNP (FCA).
Concentration of gold in AuNP, CA and FCA
The concentration of gold in AuNP, CA and FCA were 0.06, 0.034 and 0.015 mg/mL, respectively. There was a decreasing trend for the concentration of gold in nanoparticle from the raw material, AuNP to CA and the final product, FCA. The major reason was the multiple synthesis steps during the experimental procedures. It was difficult to prevent the loss of gold content but the concentration of gold must be kept 0.3 nM (0.3 × 10⁻⁹ M) or above [Citation14].
Solubility test
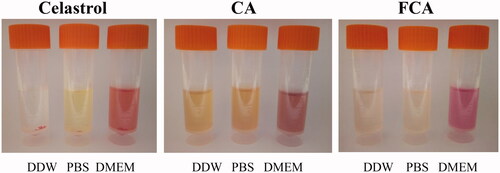
Celastrol was insoluble or sparingly soluble in double-distilled water (DDW), PBS (50 mM, pH 7.4) and DMEM. It was unstable in various media because of the precipitation. 0.8 mg/mL of FCA was dissolved completely and the solubility was increased after PVP encapsulation of AuNP or linked with the folic acid since the highly polar amide group, apolar methylene and methine groups within the pyrrolidone ring along PVP backbone (), therefore, CA and FCA showed better solubility or dispersion in all of these mediums ().
Figure 13. Polar amide group, apolar methylene and methine groups in PVP-co-2-dimethylaminoethyl methacrylate (PVP) backbone.
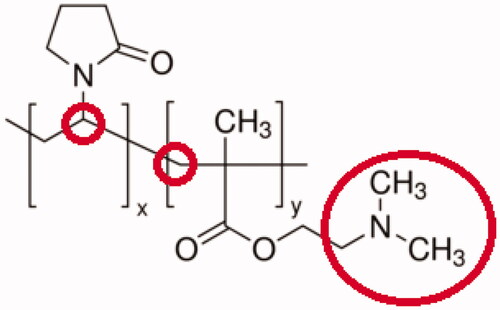
Figure 14. Solubility of celastrol, celastrol AuNP (CA) and folate receptor targeted celastrol AuNP (FCA) in double distilled water (DDW), phosphate-buffered saline (PBS; 50 mM, pH 7.4) and Dulbecco’s Modified Eagle Medium (DMEM).
Celastrol encapsulation
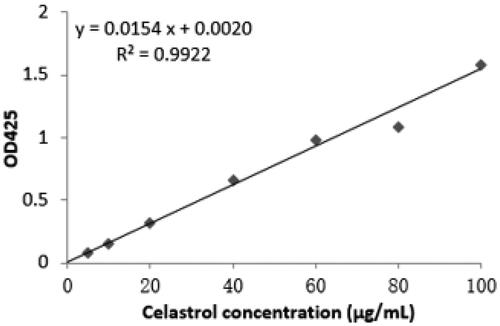
A standard curve () was established to set up a concentration range of celastrol (0, 5, 10, 20, 40, 60, 80, 100 μg/mL), then measured and calculated celastrol carrying capacity of FCA through loading content (LC) and encapsulation efficiency (EE). Results showed that the EE and LC of FCA were 93.690.41% and 49.97
0.22%, respectively. FCA had a high EE for celastrol attached on the AuNP surface as it provided a large surface to volume ratio for celastrol encapsulation. It was nearly 95% but the LC was only half of the EE, around ∼50%. This indicated that FCA was prepared using processes with high drug loading content and the space capacity of carrier material (PVP) was enough to get a high encapsulation efficiency. However, it may be the physical and electrostatic adsorption on AuNP surface were not tightly attached resulting lower loading content.
Figure 15. A standard curve for the absorbance values versus the corresponding celastrol concentrations.
In vitro drug release
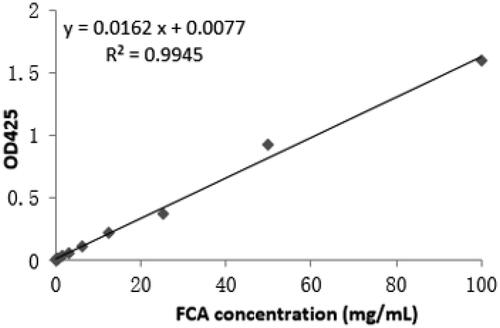
A standard curve () was established to set up a concentration range of FCA (0, 0.195, 0.391, 0.781, 1.563, 3.125, 6.25, 12.5, 25, 50, 100 mg/mL), pH 5.0, pH 6.8 and pH 7.4 were selected as a releasing medium in PBS. The absorbance of buffer was measured at 425 nm and calculated the cumulative release.
Figure 16. A standard curve for the absorbance values versus the corresponding folate receptor targeted celastrol AuNP (FCA) concentrations.
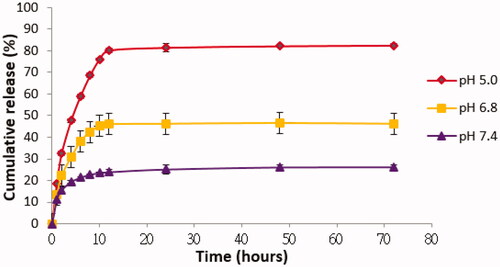
The total mass of FCA sample was 95 mg and rate of FCA cumulative release (%) was calculated based on the release of FCA in different buffer (pH 5.0, pH 6.8 and pH 7.4) from 0 to 72 h. pH 5.0 was the most suitable pH (releasing medium) compared with pH 6.8 and pH 7.4 for FCA cumulative release (%) (). This was a slightly acidic drug and soluble in acidic medium at pH 5.0 because of the conjugation with PVP-co-2-dimethylaminoethyl methacrylate. It was pH-sensitive and polycationic polymer. In neutral or alkaline pH, amine groups existed in a non-ionized form and kept the drug (celastrol) in the carrier structure (polymer); when the pH value decreased below pKa, amine groups become ionized and the carrier structure net swelled due to the electrostatic repulsion of neighbouring positively charged groups, thus releasing celastrol outside. FCA was rapidly released within the first 12 h then sustained up to 72 h. The initial burst effect could be attributed to the celastrol incorporated at the surface of gold nanoparticle. Further, sustained-release pattern might be the drugs encapsulated more deeply in the structure of AuNP. The accumulated drug release percentage at 12 h and 72 h were 80.18% and 82.46%. However, the cumulative release (%) of FCA was low at pH 6.8 and pH 7.4 within 12 h and 72 h. It was about 46.07% and 46.26% in pH 6.8, 23.91% and 26.19% in pH 7.4 which indicated the celastrol of FCA was still remained in the gold nanoparticle shell.
Figure 17. In vitro folate receptor targeted celastrol AuNP (FCA) release profiles.
Cellular uptake
Since nanoparticles were not fluorescent, FITC was as a marker which labelled with nanoparticles. In this study, breast cancer cells (Control), folic acid and celastrol were not labelled with FITC and just stained the cell nucleus with Hoechst 33258 dye. The nanoparticles were attached to the caveolae on the cell membrane and released into the cytosol undergo the endocytosis process [Citation15]. To examine cellular uptake of AuNP, CA and FCA in breast cancer cells, folate receptor-targeted celastrol AuNP-folic acid (FCA-FA) was added. Folic acid pre-treatment may bind to folate receptors on tumour cells or blocking the binding of FCA to folate receptors on tumour cells competitively. Nanoparticles including AuNP, FCA-FA, CA and FCA were labelled by FITC which exhibited higher cellular uptake with strong fluorescence in cell cytoplasm that confirmed their internalization and sustained retention in the breast cancer cells. The cellular uptake efficiency in FCA was higher than those in AuNP and CA. As the polymer linkages in FCA were cleaved resulting in the recovery of positively charged amine groups. This surface charge reversal enhanced the nanoparticles uptake of breast cancer cells.
from flow cytometric analysis shows that the cellular uptake efficiency in the FCA treatment group was higher than those in the AuNP treatment group and CA treatment group because FCA consisted of folic acid for targeting breast cancer cells.
Figure 18. Flow cytometry quantitative analysis for control group, folic acid treatment group, celastrol treatment group, gold nanoparticle (AuNP) treatment group, folate receptor targeted celastrol AuNP and folic acid (FCA-FA) treatment group, celastrol AuNP (CA) treatment group and folate receptor targeted celastrol AuNP (FCA) treatment group.
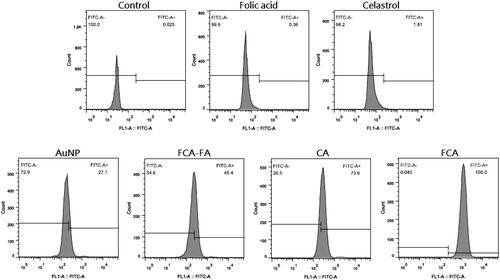
By summarizing the above flow cytometric analysis, two diagrams were plotted (Figures S6 and S7) to study the FCA-FA treatment group. As a result, folic acid blocked the binding of folic acid on FCA to tumour cell folate receptors simultaneously. The fluorescence intensity of FCA-FA treatment group was decreased in contrast to CA and FCA. Breast cancer cells alone (Control), folic acid, celastrol were not fluorescent and not labelled with FITC, the fluorescence intensities of the cells in the control, folic acid treatment group and celastrol treatment group were comparatively weak. The increasing order of fluorescence intensity was the Control group < Folic acid treatment group < Celastrol treatment group < AuNP treatment group < FCA-FA treatment group < CA treatment group < FCA treatment group.
The Relative FITC Green Fluorescence Intensity (Table S2 and Figure S8) for the control group, folic acid treatment group, celastrol treatment group, AuNP treatment group, FCA-FA treatment group, CA treatment group and FCA treatment group were 0.060.03%, 0.76
0.37%, 0.92
0.85%, 25.17
2.25%, 52.03
6.97%, 72.40
2.62% and 99.96
0.01%, respectively (P < 0.05). It indicated that the folic acid in FCA treatment group targeted breast cancer cells effectively.
Cytotoxicity in 2D breast cancer model
Cytotoxicity assays of folic acid, celastrol, AuNP, CA and FCA were investigated in 2D breast cancer model. There was a slightly cytotoxicity effect of folic acid (Figure S9) on the breast cancer cells when the concentration was increased from 0.078 to 20 μM. Cell viability was around 75% and 85% to 90% later on for 24 h. AuNP (Figure S10) was no effect on the breast cancer cells. Cell viability was maintained at 90% above at the concentration from 0.078 to 5 μM for 24 h. Celastrol was a high toxicity substance and the cell viability was declined sharply from 96% to 13% at the concentration from 0.078 to 20 μM in breast cancer cells. CA and FCA (Figure S11) show similar toxicity to the celastrol. The cell viability was proportionally decreased from 94% to 7% at the concentration from 0.078 to 20 μM in breast cancer cells. Cell viability of celastrol, CA and FCA in breast cancer cells were 13.742.23%, 11.13
1.56%, 7.76
1.56%, respectively at 20 μM under 24 h (Table S3). Those nanoparticles were inside the cells by endocytosis pathway. Celastrol was encapsulated in nanoparticles and increased its internalization by cells into lysosomes. The cytotoxicity effect of FCA on breast cancer cells were the greatest compared to celastrol and CA since it consisted of folic acid which owned the best selectivity in order to target breast cancer cells specificity and kept at a high toxicity. This was also expected that the aqueous solubility and polymer-mediated celastrol internalization or polymer degradation resulting enhanced the relative cytotoxicity. The results demonstrated that FCA acted as an anti-cancer drug suppressing the cell growth of the breast cancer cells.
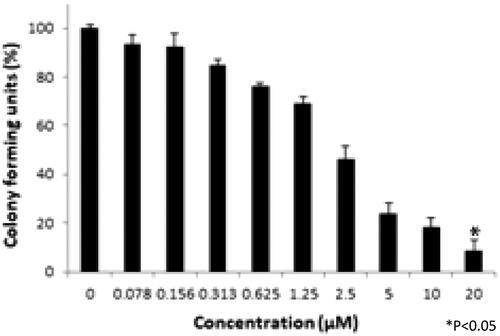
Colony-forming unit assay
Colony-forming units were shown in the following groups: Breast cancer cells alone (Control) (), folic acid (), celastrol (), AuNP (), CA () and FCA () were investigated against breast cancer cells through light microscope and calculating the colon forming units. Colony-forming units (%) of folic acid () and AuNP () were high at various concentrations which was nearly 90–100% (P < 0.05 versus control). Conversely, celastrol (), CA () and FCA () were lower which was proportionally decreased when the concentration increased. The colony-forming units of breast cancer cells treated by folic acid, gold nanoparticle, celastrol, CA, and FCA were 87.501.36%, 91.35
1.36%, 14.42
4.08%, 12.50
1.36% and 8.65
4.08% at 20 μM under 24 h (P < 0.05 versus control) which show that celastrol, CA and FCA inhibited the growth and weakened the colony-formation capacity of breast cancer cells in a dose-dependent manner compared with the celastrol and CA. It may be that nano-system improved the solubility of celastrol, polymer control the celastrol release within 48 h as well as the folic acid specifically target the breast cancer cells. The rapid internalization and sustained release of FCA from nanoparticles may substantially improve anticancer effects of CA and celastrol at the same dose.
Figure 19. Breast cancer MCF-7 cells alone (Control).
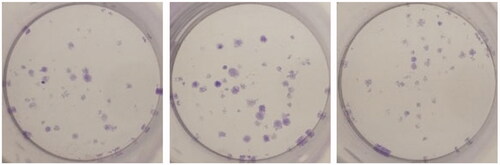
Figure 20. Folic acid treatment group.
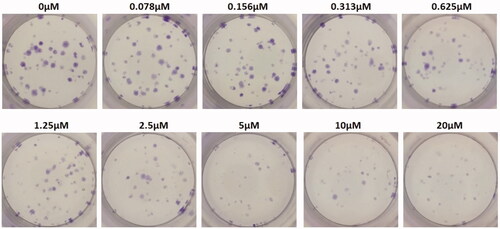
Figure 21. Celastrol treatment group.
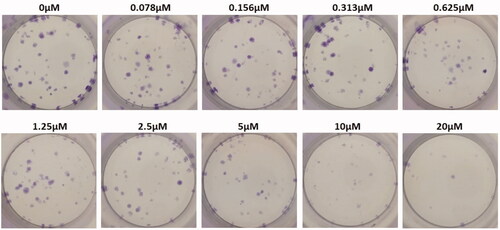
Figure 22. Gold nanoparticle (AuNP) treatment group.
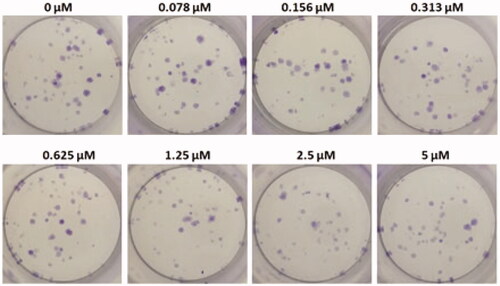
Figure 23. Celastrol AuNP (CA) treatment group.
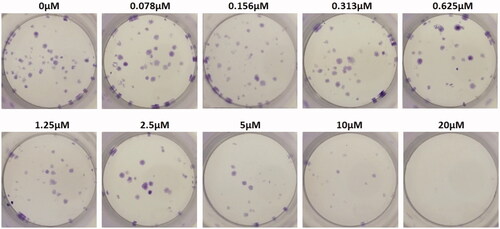
Figure 24. Folate receptor targeted celastrol AuNP (FCA) treatment group.
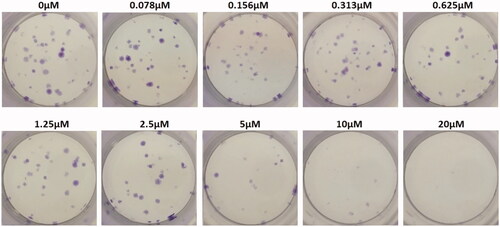
Figure 25. Colon forming efficiency of breast cancer MCF-7 cells in folic acid treatment group at the concentrations from 0 to 20 μM. Data were expressed as mean SD (n = 3), *P < 0.05 versus control, one-way ANOVA.
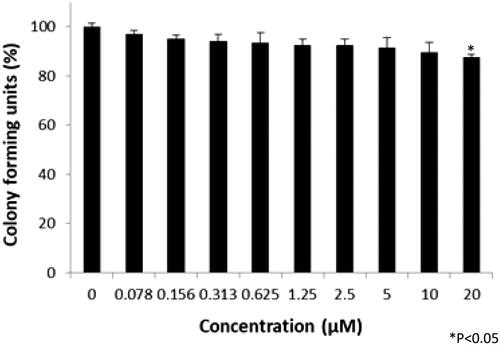
Figure 26. Colon forming efficiency of breast cancer MCF-7 cells in gold nanoparticle (AuNP) treatment group at the concentrations from 0 to 20 μM. Data were expressed as mean SD (n = 3), *P < 0.05 versus control, one-way ANOVA.
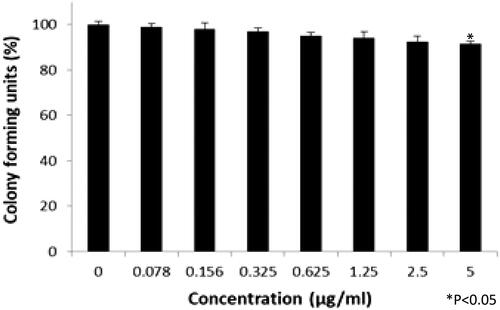
Figure 27. Colon forming efficiency of breast cancer MCF-7 cells in celastrol treatment group at the concentrations from 0 to 20 μM. Data were expressed as mean SD (n = 3), *P < 0.05 versus control, one-way ANOVA.
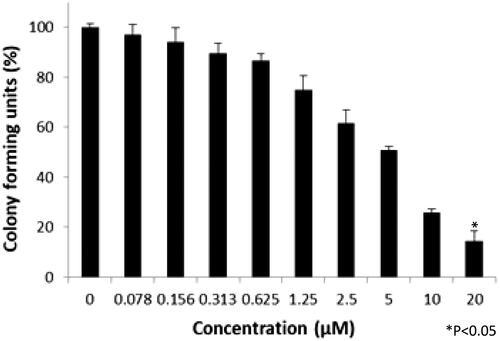
Figure 28. Colon forming efficiency of breast cancer MCF-7 cells in celastrol AuNP (CA) treatment group at the concentrations from 0 to 20 μM. Data were expressed as mean SD (n = 3), *P < 0.05 versus control, one-way ANOVA.
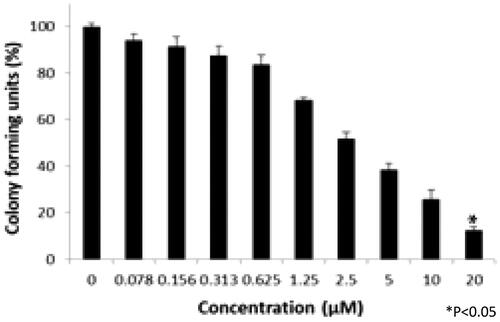
Figure 29. Colon forming efficiency of breast cancer MCF-7 cells in folate receptor targeted celastrol AuNP (FCA) treatment group at the concentrations from 0 to 20 μM. Data were expressed as mean SD (n = 3), *P < 0.05 versus control, one-way ANOVA.
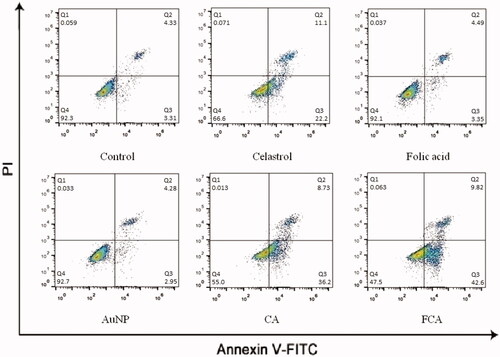
Cell apoptosis in 2D breast cancer model
Cell apoptosis in the control treatment group, celastrol treatment group, folic acid treatment group, AuNP treatment group, CA treatment group and FCA) treatment group were investigated using flow cytometry with Annexin V and PI staining (). Folic acid treatment group and AuNP treatment group had no obvious effect in cellular apoptosis and necrosis. The apoptotic activity of FCA treatment was better than celastrol treatment alone and CA treatment. The cells treated by FCA greatly enhanced in the early apoptotic cells, 42.60.55% (P < 0.05 versus CA), 35.7
0.50% of CA treatment group (P < 0.05 versus Celastrol) and 23.1
1.25% of celastrol treatment group. It was increased two times. These demonstrated that FCA treatment could significantly enhance apoptosis of breast cancer cells.
Figure 30. Cell apoptosis of MCF-7 breast cancer cells in the control treatment group, celastrol treatment group, folic acid treatment group, AuNP treatment group, CA treatment group and FCA treatment group.
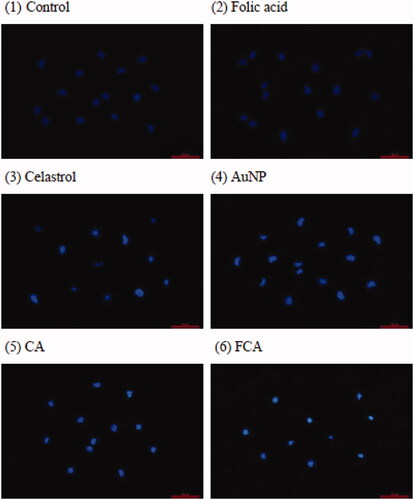
Nuclear staining
The nuclear staining with Hoechst 33342 of breast cancer cells in the control, folic acid treatment group, celastrol treatment group, AuNP treatment group, CA treatment group and FCA treatment group, respectively were investigated (). Breast cancer cells in the control treatment group, folic acid treatment group and AuNP treatment group stained the nucleus in blue colour uniformly. When treatments with celastrol, CA and FCA for 24 h, breast cancer cells were pyknotic, the cells sizes become smaller. It also appeared typical features of apoptosis such as nuclear shrinkage, fragmentation and brightly stained. These morphological change further support the hypothesis that FCA induced apoptosis of breast cancer cells.
Figure 31. Nuclear staining with Hoechst 33342 staining in the breast cancer MCF-7 cells. (1) Control treatment group, (2) folic acid treatment group, (3) celastrol treatment group, (4) AuNP treatment group, (5) CA treatment group, and (6) FCA treatment group. Scale bars = 50 μm.
Assessment of MMP
Mitochondrial permeability lipophilic JC-1 fluorescence dye was a water-soluble indicator to assess the changes of MMP after the treatment of celastrol, folic acid, AuNP, CA and FCA in breast cancer MCF-7 cells, respectively. shows that celastrol, folic acid, AuNP, CA and FCA caused the loss of MMP in breast cancer cells. Flow cytometric analysis showed the decrease from red to green fluorescence ratio. The greatest loss of MMP was found in the FCA treated breast cancer MCF-7 cells compared to celastrol treatment alone. It was around 9.570.38%, three times more than the celastrol treatment alone (3.58
0.08%) (P < 0.05 versus celastrol). These demonstrated that FCA significantly cause damage to mitochondria in breast cancer cells.
Figure 32. Flow cytometry analysis of MMP in breast cancer MCF-7 cells for the control treatment group, celastrol treatment group, folic acid treatment group, AuNP treatment group, CA treatment group and FCA treatment group.
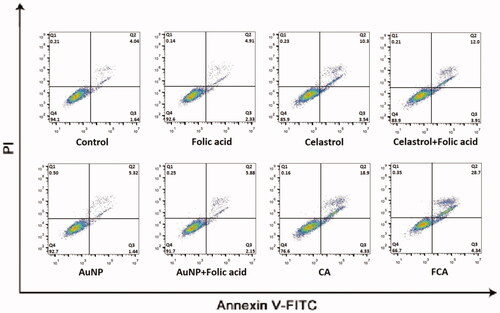
Tumour growth and apoptosis in 3D breast cancer model
A 3D tumour spheroid was used as a model to further investigate the killing efficacy of FCA on breast cancer cells. In the experiments, there were eight groups including the control treatment group, folic acid treatment group, celastrol treatment group, celastrol and folic acid treatment group, AuNP treatment, AuNP and folic acid treatment, CA treatment group and FCA treatment group. Images of 3D tumour spheroid were captured using normal light microscope for 0 day, 3 day and 7 days, respectively: The images of 3D tumour spheroid indicated that breast cancer cells in the control proportionally increased from 3 to 7 days (). The spheroid treated by folic acid (), AuNP (), the combination of AuNP and folic acid () grew in the 3D tumour spheroid like those in the control during this period. However, the size of 3D tumour spheroid after celastrol treatment (), the combined treatment of celastrol and folic acid () decreased gradually within these 7 days, showing that celastrol inhibited the cell growth of 3D tumour spheroid. Compared to the above experimental groups, the sizes of 3D tumour spheroid in the CA treatment group () and FCA treatment group () were obviously smaller from 3 to 7 days. FCA treatment group was the best since celastrol suppressed the cell growth and folic acid for targeting the 3D tumour spheroid specifically. Similarly, flow cytometry analysis was used to measure cell apoptosis of 3D tumour spheroid after 7 days for each experimental groups. Cell apoptosis of 3D tumour spheroid in each group were investigated ().
Figure 33. Control treatment group for 3D tumour spheroid. Scale bar = 100 μm.
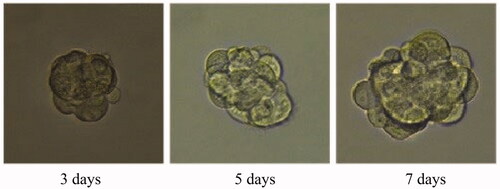
Figure 34. Folic acid treatment group for 3D tumour spheroid. Scale bar = 100 μm.
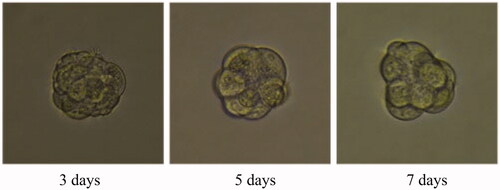
Figure 35. Gold nanoparticle (AuNP) treatment group for 3D tumour spheroid. Scale bar = 100 μm.
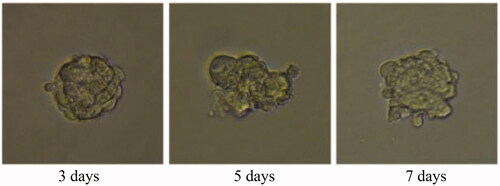
Figure 36. Gold nanoparticle (AuNP) and folic acid treatment group for 3D tumour spheroid. Scale bar = 100 μm.
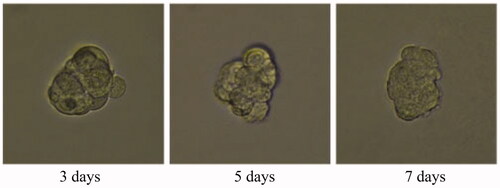
Figure 37. Celastrol treatment group for 3D tumour spheroid. Scale bar = 100 μm.
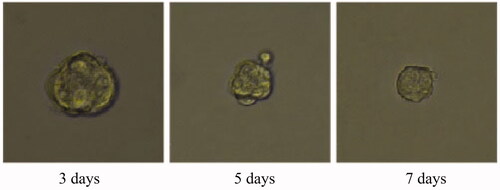
Figure 38. Celastrol and folic acid treatment group for 3D tumour spheroid. Scale bar = 100 μm.
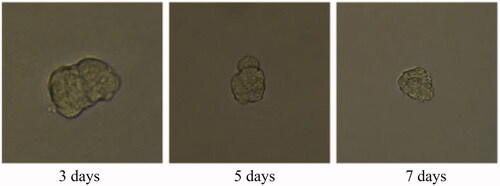
Figure 39. Celastrol AuNP (CA) treatment group for 3D tumour spheroid. Scale bar = 100 μm.
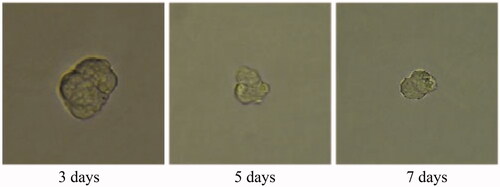
Figure 40. Folate receptor targeted celastrol AuNP (FCA) treatment group for 3D tumour spheroid. Scale bar = 100 μm.
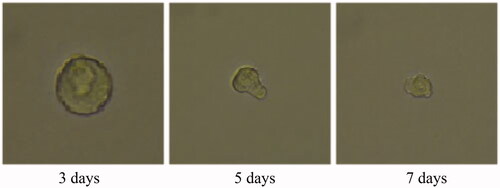
Figure 41. Cell apoptosis of 3D tumour spheroid in the control treatment group, folic acid treatment group, celastrol treatment group, celastrol and folic acid treatment group, AuNP treatment, AuNP and folic acid treatment, CA treatment treatment group and FCA treatment group.
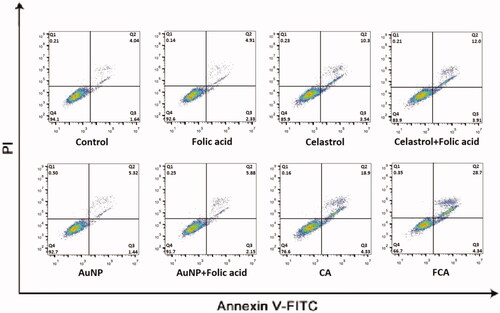
The results showed that folic acid treatment and AuNP treatment had no significant effect on cellular apoptosis and necrosis. FCA-induced apoptosis was greatly enhanced in the late apoptotic cells, 31.091.75% (P < 0.05 versus CA), 20.22
0.96% of celastrol AuNP (CA) (P < 0.05 versus Celastrol) and 10.75
0.43% of celastrol treatment group. It was increased three times. These findings from the 3D spheroid model further demonstrated that FCA had significant killing effect and apoptosis-inducing activity on breast cancer.
Conclusion
In summary, this research proposed a simple route for linking the folic acid to celastrol and conjugate with PVP-co-2-dimethylaminoethyl methacrylate functionalized gold nanoparticle. FCA was prepared and characterized using ATR-FTIR, UV-Vis spectroscopy, TEM and ICP-MS. It was highly soluble in aqueous mediums including DDW, PBS and DMEM at RT. Quinone methide chromophore group of celastrol and surface plasmon resonance of gold nanoparticle interacted after conjugation. The encapsulation efficiency and loading content of FCA were around 90% and 50%, respectively. It was rapidly released within the first 12 h, then sustained up to 72 h at pH 5.0. Besides, FCA possessed the highly cellular uptake efficiency, low colony-forming assay unit, exhibited killing activity and apoptosis-inducing ability in the 2D and 3D breast cancer models. It may be a potential candidate of anti-cancer drug for breast cancers in the future if there is further development.
Folic_Acid_Modified_Celastrol_Nanoparticles__Supporting_information__for_checking_.docx
Download MS Word (1.3 MB)Disclosure statement
No potential conflict of interest was reported by the author(s).
Additional information
Funding
Related Research Data
References
- Venkatesha SH, Moudgil KD. Celastrol and its role in controlling chronic diseases. Anti-inflammatory nutraceuticals and chronic diseases. USA: Springer; 2016. p. 267–289.
- Qi X, Qin J, Ma N, et al. Solid self-microemulsifying dispersible tablets of celastrol: formulation development, charaterization and bioavailability evaluation. Int J Pharma. 2014;472(1-2):40–47.
- Xu W, Xing FJ, Dong K, et al. Application of traditional Chinese medicine preparation in targeting drug delivery system. Drug Delivery. 2015;22(3):258–265.
- Peng Q, Chen R. Biosynthesis of gold nanoparticles using Caffeoylxanthiazonoside, chemical isolated from Xanthium strumarium L. fruit and their anti-allergic rhinitis effect – a traditional Chinese medicine. J Photochem Photobiol. 2019;192:13–18.
- Nagase M, Oto J, Sugiyama S, et al. Apoptosis induction in HL-60 cells and inhibition of topoisomerase II by triterpene celastrol. Biosci Biotechnol Biochem. 2003;67(9):1883–1887.
- Bareiss B, Ghorbani M, Li F, et al. Controlled release of acyclovir through bioengineered corneal implants with silica nanoparticle carriers. TOTERMJ. 2010;3(1):10–17.
- Choi JY, Gupta B, Ramasamy T, et al. PEGylated polyaminoacid-capped mesoporous silica nanoparticles for mitochondria-targeted delivery of celastrol in solid tumors. Colloids and Surfaces B. 2018;165:56–66.
- Scomparin A, Salmaso S, Eldar-Boock A, et al. A comparative study of folate receptor-targeted doxorubicin delivery systems: dosing regimens and therapeutic index. J. Control Release. 2015;208:106–120.
- Lu G, Li S, Guo Z, et al. Imparting functionality to a metal-organic framework material by controlled nanoparticle encapsulation. Nature Chem. 2012;4(4):310–316.
- Rahmani S, Budimir J, Sejalon M, et al. Large pore mesoporous silica and organosilica nanoparticles for pepstatin A delivery in breast cancer cells. Molecules. 2019;24(2):332.
- Lv D, Hu Z, Lu L, et al. Three-dimensional cell culture: a powerful tool in tumor research and drug discovery. Oncol Lett. 2017; 14(6):6999–7010.
- Campisi S, Schiavoni M, Chan-Thaw CE, et al. Untangling the role of the capping agent in nanocatalysis: recent advances and perspectives. Catalysts. 2016;6(12):185.
- Gangwar RK, Dhumale VA, Kumari D, et al. Conjugation of curcumin with PVP capped gold nanoparticles for improving bioavailability. Mater Sci Eng C. 2012;32(8):2659–2663.
- Thanighairassu RR, Sivamai P, Devika R, et al. Green synthesis of gold nanoparticles characterization by using plant essential oil Menthapiperita and their antifungal activity against human pathogenic fungi. J Nanomed Nanotechnol. 2014;5:229.
- Kam NWS, Liu ZA, Dai HJ. Carbon nanotubes as intracellular transporters for protein and DNA: an investigation of the uptake mechanism and pathway. Angew Chem Int Ed. 2006;45(4):577–581.