
Abstract
Non-invasive tracking of stem cells after transplant is necessary for cell therapy and tissue engineering field. Herein, we introduce natural and biodegradable nanoparticle to develop a highly efficient nanoprobe with the ability to penetrate the stem cell for tracking. Based on the use of (Gd3+) to label stem cells for magnetic resonance imaging (MRI) we synthesized nanoparticle-containing Gd3+. Gd3+ could be used as t1-weighted MRI contrast agents. In this study, chitosan-alginate nanoparticles were synthesized as a clinical Dotarem® carrier for decreased t1-weighted. Scanning electron microscopy (SEM), transmission electron microscopy (TEM), dynamic light scattering (DLS), and Fourier-transform infrared spectroscopy (FTIR) were utilized for nanoprobe characterization and ICP analysis was performed for Gd3+ concentration measurement. The results illustrate that nanoprobes with spherical shape and with a size of 80 nm without any aggregation were obtained. Relaxivity results suggest that r1 in the phantom was 12.8 mM−1s−1 per Gd3+ ion, which is 3.5 times larger than that for Dotarem® (r1 ∼3.6 mM−1s−1 per Gd3+ ion) and this result for synthesized nanoprobe in stem cells 3.56 mM−1s−1 per Gd3+ ion with 2.16 times larger than that for Dotarem® was reported and also enhanced signal in in-vivo imaging was observed. Chitosan-alginate nanoparticles as a novel biocompatible probe for stem cell tracking can be utilized in tissue engineering approach.
Introduction
Stem cells (SCs) can be recognized with specific features such as self-renewal, and differentiation [Citation1]. Nowadays, these unspecialized cells not only are applied in cell-based therapies like degenerative [Citation2], immune [Citation3] and genetic diseases [Citation4] but also, that is widely used in regenerative medicine [Citation1,Citation5].
In spite of some benefits of SCs, the inability to study cellular fate during the regeneration process is one of the main restrictions [Citation3,Citation5]. Therefore, imaging techniques are useful means to monitor SCs behaviour. Accordingly, the tracking and monitoring of the functional process of SCs, such as their proliferation dynamics, differentiation process, and in-vivo migration dynamics, after delivery and harvest them in the body is very important [Citation6].
Over the last decade, molecular imaging techniques received more attention as tools for monitoring the in-vivo behaviour of stem cells, and they have shown great potential in preclinical and clinical trials [Citation6].
Different imaging methods are used to tracking of stem cells, every method has some advantages and disadvantages. Fluorescence imaging requires tissue samples for detection and also has the limitation of depth for the organs which have been located in the inside of the body [Citation7], echocardiography such restriction as spatial resolution and accurate cell quantification [Citation8,Citation9]. The techniques which are used in nuclear medicine such as signal-photon emission computed tomography (SPECT) and positron emission tomography (PET) and other techniques like them could cause radiation injury and both mentioned methods have some limitations including weakness of anatomy definition and spatial resolution [Citation10].
Magnetic resonance imaging (MRI) has been widely studied for cell tracking route in recent years [Citation11–13], this method has excellent spatial resolution and rapid in-vivo acquisition of images and no use the ionizing radiation. It obtains real-time images of the cells in internal organs and it is a non-invasive technique for in-vivo cell tracking. However, MRI requires a contrast agent to obtain successful bio-imaging at the cellular and molecular level. Gadolinium (Gd3+) is currently the most common MRI contrast agent so it can enhance the signal by decreasing t1. t1-Weighted enhancing ability produces bright positive signal intensity in images facilitating easy tracking of cells in low-signal tissues [Citation14].
Imaginable nanoparticles (NPs) probe are developing as a kind of novel contrast and tracking factor for medical imaging. Among different nanoprobes used as a contrast agent, natural polymers are the best candidate due to their biocompatibility and biodegradability. Chitosan (CH), derived from chitin, with cationic nature and sodium alginate (SA) with the source of seaweed and anionic character has gained more attention in different biological approaches [Citation15].
Biodegradability of mentioned polymers and cell compatibility of them made these structures as an appropriate choice in bioimaging [Citation15–18]. Hence, in the present study chitosan-alginate nanoprobe as an MRI contrast agent for Wharton,s jelly mesenchymal stem cell tracking was used. Our results demonstrate that natural nanoprobe is synthesized successfully without any cell toxicity. Acceptable cellular uptake and image signal in MRI was achieved by this nanoprobe.
Materials and methods
Materials
SA with number-average molecular weight of 80,000–120,000 Da, medium viscosity: 2808 ± 43 cP at 2% w/v, 25 °C and Low-molecular-weight and low-viscosity (2% w/v) chitosan (CH) (poly [D-glucosamine] deacetylated chitin) were supplied from Sigma Aldrich. Calcium chloride (CaCl2) and acetic acid (Glacial), 100% appropriate for use as an add-on (additive), were purchased from Merck Chemicals Co and Sigma-Aldrich respectively. Dulbecco’s modified Eagle’s (DMEM) medium, foetal bovine serum (FBS), penicillin-streptomycin (10,000 U/mL) and trypsin (%0.25) were supplied from GIBCO (Fortworth, TX). 3-(4,5-Dimethylthiazol-2-yl)-2,5-diphenyltetrazolium bromide (MTT) and dimethyl sulfoxide (DMSO) were purchased from Merck (Darmstadt, Germany). All the reagents used in this research were obtained as the analytical grade.
Preparation of blank CH-SA nanoparticles
Nanoparticle synthesis was performed according to our previous works [Citation19,Citation20]. Briefly, 0.1 g of calcium chloride (CaCl2) and 0.1 g of SA was dissolved in 10 mL distilled water separately. To have a gel structure, CaCl2 solution was added to the alginate solution and it was stirred for 30 min to complete the gelation process. Next, 0.01 g of CH was dissolved in 10 mL of acetic acid (1% V/V) and added drop-wise to the Ca–SA pre-gel. The obtained complex was sonicated for 20 min to prohibit of aggregated nanoparticles. Finally, the sample was centrifuged at 11,000 rpm for 40 min then the pellet formed in the centrifuge was transferred to micro vials and the freeze-drying method was chosen as a final step to obtaining CH-SA NPs.
Preparation of Dotarem® loaded CH-SA nanoparticles
1 mL of Dotarem® solution (0.001 M) was added to the SA solution under continuous magnetic stirring and allowed to gain homogeneity over one hour. Other steps of Dotarem® loaded CH-SA nanoparticles were performed similarly to the blank CH-SA nanoparticles synthesis.
Cell culture
Wharton,s jelly mesenchymal stem cells (WJ-MSCs) were selected for stem cell tracking using natural polymeric nanoprobe. For cell culture practice, cells were retained in Dulbecco’s modified Eagle’s medium (DMEM) with 10% (FBS) and 1% of antibiotics (penicillin/streptomycin). The cell line was kept under physiological conditions in an incubator (37 °C, 5% CO2, and 95% humidity).
Characterization of nanoparticles
Morphology and structure behaviour
Scanning electron microscopy (SEM) (KYKY EM-3200) was used for assessment morphological characterization of nanoparticles after gold coating at an accelerating voltage of 25 Kv.
The size of synthesized nanoparticles was determined by dynamic light scattering (DLS) (ZETA SIZER NANO zps, Malvern Instruments, UK).
The particle size measurement and morphological observation were evaluated by Transmission electron microscopy (TEM) (Philips CM30-type: PW 6041/50, Holland).
FTIR spectroscopy (Bruker, Ettlingen, Germany) technique was used to chemical interaction study between components of nanoparticles and the concentration rate of Gd3+ inside of synthesized nanoparticles was measured by ICP-AES (Optima 3100XL; PerkinElmer, Waltham, MA).
Stability study
In order to have suitable nanoprobes to study long-term cellular behaviour, these nanoparticles should be stable in a biological environment. Therefore, synthesized nanoparticles were kept in PBS at 37 °C for 6 months and morphological features of them were studied using SEM.
MTT assay
The cytotoxicity of CH-SA nanoparticles was analyzed by MTT assay at different concentrations. 1 × 10⁵ WJ-MSCs in their exponential growth phase were seeded in a 96-well polystyrene coated plate and were incubated at 37 °C in a 5% CO2 incubator for 24 h. Subsequently, a series of dilution (5, 10, 15 and 20 μg/mL) of Dotarem® loaded CH-SA nanoparticles in the medium was added. Then, after preparation of a 10 mL MTT solution (5 mg/mL), 100 μL (0.5 mg/mL in PBS) was added into each well, and the cells were incubated at 37 °C for 4 h. The medium was then removed carefully and 150 µL dimethyl sulfoxide (DMSO) was added and mixed with the cells thoroughly until formazan crystals were completely dissolved. The optical density (OD) values were read on a spectrophotometer at 570 nm wavelength. Cell viability was expressed as a percentage of the viable cell to control the sample.
MR measurement
The relaxation time of nanoprobe was measured according to Mehravi et al., previous protocol [Citation21]. Briefly, nanoprobe relaxation times were calculated at different concentrations by using various spin-echo and gradient-echo protocols in 1.5 T MRI with a head coil. For t2 measurement, multiple spin-echo protocols were used. In total, 26.4 echoes with an echo spacing of 2 ms were obtained. The first echo time (TE) was 13.2, TR was 3000 ms, matrix = 256 × 256; slice thickness = 1.5 mm, and non-averaged. A FLASH protocol was used to analyze t1 maps and repetition times of TR = 50, 100, 200, 400, 1000, 2000 and 3000 ms; TE was 12 ms; matrix = 256 × 256; slice thickness = 1.5 mm, and non-averaged.
In-vitro MRI preparation
WJ-MSCs (1 × 10⁷) were incubated with different doses of nanoprobe (5, 10, 15 and 20 µg/mL) for 2 h. The labelled cells were washed with PBS, trypsinized, and centrifuged at 1000 rpm at 37 °C for 5 min. Subsequently, cells were re-suspended in an equal volume of DMEM medium and 2% agarose gel at 37 °C, and were immediately transferred into the phantom tubes for MR procedure. The relaxation rates were reported using 1.5 T MRI scanners and the untreated cells were selected as the control group. For quantitative analysis, the MRI images were analyzed by DICOM software version 1.3.0.5. (MEDAV GmbH Company).
In-vitro MRI imaging
For relaxation times evaluation, different spin-echo and gradient-echo protocols in 1.5 T MRI (Siemens AG, Munich, Germany) with a head coil were used. Overall for t1 assessment, a FLASH protocol with repetition times of 50 ms, 100 ms, 400 ms, 600 ms, and 1000 ms was set up. The first echo time was 12 ms (matrix = 256 × 256), and the slice thickness on average was 2.5 mm. t2 measurements were done by multiple spin-echo protocols. The repetition time, the first echo time, and the slice thickness was respectively 3000 ms, 13.2, and 1.5 mm (matrix = 256 × 256).
In-vivo stem cells imaging
For stem cell imaging, 5 × 10⁷ labelled cells per pellet with a volume of 0.1 mL (subcutaneous) were injected into the dorsal flank of a male BALB/c mouse. Another equivalent amount of unlabelled cell pellets was also injected into the right side as the control. The animal was then immediately transferred to MRI for imaging.
Data analysis
To compare the results, one-way ANOVA by Graph Pad software, USA was utilized and if the data were significantly different, p-value <.05 was reported.
Results
Morphology and particle size
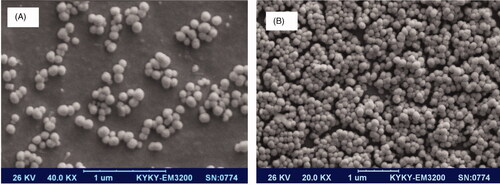
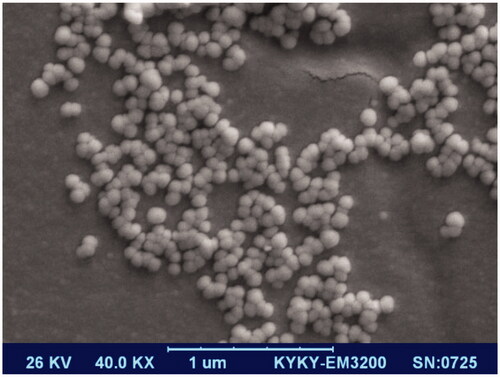
Morphological information of synthesized natural nanoprobe was achieved by SEM. According to this image, spherical shape with minimum aggregation was observed ().
Figure 1. SEM image of synthesized (A) CH-SA nanoparticles, (B) CH-SA–Dotarem® nanoparticles. Spherical shape of nanoparticle and nanoprobe is observed. Dotarem® loading did not have an influence on nanoparticle morphology.
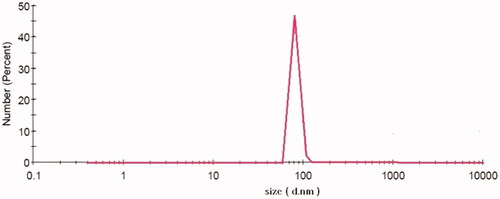
To evaluate the size and distribution of nanoparticles DLS was performed. The nanoparticles had the diameter in the range of 80–10 nm and the polydispersity index was reported 0.020 ± 0.008 ().
Figure 2. DLS diagram of CH-SA nanoparticles; particle size in the range of 80–100 nm.
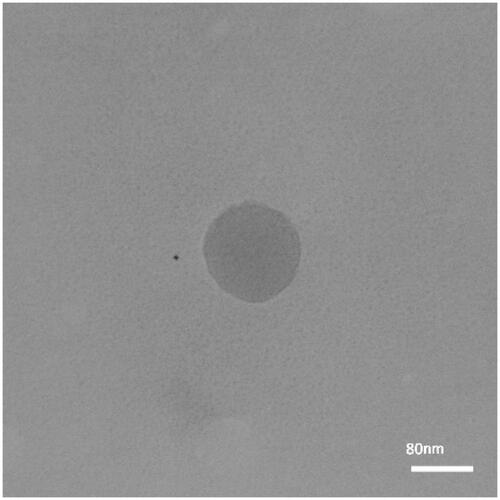
TEM analysis confirmed the spherical morphology and the least amount of aggregation. The size of CH-SA nanoparticles was in the range of 80 nm with relatively uniform distribution in TEM assessment ().
Figure 3. TEM image of CH-SA nanoparticles. This image confirms the spherical shape of the nanoparticle.
Structural characterization
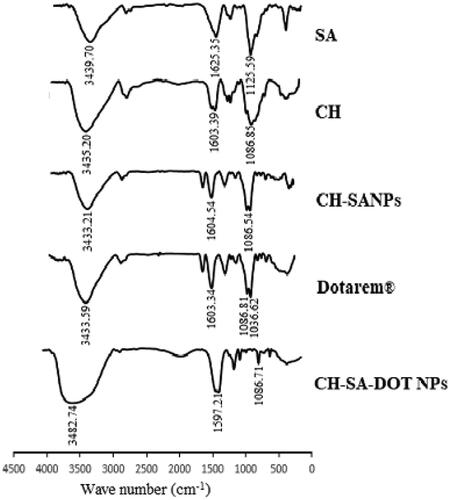
In chemical structures of nanoprobe components using FTIR spectroscopy are shown. The FTIR spectrum of SA showed two peaks around 3439 cm−1 and 1625 cm−1 that related to OH and C=C, respectively, and the peak of 1125 cm−1 in SA spectrum appears due to C–O group. The absorption bound at 1603 cm−1 was attributed to NH amid bound of the groups of CH and had one peak at 1086 cm−1 that is attributed to the presence of C–O–C. According to the spectrum of Dotarem®, it had two peaks at 3433 cm−1 and 1603 cm−1 illustrate the presence of OH and N–H, respectively, and had two sharp peaks at 1036 cm−1 for C–N and 1086 cm−1 for C–O. In Dotarem® loaded CH-SA NP, the peak of 1603 cm−1 was shifted to 1597 cm−1 and the specific peak of 1086 cm−1 relevant to Dotarem® has revealed in this sample. This analysis states that Dotarem® was loaded in CH-SA NP successfully.
Figure 4. FTIR spectra of sodium alginate, chitosan, Dotarem® and Dotarem® loaded nanoparticles.
Stability of nanoparticles
According to natural nanoprobes still have retained their spherical structure and morphology and they could maintain their stability over six months. The reason for the probable change in the particle size is the water absorbance of these nanoprobes due to their hydrogel nature.
Figure 5. SEM image of CH-SA NP after six months immersion in PBS. Nanoparticles retained their spherical shape in this period.
MTT assay
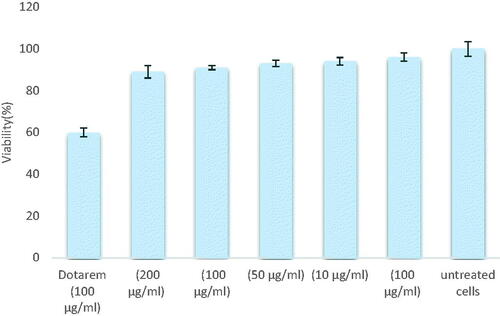
Cytotoxicity of Dotarem® loaded CH-SA NP was examined by MTT assay with different concentrations of nanoprobes. In this work, we used clinical Dotarem® that is non-toxic for cells and depicts these results. Cell viability of synthesized nanoprobe was not changed significantly in diverse concentrations for 5 days. Comparison to Dotarem® cells in contact with nanoparticles and synthesized nanoprobes have shown more survival (p-value <.05). It seems that natural polymeric nanoprobes are compatible with WJ-MSCs.
Figure 6. MTT assay of different concentrations of nanoprobe in contact with WJ-MSCs for 5 days (p-value <.05). Each specimen was examined in triplicate no significant toxicity was observed.
Relaxivity measurement of the nanoprobe
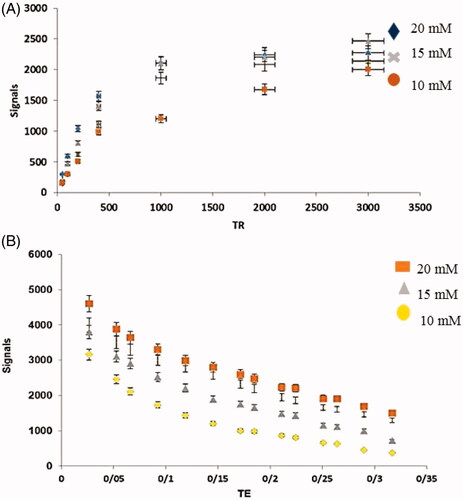
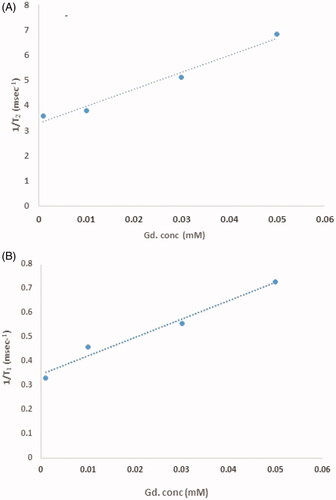
1.5 T MRI scanner was applied for MRI relaxation times evaluation in phantom () and labelled cells (). Observed results display despite the contrast agent was located inside the cavities, the cavities were not blocked and there was the possibility of water passing through these cavities and access to Gd3+, thus allowing imaging with MRI.
Figure 7. Signal diagram in terms of (A) t1, (B) t2 in the phantom based on spin-eco and gradient protocol.
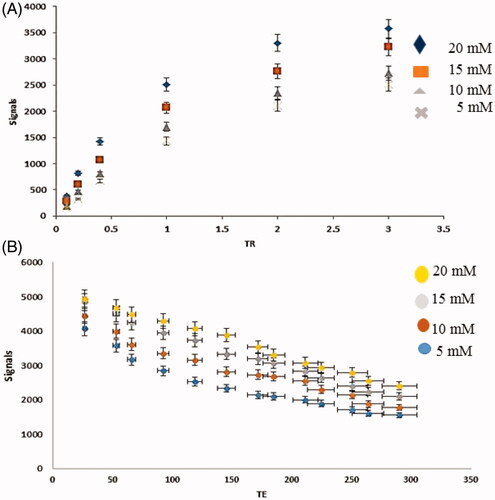
Figure 8. Signal diagram in terms of (A) t1, (B) t2 in stem cell.
Relaxivity
Relaxivity parameters are displayed in and . The nanoprobes have large longitudinal (r1) and transverse (r2) relativities. The values of r1 and r2 in the phantom were 12.8 mM−1s−1 and 18.754 mM−1s−1, respectively, and the ratio of r2:r1 was 1.45. Similar parameters in cells were quantified and 7.56 mM−1s−1 and 22.162 mM−1s−1 were the values of r2 and r1 with a ratio of 2.9.
Figure 9. The relaxivity measurement in phantom; (A) r2, (B) r1.
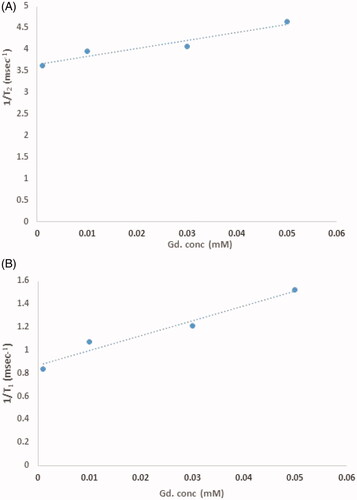
Figure 10. Digrams of relaxivity values in stem cells based on spin-echo and gradient echo protocol; (A) r2, (B) r1. Better relaxivity results shows nanoprobes are proper contrast agent for stem cell labelling compared to phantom.
Stem cell imaging
In order to evaluate the efficiency of synthesized nanoprobes, in-vivo imaging was also used.
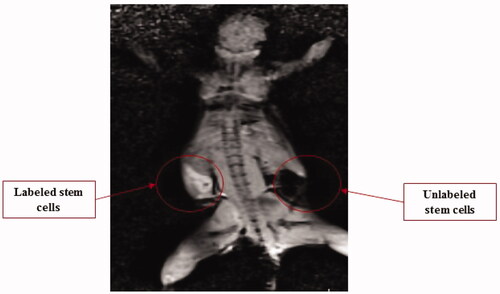
5 × 10⁷ labelled cells and 5 × 10⁷ unlabelled cells were injected in the right and left dorsal flank of mice, respectively and obtained an image is shown in . This image confirms MRI values results and compared to the control cells; labelled one had a proper signal after 15 min.
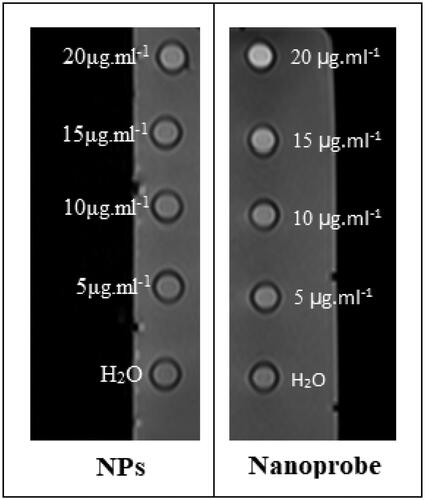
Figure 11. Obtained MRI image phantom of nanoparticles and nanoprobes.
Discussion
Stem cell fate and control of its behaviour are the main challenges in different approaches of regenerative medicine particularly, tissue engineering. In this regard, tracking stem cells to prove their functions is a key means to achieve an effective route to having functional stem cells in the desired manner [Citation13]. Among a wide range of imaging techniques, MRI is preferred, and also various research topics belong to this issue which they used an organic and inorganic contrast agent [Citation21]. Natural polymeric nanoprobe with biodegradability behaviour is a new generation of contrast agent for stem cell tracking that is studied in this paper.
Hence, natural polymeric nanoparticles were synthesized based on the pre-gel method. Our obtained results demonstrate that these nanoparticles have a spherical shape with a size of 80 nm (in the range of 80–100 nm) ( and ). And TEM analysis approved SEM and DLS results of nanoparticles with spherical morphology and at least of aggregation (). FTIR spectra of the nanoprobe component are shown in . In this analysis successful complex of chitosan-alginate and the incorporation of Dotarem® in nanoparticles is clear. ICP result depicts that the concentration of Gd3+ was1958.33 ppm. The stability of nanoprobes in six months demonstrates that these nanostructures didn’t show any change in their morphology in this period and were stable in PBS and the slight increase in size may be seen in the image, which may be due to the absorption of fluids by these nanoparticles. This is because of the polysaccharide nature of the nanoparticles ().
Biocompatibility characteristics of nanoprobes are the main challenges for researchers in biological aspects. Toxicity of natural nanoprobe was evaluated by MTT () according to these results, nanoparticles didn’t show any specific toxicity and this matter is related to their natural nature.
It can be said that there is no relative change in the survival of the cells and we can consider nanoprobes as biocompatible structures.
Stem cell tracking was analyzed by synthesized natural nanoprobe. Relaxivities parameters were measured in phantom and stem cells. Based on these results the r2:r1 ratio in the phantom was 1.45 and the r2:r1 ratio in stem cells was 0.8 indicating that nanoprobe was a suitable t1-weighted contrast agent in phantom as well as stem cells. The enhanced MR relaxivity is attributed to the easy access of cell’s water molecules to Gd3+ which have been loaded in nanoprobe.
The values of r1 and r2 in the phantom were 12.8 and 18.754 mM−1s−1and the r1 and r2 values in cell 7.56 and 22.162 mM−1s−1 were reported. The r1 relaxivity for the nanoparticles in the phantom was 12.8 mM−1s−1 per Gd3+ ion, which is 3.5 times larger than that for Dotarem® (r1 ∼3.6 mM−1s−1 per Gd3+ ion) and the r1 relaxivity for the nanoparticles in stem cells was 7.56 mM−1s−1 per Gd3+ ion, which is 2.16 times larger than that for Doratem®. All diagrams of relativity measurements are shown in . Relaxivity results in cell and phantom comparing well indicate that there is a contrast in the cell and that it is better than the phantom. And also based on these data nanoparticles have entered stem cells successfully.
Significant positive signal enhancement in the t1-weighted in the in-vivo image was observed for the labelled cells when compared to the unlabelled cells (). The t1-weighted image enhancements were related to the reduction of t1 relaxation times. The in-vivo image demonstrates that synthesized nanoprobes with specific properties with enhanced MRI parameters have made a possible route for stem cell tracking.
Figure 12. Injection of ∼5 × 10⁷ labelled stem cells and ∼5 × 10⁷ unlabelled cells in the left and right dorsal flank of mouse, respectively. Note: The labelled cells had great signals after 15 min compared to the unlabelled cells.
In summary, results indicate that synthesized nanoprobes as the non-invasive probe can be applied but tracking of cells with this nanoprobe in tissue engineering application is a future insight of this field.
Conclusion
In this study, CH-SA NP was synthesized as a biodegradable nanoprobe for stem cell tracking. Our in-vitro and in-vivo results show that nanoprobes are compatible with stem cells and with reduction of t1 relaxation times can be introduced as a novel natural nanoprobe for stem cell tracking.
Acknowledgements
The authors thank Moein Amoupour at the Iran University of Medical Science for his wonderful collaboration.
Disclosure statement
No potential conflict of interest was reported by the author(s).
Correction Statement
This article was originally published with errors, which have now been corrected in the online version. Please see Correction (http://dx.doi.org/10.1080/21691401.2020.1843779)
Additional information
Funding
References
- Li L, Jiang W, Luo K, et al. Superparamagnetic iron oxide nanoparticles as MRI contrast agents for non-invasive stem cell labeling and tracking. Theranostics. 2013;3:595–615.
- Agudelo CA, Tachibana Y, Noboru T, et al. Long-term in vivo magnetic resonance imaging tracking of endothelial progenitor cells transplanted in rat ischemic limbs and their angiogenic potential. Tissue Eng Part A. 2011;17(15–16):2079–2089.
- Green MD, Snoeck H-W. Novel approaches for immune reconstitution and adaptive immune modeling with human pluripotent stem cells. BMC Med. 2011;9(1):51.
- Mohammadian M, Abasi E, Akbarzadeh A. Mesenchymal stem cell-based gene therapy: a promising therapeutic strategy. Artif Cells Nanomed Biotechnol. 2015;44:1–11.
- Gupta PK, Das AK, Chullikana A, et al. Mesenchymal stem cells for cartilage repair in osteoarthritis. Stem Cell Res Ther. 2012;3(4):25.
- Mathiasen AB, Kastrup J. Non-invasive in-vivo imaging of stem cells after transplantation in cardiovascular tissue. Theranostics. 2013;3(8):561–572.
- Hardy J, Edinger M, Bachmann MH, et al. Bioluminescence imaging of lymphocyte trafficking in vivo. Exp Hematol. 2001;29(12):1353–1360.
- Chemaly ER, Yoneyama R, Frangioni JV, et al. Tracking stem cells in the cardiovascular system. Trends Cardiovasc Med. 2005;15(8):297–302.
- Morawski AM, Lanza GA, Wickline SA. Targeted contrast agents for magnetic resonance imaging and ultrasound. Curr Opin Biotechnol. 2005;16(1):89–92.
- Adonai N, Nguyen KN, Walsh J, et al. Ex vivo cell labeling with 64Cu–pyruvaldehyde-bis (N4-methylthiosemicarbazone) for imaging cell trafficking in mice with positron-emission tomography. Proc Nat Acad Sci. 2002;99(5):3030–3035.
- Hinds KA, Hill JM, Shapiro EM, et al. Highly efficient endosomal labeling of progenitor and stem cells with large magnetic particles allows magnetic resonance imaging of single cells. Blood. 2003;102(3):867–872.
- Geng K, Yang ZX, Huang D, et al. Tracking of mesenchymal stem cells labeled with gadolinium diethylenetriamine pentaacetic acid by 7T magnetic resonance imaging in a model of cerebral ischemia. Mol Med Rep. 2015;11(2):954–960.
- Gao Y, Cui Y, Chan JK, et al. Stem cell tracking with optically active nanoparticles. Am J Nucl Med Mol Imaging. 2013;3:232–246.
- Tseng C-L, Shih I-L, Stobinski L, et al. Gadolinium hexanedione nanoparticles for stem cell labeling and tracking via magnetic resonance imaging. Biomaterials. 2010;31(20):5427–5435.
- George M, Abraham TE. Polyionic hydrocolloids for the intestinal delivery of protein drugs: alginate and chitosan—a review. J Contr Rel. 2006;114(1):1–14.
- Kim S, Jo S, Shin E, et al. Evaluations of nerve cell compatibility of self cross-linking chitosan-poly (ethylene oxide) hydrogel. Tissue Eng Regen Med. 2012;9(2):84–91.
- Kwon Y-S, Choi K-B, Lim H, et al. Preparation and characterization of alginate based-fluorescent magnetic nanoparticles for fluorescence/magnetic resonance multimodal imaging applications. Jap J Appl Phys. 2018;57(6S1):06HE03.
- Divya K, Jisha MS. Chitosan nanoparticles preparation and applications. Environ Chem Lett. 2018;16(1):101–112.
- Ilka R, Mohseni M, Kianirad M, et al. Nanogel-based natural polymers as smart carriers for the controlled delivery of Timolol Maleate through the cornea for glaucoma. Int J Biol Macromol. 2018;109:955–962.
- Abnoos M, Mohseni M, Mousavi SAJ, et al. Chitosan-alginate nano-carrier for transdermal delivery of pirfenidone in idiopathic pulmonary fibrosis. Int J Biol Macromol. 2018;118:1319–1325.
- Nicholls FJ, Rotz MW, Ghuman H, et al. DNA–gadolinium–gold nanoparticles for in vivo T1 MR imaging of transplanted human neural stem cells. Biomaterials. 2016;77:291–306.