
Abstract
Diabetic nephropathy (DN) is a common chronic complication of diabetes. In this study, we aimed to explore the potential role of lncRNA LINC-00162 in the pathogenic process of DN. LncRNA microarray analysis, real-time PCR, IHC computational analysis and luciferase assay were performed to explore the regulatory relationship among LINC00162, miR-383 and HDAC9. There was an obvious difference between T2D + DN and T2D − DN patients in their levels of eGRF and albuminuria. A significant difference was observed between T2D + DN and T2D − DN groups in terms of their LINC00162 expression. In particular, LINC00162 and HDAC9 were highly expressed, while miR-383 was lowly expressed in tissues derived from the T2D + DN group compared with those in tissues derived from the T2D − DN group. MiR-383 was able to bind to LINC00162, while HDAC9 was a direct downstream target of miR-383 with a complementary miR-383 binding site located in the 3′ UTR of HDAC9. LINC00162 reduced miR-383 expression and further up-regulated HDAC9 expression, while miR-383 mimics reduced HDAC9 expression under a dose-dependent manner. In summary, we suggested for the first time that down-regulation of LINC00162 was associated with the development of DN in T2D via the up-regulation of miR-383 expression and reduction of HDAC9 expression.
Introduction
In Western countries, advanced renal failure is most commonly caused by diabetic nephropathy [Citation1]. Glomerular abnormalities include the enhanced rate of glomerular filtration and albuminuria and are found at early stages of diabetic nephropathy. The damage to glomerular capillaries is one of the causes of such pathological indices [Citation2]. Podocytes and endothelial cells make up glomerular capillaries. These two types of cells and the corresponding basement membrane make up the barrier of glomerular filtration. Podocyte integrity is a significant factor determining the permselectivity of the barrier of glomerular filtration, and causes impairment in patients with type I and type II diabetes [Citation3–5]. The glomerular endothelium, which can be highly specialized, also renders the glomerular barrier permeability selective [Citation4]. The loss of podocyte is a core pathological basis of DN. Furthermore, podocyte loss is mainly caused by some events such as podocyte apoptosis [Citation6]. Podocyte apoptosis is also among cellular lesions influencing diabetic kidneys at the earliest stage [Citation7]. Recently, studies indicated that this process involves many pathways, such as p38 mitogen-activated protein kinase (MAPK)2,5, transforming growth factor β (TGF-β), and Notch, signalling pathways [Citation8].
Histone deacetylase 9 (HDAC9) belongs to the class IIa HDAC subtype [Citation9,Citation10]. Other HDAC members, including HDAC4, HDAC2 and SIRT1, are implicated in the diabetic kidney disease (DKD), such as Diabetic nephropathy (DN), by modulating inflammation, the epithelial-to-mesenchymal transition (EMT) of epithelial cells of renal tubules, the overmuch accumulation of extracellular matrix (ECM), and podocytes apoptosis [Citation11–13]. The expression of HDAC9 seems to be specific to the tissue, and HDAC9 has been indicated to exert the suppression function in transcriptional processes in brain, vascular system, immune system, bone and skeletal, cardiac and smooth muscle [Citation14]. The up-regulated expression of HDAC9 was found in DN patients’ kidney tissues, again confirming the results of an analysis based on the GEO DKD dataset. In vitro, the authors of a study observed that there was up-regulated HDAC9 expression in HG-treated podocytes, and HDAC9 expression was related to the release of inflammatory cytokines, podocyte apoptosis and the production of reactive oxygen species (ROS). Furthermore, in the present study, the silencing of the gene of HDAC9 was found to significantly lower the podocyte injury induced by HG in vitro, and to alleviate renal injury by improving glomerulosclerosis, modulating apoptosis factors, enhancing the expression of Nephrin and Podocin, and decreasing the chemokines production and proinflammatory cytokines in the diabetic db/db mouse.
The modulation of the level of transcriptome expression is a complicated process involving interactions at multiple levels among molecules including microRNA (miRNA), long noncoding RNA (lncRNA) and protein-coding RNA (mRNA), which are necessary for the maintenance and stability of the transcriptome and the modulation of the homeostasis of the body. The regulatory network involving multiple types of molecules, particularly the interacting network between noncoding RNAs and coding RNAs (mRNAs), has gained a lot of interests in the research of the past several years. According to what was indicated by previous reports, long noncoding RNAs (lncRNAs) with lengths of greater than 200 nt and the short noncoding RNAs microRNAs (miRNAs) with lengths of around 22 nt co-regulate mRNA expression and cross-regulate the expression level of each other. Furthermore, mRNAs also specifically influence the expression level of the noncoding RNA [Citation15,Citation16]. LINC00162 expression in cutaneous squamous cell carcinoma (cSCCs) is increased by the suppression of p38a. After analyzing tissue samples using in situ hybridization, it was found that LINC00162 is highly expressed in cSCCs but lowly expressed in normal keratinocytes. LINC00162 knockdown suppressed cSCC cell migration and proliferation, and repressed the survival of xenografted cSCCs in humans.
It has been shown that HDAC9 was functionally involved in the pathogenesis of DN by regulating oxidative stress as well as the proliferation and apoptosis of podocytes [Citation17]. Furthermore, the computational analysis showed the role of miR-383 as a negative regulator of HDAC9 in the development of DN [Citation18]. In this study, we performed microarray analysis to identify LNC00162 as a differentially expressed lncRNA in the development of DN. Furthermore, we used kidney tissue, blood and urine samples collected from DM patients with or without DN to verify the regulatory relationship among LINC00162, miR-383 and HDAC9 in the pathogenesis of DN.
Materials and methods
Human subjects and sample collection
In this study, a total of 78 type 2 diabetes (T2D) patients were enrolled, among them there were 42 T2D patients diagnosed with diabetic nephropathy (T2D + DN) and 36 T2D patients free of diabetic nephropathy (T2D − DN). The demographic data of all patients were recorded. In addition, kidney, peripheral blood and urine samples were collected from each of the 78 participants to measure their levels of HbA1C, Hb, CRF, Total Cholesterol, HDL Cholesterol, LDL Cholesterol and Triglycerides.
LncRNA microarray
An lncRNA microarray analysis was performed using the collected kidney tissue samples of the patients to determine the presence of any lncRNA that is differentially expression in the two groups of the subjects.
RNA isolation and real-time PCR
The extraction of total RNA was performed for tissue and cell specimens using the Invitrogen Trizol kit (Invitrogen, Carlsbad, CA) based on the recommendation of the manufacturer. Reverse transcription was done for mRNAs, miRNAs and lncRNAs using a Takara Kit (Takara, Tokyo, Japan). Real-time RT-PCR was done using a SYBR Premix purchased from Takara (Takara, Tokyo, Japan). The mRNA levels of BC041954, CR601061, NR-033515, Gm10433, Zfp133-PS, AF087976, NR-023313, LINC00162, A-30-P01021574, Gm6300, Gm1653, AL832916, AK123324, LINC00162, miR-383 and HDAC9 were computed using the 2−ΔΔCt method and GAPDH and U6 mRNAs as the internal standard. The detailed procedures of reverse transcription and real-time PCR were in strict accordance with the protocol provided by the kit manufacturers.
Cell culture and transfection
The culture of HK-2 and 293T cells was carried out using DMEM supplemented with D-glucose at a concentration of 4.5 g/L and FBS at a concentration of 10%. The cell culture condition was 37 °C, 5% CO2 and saturated humidity. Upon 50% confluency, the cells were transfected with a pcDNA blank vector, pcDNA-LINC00162, a scramble control, or 30/60 nM of miR-383 precursors using Lipofectamine 2000 (Invitrogen, Carlsbad, CA). At 48 h post-transfection, the cells were collected for subsequent analysis.
Vector construction, mutagenesis and luciferase assay
The 3′ UTR of HDAC9 containing the miR-383 binding site was cloned into a pcDNA vector purchased from Promega (Madison, WI) and was referred to as the wild type HDAC9. Meanwhile, the miR-383 binding site was also subjected to site-directed mutagenesis to create a mutant fragment of the HDAC9 3′ UTR, and this mutant sequence was also cloned into a pcDNA vector and termed mutant HDAC9. Similarly, wild type and mutant vectors were created for the full length of miR-383, which also contained a seed sequence for LINC00162. In the next step, HK-2 and 293T cells were co-transfected with LINC00162 mimics or a control lncRNA in conjunction with wild type or mutant miR-383, or co-transfected with wild type or mutant HDAC9 in conjunction with miR-383 mimics or a scramble control, respectively, using Lipofectamine 2000. At 48 h after transfection, the relative activities of luciferase in transfected cells were determined using a Promega dual luciferase assay (E1910, Madison, WI). The activity of firefly luciferase was then normalized against that of Renilla luciferase to determine the relative expression of target genes.
Western blot analysis
The collection of transfected HK-2 and 293T cells or tissue samples was carried out via a standard routine and cell lysis was performed using a RIPA buffer purchased from Epizyme, which also contained a cocktail of protease inhibitors. The isolated protein was measured using a BCA Kit. Protein samples were then separated through electrophoresis using 10% SDS-PAGE and then transferred onto a PVDF membrane purchased from Millipore (Billerica, MD). Later on, a blocking buffer (1×) purchased from Epizyme was used to block the membrane for 30 min before the incubation of the membrane with anti-HDAC9 primary antibodies (Abcam, Cambridge, MA) overnight at 4 °C. Anti-GAPDH primary antibody was used as the internal control. After the membrane was further incubated with HRP-labeled secondary antibodies purchased from BioRad (Hercules, CA) at 25 °C for 2 h, signal visualization was performed using an ECL kit (Thermo Fisher Scientific, Waltham, MA). The images of the protein bands were acquired using a Tanon 5200 Biotanon system before the relative expression of HDAC9 was analyzed using Image J software.
Immunohistochemistry
Bright-field immunohistochemistry (IHC) was carried out for the HDAC9 gene on sections of kidney tissues collected from all subjects of this study, so as to compare and evaluate the distributions of HDAC9 proteins between the two different groups. Sections embedded by paraffin were stained by a Dako dye. Immunostaining for HDAC9 was scored as follows: (1) percentage of positive cells <10%; (2) percentage of positive cells 10–50%; (3) percentage of positive cells >50%; signal intensity: (1) absent or low expression; (2) medium expression; (3) high expression. The resultant scores of the percentage of positive cells and expression intensity were multiplied to get a score in a range of 1–9 for every sample.
Statistical analysis
Mean ± standard deviation (SD) computed based on three experiments independent of each other was used to express all data. Statistical analysis was carried out using GraphPad Prism 6. Significance was determined for differences among two groups using one-way ANOVA or Student’s t-test. Three levels of significance were used for confirming the differences: p < .05, p < .01 and p < .001, and any difference with p < .05 was considered statistically significant.
Results
Demographic, clinicopathological and genotypic parameters of the subjects
A total of 78 T2D patients were enrolled in this study. The demographic and clinicopathological data of all patients are summarized in . After analysis by SPSS version 16.0, no difference was observed between T2D + DN and T2D − DN groups with respect to age, sex, BMI, SBP, DBP, HbA1C, Hb, CRF, Total Cholesterol, HDL Cholesterol, LDL Cholesterol and Triglycerides, but the levels of eGRF and albuminuria between the two groups showed obvious differences.
Table 1. Demographic and clinicopathological characteristics of the subjects recruited in the present study.
LINC-00162 was associated with DN
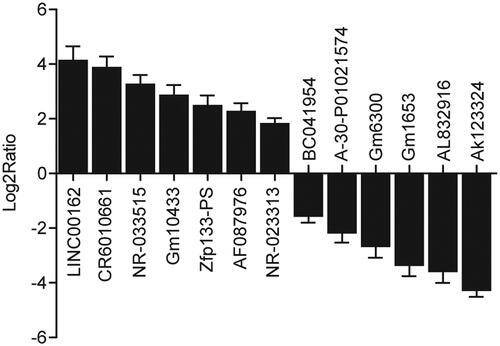
Kidney tissue samples were collected from the 78 participants. Subsequently, an lncRNA microarray was used to identify differentially expressed lncRNAs between T2D + DN and T2D − DN groups. In particular, the expression levels of BC041954, CR601061, NR-033515, Gm10433, Zfp133-PS, AF087976, NR-023313, LINC00162, A-30-P01021574, Gm6300, Gm1653, AL832916 and AK123324 were compared between T2D + DN and T2D − DN groups. As shown in , the levels of BC041954, CR601061, NR-033515, Gm10433, Zfp133-PS, AF087976 and NR-023313 expressed in kidney tissue samples collected from the T2D + DN group were at least 1.8 fold higher than the levels in the T2D − DN group, while the levels of LINC00162, A-30-P01021574, Gm6300, Gm1653, AL832916 and AK123324 expressed in kidney tissue samples collected from the T2D − DN group were at least 1.8 fold higher than the levels in the T2D + DN group. The expression of LINC00162 most significantly differed between the two groups. Therefore, it was hypothesized that LINC-00162 was associated with the onset of DN.
Figure 1. LINC-00162 was associated with DN as the most significantly altered lincRNA in the development of DN.
LINC00162, miR-383 and HDAC9 were involved in DN
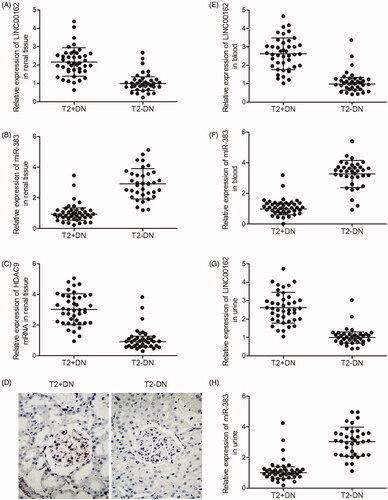
Real-time PCR and IHC were carried out to compare the levels of LINC00162, miR-383 and HDAC9 expression in the kidney, peripheral blood and urine samples collected from T2D + DN and T2D − DN groups. As shown in , LINC00162 (), HDAC9 mRNA () and HDAC9 protein () were more strongly expressed in the kidney tissues collected from the T2D + DN group compared with that in the T2D − DN group, while miR-383 () was more strongly expressed in the kidney tissues collected from the T2D − DN group compared with that in the T2D + DN group. Similarly, the level of LINC00162 expression in the peripheral blood () and urine () samples collected from the T2D + DN group was much higher than that in the T2D − DN group, while the level of miR-383 () in the peripheral blood () and urine () samples collected from the T2D + DN group was much lower than that in the T2D − DN group.
Figure 2. LINC00162, miR-383 and HDAC9 were associated with DN. (A) LINC00162 was highly expressed in kidney tissues obtained from T2D + DN group compared with T2D − DN group. (B) miR-383 level in kidney tissues obtained from the T2D + DN group was much lower than that in samples of the T2D − DN group. (C) HDAC9 mRNA level in kidney tissues obtained from the T2D + DN group was much higher than that in samples of the T2D − DN group. (D) HDAC9 protein level in kidney tissues obtained from the T2D + DN group was evidently increased compared to that in samples of the T2D − DN group. (E) LINC00162 was more strongly expressed in peripheral blood samples obtained from the T2D + DN group compared with that in samples of the T2D − DN group. (F) MiR-383 level in peripheral blood samples obtained from the T2D + DN group was much lower than that in samples of the T2D − DN group. (G) LINC00162 level in urine samples obtained from the T2D + DN group was significantly increased compared to that in samples of the T2D − DN group. (H) miR-383 level in urine samples obtained from the T2D + DN group was apparently decreased compared to that in samples of the T2D − DN group.
The regulatory relationship among LINC00162, miR-383 and HDAC9
Based on a computational analysis carried out using an online target predicting tool (www.targetscan.org), we identified miR-383 as a potential target of LINC00162 (). In addition, we also performed a computational analysis to explore candidate targets of miR-383, and identified HDAC9 () as a direct downstream target of miR-383 with a complementary binding site of miR-383 located in the 3’UTR of HDAC9. Then, dual-luciferase assays were used to confirm that miR-383 could directly bind to LINC00162 by co-transfecting HK-2 and 293T cells with miR-383 mimics and LINC00162. As shown in , the luciferase activity of wild-type LINC00162 in HK-2 and 293T cells was significantly reduced after transfection with miR-383 mimics compared with the transfection using a scramble control. Meanwhile, by co-transfecting HK-2 and 293T cells with wild-type or mutant HDAC9 3′ UTR in conjunction with miR-383 mimics, the regulatory relationship between HDAC9 and miR-383 was determined. As shown in , the luciferase activity of HK-2 or 293T cells carrying wild-type HDAC9 3′ UTR was significantly decreased upon transfection with miR-383, while the luciferase activity of mutant HDAC9 3′ UTR was not affected by miR-383. The above results validated that miR-383 could bind to both LINC00162 and HDAC9 directly.
Figure 3. Regulatory relationship among LINC00162, miR-383 and HDAC9 was investigated using computational analysis, luciferase assay, real-time PCR and IHC assays. (A) Sequence comparison between miR-383 and LINC00162. (B) HDAC9 was identified as a target gene of miR-383 with a ‘seed sequence’ located in the 3’UTR of TP63. (C) Luciferase activity of wild-type LINC00162 in HK-2 and 293T cells was significantly down-regulated subsequent to transfection with miR-383 mimics. (D) Luciferase activity of wild-type, but not that of mutant HDAC9 3’UTR, was decreased in HK-2 and 293T cells over-expressing miR-383. (E) Transfection of HK-2 and 293T cells with LINC00162 inhibited miR-383 expression. (F) HK-2 and 293T cells transfected with LINC00162 exhibited a higher level of HDAC9 mRNA than that in the control group. (G) An evident increase in HDAC9 protein expression was observed in HK-2 and 293T cells transfected with LINC00162. (H) miR-383 mimics apparently reduced LINC00162 expression in a dose-dependent manner in HK-2 and 293T cells. (I) HDAC9 mRNA level showed a stepwise decline as the concentration of miR-383 mimics increased. (J) HDAC9 protein level showed a stepwise decrease as the concentration of miR-383 mimics increased.
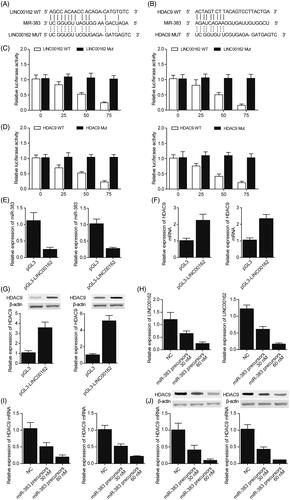
After HK-2 or 293T cells were transfected with various doses of miR-383 precursors (30 or 60 nM), the levels of LINC00162, miR-383 and HDAC9 in the cells were detected using real-time PCR and Western-blot analysis. The transfection with LINC00162 significantly reduced the level of miR-383 () in the cells while increasing the expression of HDAC9 mRNA () and protein () at the same time. In addition, miR-383 mimics reduced the expression of LINC00162 () and HDAC9 mRNA/protein () in a dose-dependent manner in HK-2 and 293T cells.
Discussion
In this study, we collected kidney samples from 78 DM patients, including 42 DN(+) subjects and 36 DN(−) subjects, and carried out an lncRNA microarray analysis to identify potential lncRNAs involved in the pathogenesis of DN. The results showed that the level of LINC00162 expression was the most difference between T2D + DN and T2D − DN groups. Furthermore, we carried out the computational analysis, luciferase assay, real-time PCR and IHC to explore the regulatory relationship among LINC00162, miR-383 and HDAC9. The results showed that miR-383 directly bound to LINC00162, which in turn reduced the level of miR-383 expression. In addition, miR-383 inhibited HDAC9 expression by directly targeting the 3′ UTR of HDAC9. It has been implicated that histone deacetylases (HDACs) are involved in the onset of DN and other kidney diseases. It is well-known that enhanced HDAC4 expression existed not only in DN, but also in the kidney tissues of subjects with focal segmental glomerulosclerosis (FSGS), indicating that the up-regulation of HDAC4 possibly acts as a usual characteristic of podocytopathy, which is potentially a target for therapy [Citation13]. With respect to mechanisms, HDAC4 possibly facilitates proteinuria and glomerular lesion through triggering apoptosis and proinflammatory responses and in particular, through repressing the autophagy of podocytes. Recently, it has been suggested that epigenetic modifications mediated by histone deacetylase (HDAC) emerged as a DN-involved protein2 [Citation19]. Wang and colleagues have explained the expression changes of different HDACs of DN and indicated that HDAC4 in a specific manner facilitates the injury of podocytes in such disease. Particularly, they indicated that the suppression of HDAC4 is able to inhibit autophagic defects of kidneys and cultured podocytes under diabetic conditions. From the aspect of functions, the maintaining of autophagy through the suppression of HDAC4 existed along with the improvement of the injury/death of podocytes and attenuated glomerulopathy, such as mesangial expansion, podocytes loss and albuminuria [Citation13]. Recent studies have suggested an emerging role of histone deacetylase (HDAC)-mediated epigenetic modifications in DN 2 [Citation19]. Wang et al. have unravelled the changes in expression of various HDACs in DN and demonstrated that HDAC4 specifically contributes to podocyte injury in this disease. Specifically, they showed that inhibition of HDAC4 can prevent autophagic defects in cultured podocytes and kidneys under diabetic conditions. Functionally, the maintenance of autophagy by HDAC4 inhibition was accompanied by amelioration of podocyte injury/death and attenuation of glomerulopathy, including albuminuria, podocytes loss and mesangial expansion [Citation13]. In this study, we performed real-time PCR and IHC to compare the levels of LINC00162, miR-383 and HDAC9 expression in the kidney, peripheral blood and urine samples collected from T2D + DN and T2D − DN groups. The results showed that LINC00162 and HDAC9 were more strongly expressed in the T2D + DN group compared with their levels in the T2D − DN group, along with a reduced level of miR-383 expression.
The up-regulation of the expression of HDAC9 was confirmed in DN, which facilitated podocyte injury, the release of inflammatory cytokines and glomerulosclerosis through aggravated apoptosis and inflammation by means of JAK2/STAT3 signalling. By researching the patterns of expression as well as the localization of the protein HDAC9, it was observed that the level of HDAC9 was increased in mouse podocytes treated by high glucose (HG), and tissues from kidneys of the diabetic db/db mouse and the patient with DN. Furthermore, HDAC9 knockdown in podocytes of mice significantly inhibited the generation of reactive oxygen species (ROS) induced by HG, inflammation and cell apoptosis via JAK2/STAT3 pathway and decreased the injury of podocytes through lowering the levels of the expression of Podocin and Nephrin. Furthermore, in the diabetic db/db mouse, HDAC9 silencing lowered glomerulosclerosis, the release of inflammatory cytokines, renal injury and podocyte apoptosis. In summary, such data show that HDAC9 is possibly related to the DN process, particularly the injury of podocytes. Podocyte dysfunction plays a significant role in DN onset and development. Recently, it has been proved that histone deacetylases (HDACs) play crucial roles in DN pathogenesis. In summary, the present research is the first one to research into patterns of HDAC9 expression in the disease DN and also further provided the evidence for the conclusion that HDAC9 facilitates the injury of podocytes and glomerulosclerosis through triggering the production of ROS and the apoptosis of podocyte by means of JAK/STAT3 signalling pathway, and the release of inflammatory cytokines in DN.
HDAC1 also belongs to HDAC family. In 1996, trapoxin (an HDAC inhibitor) was obtained from nuclear extracts and was used as the affinity tag to identify HDAC1 [Citation20]. Later on, 18 members of the HDAC family were found in the genome of humans. Histone deacetylases are comprised of 18 genes and these genes make up a family and are classified into classes I IV according to the homology of these genes to the corresponding orthologues in yeast. Classes I, II and IV comprise 11 members of the family, which are called classical HDACs, while the seven members of class III are sirtuins. Among them, the classical ones are a new promising class of targets of drugs against cancers. Sodium butyrate is a fatty acid and acts as an HDAC inhibitor in some studies [Citation21–23]. Diabetes seems to significantly influence the function of the kidney according to the evidence that diabetes was associated with enhanced plasma urea and creatinine levels, while significant changes of total protein, plasma albumin and relative kidney weight were not found. NaB used as a post-treatment significantly restored the above mentioned biochemical parameters. Such post-treatment finally significantly ameliorated the histological alterations induced by diabetes, including tubular damage which further includes eosinophilic (pink) staining loss in the cytoplasm of tubules and the detachment of podocytes. The treatment with NaB resulted in the significant restoration of glomerular area (diameter), volume and capsular space increased due to diabetes as well as kidney cytotoxicity. The aforementioned results proved that NaB has renoprotective effects in renal damage induced by diabetes both at structural and functional levels.
There are limitations in this study: Firstly, the samples size of this study was relatively small and hence further studies involving larger sample sizes are needed; Secondly, this study did not use animal models. Therefore, the treatment efficacy of lncRNAs should be investigated in animal models of DN to confirm the conclusion of this study.
Conclusions
In summary, the findings of this study verified the role of miR-383 as a negative regulator of HDAC9. We identified one differentially expressed lncRNA, LINC00162, might be involved in the onset of DN by functioning as a sponge of miR-383. Therefore, LINC00162 is involved in the pathogenesis of DN via modulating the miR-383/HDAC9 signalling pathway.
Ethical approval
The study was approved by the institutional ethics committee and written consent was obtained before the initiation of this study.
Author contributions
Study concept and plan: WenXing Fan, KunHua Wang; Clinical data collection and processing: WenXing Fan, XiaoLing Wen, Yancui Zhu, KunHua Wang, HongYu Qiu; Literature collection: Jing Zhang, Feng Su; Data analysis and visualisation: KunHua Wang, HongYu Qiu, Jing Zhang; Final manuscript: WenXing Fan, KunHua Wang.
Disclosure statement
No potential conflict of interest was reported by the author(s)
Data availability statement
The datasets used and/or analyzed during the current study are available from the corresponding author on reasonable request.
Additional information
Funding
References
- Beto JA, Bansal VK, Ing TS, et al. Variation in blood sample collection for determination of hemodialysis adequacy. Council on Renal Nutrition National Research Question Collaborative Study Group. Am J Kidney Dis. 1998;31(1):135–141.
- Wendt TM, Tanji N, Guo J, et al. RAGE drives the development of glomerulosclerosis and implicates podocyte activation in the pathogenesis of diabetic nephropathy. Am J Pathol. 2003;162(4):1123–1137.
- Dalla Vestra M, Masiero A, Roiter AM, et al. Is podocyte injury relevant in diabetic nephropathy? Studies in patients with type 2 diabetes. Diabetes. 2003;52(4):1031–1035.
- Haraldsson B, Sorensson J. Why do we not all have proteinuria? An update of our current understanding of the glomerular barrier. News Physiol Sci. 2004;19:7–10.
- Meyer TW, Bennett PH, Nelson RG. Podocyte number predicts long-term urinary albumin excretion in Pima Indians with Type II diabetes and microalbuminuria. Diabetologia. 1999;42(11):1341–1344.
- Shankland SJ. The podocyte’s response to injury: role in proteinuria and glomerulosclerosis. Kidney Int. 2006;69(12):2131–2147.
- Susztak K, Raff AC, Schiffer M, et al. Glucose-induced reactive oxygen species cause apoptosis of podocytes and podocyte depletion at the onset of diabetic nephropathy. Diabetes. 2006;55(1):225–233.
- Tanaka E, Asanuma K, Kim E, et al. Notch2 activation ameliorates nephrosis. Nat Commun. 2014;5:3296.
- Zhou X, Marks PA, Rifkind RA, et al. Cloning and characterization of a histone deacetylase, HDAC9. Proc Natl Acad Sci USA. 2001;98(19):10572–10577.
- Witt O, Deubzer HE, Milde T, et al. HDAC family: what are the cancer relevant targets? Cancer Lett. 2009;277(1):8–21.
- Yacoub R, Lee K, He JC. The role of SIRT1 in diabetic kidney disease. Front Endocrinol. 2014;5:166.
- Noh H, Oh EY, Seo JY, et al. Histone deacetylase-2 is a key regulator of diabetes- and transforming growth factor-beta1-induced renal injury. Am J Physiol Renal Physiol. 2009;297(3):F729–F739.
- Wang X, Liu J, Zhen J, et al. Histone deacetylase 4 selectively contributes to podocyte injury in diabetic nephropathy. Kidney Int. 2014;86(4):712–725.
- Parra M. Class IIa HDACs - new insights into their functions in physiology and pathology. FEBS J. 2015;282(9):1736–1744.
- Martens-Uzunova ES, Böttcher R, Croce CM, et al. Long noncoding RNA in prostate, bladder, and kidney cancer. Eur Urol. 2014;65(6):1140–1151.
- Ribeiro AO, Schoof CRG, Izzotti A, et al. MicroRNAs: modulators of cell identity, and their applications in tissue engineering. Microrna. 2014;3(1):45–53.
- Wysocka A, Cybulski M, Berbeć H, et al. Prognostic value of paraoxonase 1 in patients undergoing coronary artery bypass grafting surgery. Med Sci Monit. 2014;20:594–600.
- Huang S-S, Ding D-F, Chen S, et al. Resveratrol protects podocytes against apoptosis via stimulation of autophagy in a mouse model of diabetic nephropathy. Sci Rep. 2017;7(1):45692.
- Advani A, Huang Q, Thai K, et al. Long-term administration of the histone deacetylase inhibitor vorinostat attenuates renal injury in experimental diabetes through an endothelial nitric oxide synthase-dependent mechanism. Am J Pathol. 2011;178(5):2205–2214.
- Taunton J, Hassig CA, Schreiber SL. A mammalian histone deacetylase related to the yeast transcriptional regulator Rpd3p. Science. 1996;272(5260):408–411.
- Boffa LC, Vidali G, Mann RS, et al. Suppression of histone deacetylation in vivo and in vitro by sodium butyrate. J Biol Chem. 1978;253(10):3364–3366.
- Layden BT, Angueira AR, Brodsky M, et al. Short chain fatty acids and their receptors: new metabolic targets. Transl Res. 2013;161(3):131–140.
- Samuelsson U, Ludvigsson J. The concentrations of short-chain fatty acids and other microflora-associated characteristics in faeces from children with newly diagnosed Type 1 diabetes and control children and their family members. Diabet Med. 2004;21(1):64–67.