
Abstract
The small diameter crystalline silica is inhaled into the lung and cannot be cleared. As a result, the patient suffers from silicosis, a lung disease for which there is no effective treatment except lung transplantation. The aim of this study is to reveal the histological, cytological and metabolic characteristics of mice with pulmonary fibrosis induced by different doses of silica, and to provide an ideal animal model for drug development and disease research of pulmonary fibrosis. The experimental mice were divided into five groups. The mice were sacrificed 42 d later by nasal inhalation of normal saline and suspension containing silica 1 mg, 2 mg, 4 mg and 8 mg. Lung specimens and bronchoalveolar lavage fluid (BALF) were collected for histological and cytological examination. Carotid blood was collected and centrifuged to obtain serum for UHPLC-QE-MS non-target metabolomics detection. Compared with the normal control group, except 1 mg silica group, the other dosage groups showed different degree of disease characteristics. Metabolomics analysis showed that arginine and proline metabolism, pentose phosphate pathway, histidine metabolism, cysteine and methionine metabolism, ascorbic acid and aldoglucose metabolism were important metabolic pathways. This study reveals the histological, cytological and metabolic features of four-dose-gradient silica-induced pulmonary fibrosis mouse models.
Introduction
In special occupational environments exposed to lots of dust, small-diameter crystalline silica can be recognized and phagocytized by phagocytes after inhaled into the lungs [Citation1]. Due to the inability to decompose silica, phagocytes are activated and die under silica, resulting in the release of phagocytized silica particles and further reorganization and phagocytosis by phagocytes [Citation2,Citation3]. Multiple cycles of this process can activate a variety of inflammatory pathways, followed by massive collagen deposition and excessive fibroblast proliferation, finally leading to silicosis mainly characterized by pulmonary fibrosis [Citation4,Citation5].
At present, there is no specific drug that can effectively treat pulmonary fibrosis. The clinical symptoms of patients with pulmonary fibrosis always include a dry cough and progressive dyspnoea, eventually leading to progressive respiratory failure and death, which seriously threatens the life of patients [Citation6,Citation7]. Due to the lack of animal models that can truly reflect the disease and the exact pathogenesis, as well as the not fully clarified disease mechanism, the development of anti-pulmonary fibrosis drugs is very slow. On this basis, this study established mouse models of pulmonary fibrosis closer to human chronic and progressive pulmonary fibrosis [Citation8]. In addition, combined with histological, cytological and metabolic methods, multiple characteristics of the mice were revealed, so as to provide an ideal animal model for accelerating the development of anti-pulmonary fibrosis drugs and the research on disease mechanism.
Materials and methods
Chemicals and reagents
Silica (batch C000342814; purity 99.99%; granular 0.2–0.7 mm) was purchased from Umicore (Brussels, Belgium) and suspended in normal saline at 50 mg/mL prior to use. Methanol and acetonitrile used in the experiment were LC–MS grade and purchased from CNW Technologies (Düsseldorf, Germany). Ammonium acetate is LC–MS grade, purchased from Sigma-Aldrich (St. Louis, MO); ammonium hydroxide was LC–MS grade, purchased from Fisher Chemical (Waltham, MA); ultrapure water was from Watsons (Kuala Lumpur, Malaysia).
Experimental animals
Male Kunming mouse, weight 18–20 g (certificate no.: SCXK20160002), was purchased from SPF Biotechnology Co., Ltd. (Beijing, China). All procedures of this study were approved by the Experimental Animal Ethics Committee of Baotou Medical College (Baotou Experimental Animal Ethics Committee) (licence number 18, 2021). The mice were kept in a plastic cage under the standard environment of 25 ± 1 °C and 12/12 h light–dark cycle, and could eat and drink freely.
Experimental grouping and drug administration
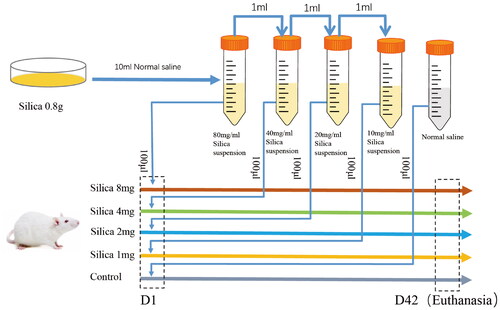
Thirty-five healthy mice were randomly divided into five groups with seven mice in each group: control group (normal saline), 1 mg silica group, 2 mg silica group, 4 mg silica group and 8 mg silica group. All mice were anaesthetized by intraperitoneal injection of 1% pentobarbital sodium (10 mL/kg body weight). After anaesthesia, a single nasal inhalation of silica-1, silica-2, silica-4 and silica-8 mg was performed in the 1, 2, 4 and 8 mg silica groups, respectively. Mice in control group inhaled equal volume of normal saline, and the specific plan is shown in .
Figure 1. Silica nasal inhalation protocol.
Count of inflammatory cells in alveolar lavage fluid
On the 42nd day of silica inhalation, mice were anaesthetized and 1 mL of blood was taken from their carotid arteries and centrifuged in a centrifuge tube at 800 rpm for 10 min. The obtained serum was stored at −80 °C for biomarker detection. The left lung was ligation and the right bronchi was lavaged with 2 mL of normal saline and bronchoalveolar lavage fluid (BALF) was obtained. The BALF sample was centrifuged at 3000 rpm for 10 min, and the cells submerged at the bottom of the tube were suspended with 100 mL physiological saline, and then passed through Cytospin4 (Thermo Fisher Scientific, Waltham, MA) centrifuged at 800 rpm for 10 min, the cells were centrifuged onto slides for Giemsa staining, count the total number of cells by standard cell morphology and count the cell classifications under light microscope, calculate the percentage of different cell types the total number of cells. Monocyte/macrophage quantification data were obtained by counting 400 monocyte macrophages per slide; analysis was performed by counting 500 neutrophils, macrophages and lymphocytes per slide.
Histological examination
The left lung ligation mentioned above was fixed in 10% formalin solution for more than 24 h. After dehydration, paraffin embedding was carried out to prepare paraffin sections with a thickness of 4 μm. The prepared paraffin sections were processed with haematoxylin–eosin (H&E; Sigma-Aldrich, St. Louis, MO) staining and used for histological analysis. The inflammation and fibrosis of lung tissue were observed under light microscope and the inflammation and fibrosis degree were scored on sections [Citation9].
Metabonomics analysis
Metabolite detection
Take 100 μL mouse serum sample into EP tube, then add methanol:acetonitrile = 1:1 (v/v) with 400 μL of the extract containing the isotope labelled internal standard mixture, vortex mixing for 30 s, ultrasound for 10 min under ice water bath, incubation at −40 °C for 1 h, then centrifugation at 12,000 rpm for 15 min at 4 °C, the supernatant was separated and placed in the sample bottle, meanwhile, all samples were mixed with the same amount of supernatant into QC samples. An equal amount of the above samples were taken for UPLC-QE-MS analysis.
The UPLC-QE-MS analysis
UPLC-QE-MS analysis was performed using a Vanquish (Thermo Fisher Scientific, Waltham, MA) ULTRA high performance liquid chromatography. The target compounds were separated by Waters ACQUITY UPLC BEH amide (Milford, MA) (2.1 mm × 100 mm, 1.7 μm) liquid chromatography column. Phase A was aqueous, containing 25 mmol/L ammonium acetate and 25 mmol/L ammonia water, and phase B was acetonitrile. Sample tray temperature: 4 °C, injection volume: 3 μL.
Thermo Q Exactive secondary mass spectrometry data acquisition parameters are as follows: sheath gas flow rate: 30 Arb, aux gas flow rate: 25 Arb, capillary temperature: 350 °C, full ms resolution: 60,000, MS/MS resolution: 7500, collision energy: 10/30/60 in NCE mode, spray voltage: 3.6 kV (positive) or −3.2 kV (negative).
The data processing
ProteoWizard software was used to output the original data in mzXML format. The R program package (kernel XCMS) was independently written for peak recognition, peak extraction, peak alignment and integration, and then BiotreeDB (V2.1) self-built secondary mass spectrometry database was used for metabolite identification.
The preprocessed data were input into SIMCA software (V16.0.2, Sartorius Stedim Data Analytics AB, Umea, Sweden) for principal component analysis (PCA) and orthogonal partial least squares discriminant analysis (OPLS-DA). The replacement test of OPLS-DA was performed to avoid overfitting of the test model and evaluate the statistical significance of the model. The metabolite contribution was calculated based on the variable item importance (VIP) value and the p value of the Student t-test.
In order to determine the related metabolic pathways, we used KEGG (http://www.genome.jp/kegg/) and MetobAnalyst commercial database (http://www.metaboanalyst.ca/) pathway enrichment analysis.
Statistical analysis
The experimental data were expressed as mean ± SEM. Statistical analysis was performed using GraphPad Prism software (version 8.01; GraphPad Software Inc., San Diego, CA), the statistical significance was evaluated by parametric method and one-way ANOVA. p < 0.05 was considered to be statistically significant. In the metabolomics part, the data analysis of control group and different doses of silica group was conducted by the Student t-test, and the metabolites with significance level p < 0.05 and the variable projection significance (VIP) of the first principal component of OPLS-DA model >1 were considered to have significant differences.
Experimental results
Histological and pathological analysis
Intranasal instillation of silica at different doses resulted in inflammation at varying degrees and histological changes in the mouse lungs
displays the representative optical microscope images. displays the inflammation scores and fibrosis scores of lung tissues in the all silica groups, respectively.
Figure 2. (A) Optical microscope pictures of lung tissue sections; (B) Giemsa staining of alveolar lavage fluid cells (10 × 100); (C) inflammation score; (D) fibrosis score; (E) total cells count per field; (F) macrophages; (G) neutrophils; (H) lymphocytes; (I) percentage of monocytes; (J) percentage of macrophages. *p < 0.05, **p < 0.01, ***p < 0.001 and ****p < 0.0001.
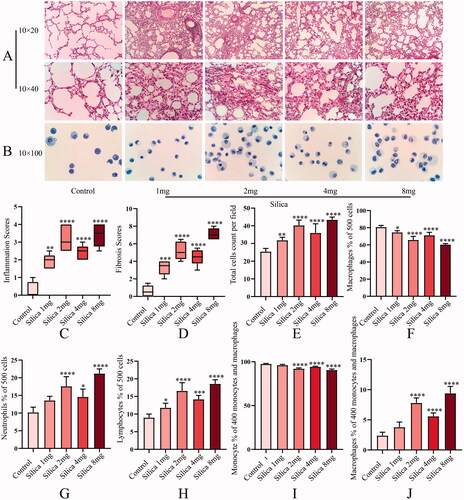
Compared with the control group, the inflammation scores of all silica groups were significantly higher, and the lung tissues of the groups with different silica doses showed different degrees of inflammatory cell infiltration and alveolar damage. The fibrosis scores of all silica groups were significantly higher than that of the control group, indicating that the lungs of mice underwent obvious fibrosis changes after inhaling different doses of silica. Alveolar structure destruction, inflammatory cell infiltration and alveolar wall thickening were also observed in lung tissue sections.
Parameters of inflammatory cells in bronchoalveolar lavage fluid changed under silica at different doses
The total number of cells per visual field in the BALF increased significantly after the nasal inhalation of silica (), and the number of cells in all silica groups was higher than that in the control group (). The proportion of macrophages in all silica groups was significantly lower than that in the control group (); the proportion of neutrophils in all silica groups, except for the 1 mg group, was significantly higher than that in the control group (); the proportion of lymphocytes in all silica groups was significantly higher than that in the control group (). In the monocyte/macrophage system, except for the 1 mg group, the proportion of monocytes decreased while the proportion of macrophages increased significantly in all silica groups ().
Metabolic profiling
Multivariate data analysis
Multivariate data analysis between different groups is shown in and . Principal component analysis presented significant separation and good separation and clustering among all groups. The OPLS-DA revealed clear and unique clustering. Permutation test of the OPLS-DA model demonstrated that the model fitting was effective and predictive. As shown in , the clustering heatmap exhibited significant differences in components in different groups.
Figure 3. Control group vs. 1 mg silica group multivariate data analysis. PCA score plot (A: positive; D: negative). OPLS-DA score plot (B: positive; E: negative). OPLS-DA permutation plot (C: positive; F: negative). Control group vs. 2 mg silica group multivariate data analysis. PCA score plot (G: positive; J: negative). OPLS-DA score plot (H: positive; K: negative). OPLS-DA permutation plot (I: positive; L: negative).
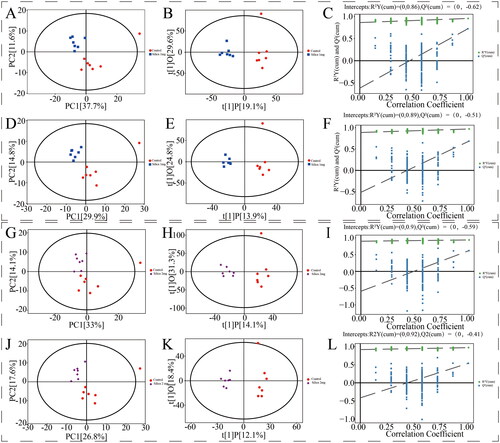
Figure 4. Control group vs. 4 mg silica group multivariate data analysis. PCA score plot (A: positive; D: negative). OPLS-DA score plot (B: positive; E: negative). OPLS-DA permutation plot (C: positive; F: negative). Control group vs. 8 mg silica group multivariate data analysis. PCA score plot (G: positive; J: negative). OPLS-DA score plot (H: positive; K: negative). OPLS-DA permutation plot (I: positive; L: negative).
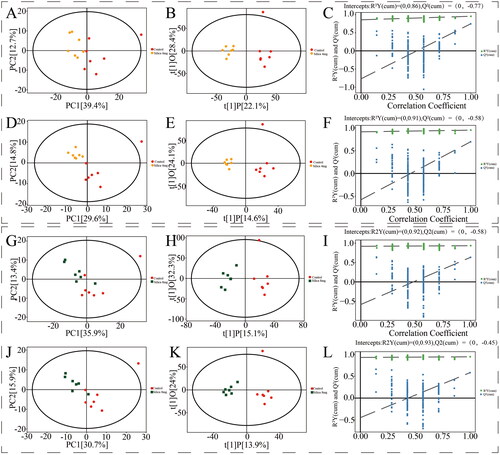
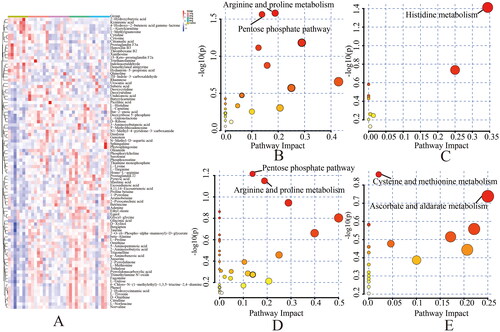
Figure 5. (A) Clustering heatmap: the metabolites were found in the clustering heatmap of control group, 1 mg silica group, 2 mg silica group, 4 mg silica group and 8 mg Silica group. Rows – metabolites; columns – samples. Darker colors indicate a greater difference in metabolites from the control level, and lighter colors indicate a smaller difference from the control level. Metabolic pathway bubble chart: (B) control group vs. silica 1 mg group; (C) control group vs. 2 mg silica group; (D) control group vs. 4 mg silica group; (E) control group vs. 8 mg silica group.
Pathway enrichment analysis
The criteria of VIP >1 and p < 0.05 were used to screen potential differential metabolites, and pathway enrichment analysis was conducted (). A total of 46 potential differential metabolites were screened from the control and 1 mg silica groups. The metabolic pathways of arginine and proline as well as pentose phosphate were obviously dysregulated. The levels of l-proline, ornithine, phosphocreatine and pyruvic acid involved in arginine and proline metabolic pathways increased to varying degrees. The levels of deoxyribose 5-phosphate, d-ribose and gluconic acid involved in the pentose phosphate pathway increased to varying degrees. A total of 30 potential differential metabolites were screened from the control and 2 mg silica groups. The histidine metabolism pathway was obviously dysregulated, and the levels of urocanic acid and l-histidine involved in that pathway increased to varying extents. A total of 63 potential differential metabolites were screened from the control and 4 mg silica groups. The pentose phosphate, arginine and proline metabolic pathways were obviously dysregulated. The levels of deoxyribose 5-phosphate, d-ribose and gluconic acid, involved in the pentose phosphate pathway, increased to different degrees. The levels of l-proline, ornithine, phosphocreatine and pyruvic acid involved in the arginine and proline metabolic pathways increased to varying degrees. A total of 30 potential differential metabolites were screened from the control and 8 mg silica groups. The metabolic pathways of cysteine, methionine, ascorbate and aldarate were obviously dysregulated. The levels of 5′-methylthioadenosine and pyruvic acid involved in the cysteine and methionine metabolic pathways increased to different extents. Elevated levels of l-gulonolactone involved in ascorbic acid and aldose metabolic pathways.
Biomarker screening
Through the enrichment pathway analysis of potential differential metabolites, five important metabolic pathways were screened out from the four comparisons, and 11 differential metabolites were involved in these pathways. These 11 differential metabolites were screened as the key differential metabolites affecting the disease procession. The relative contents of the key differential metabolites are shown in , and these key metabolites and their involved pathways are displayed in .
Figure 6. Changes in relative contents of key metabolites, *p < 0.05 and **p < 0.01.
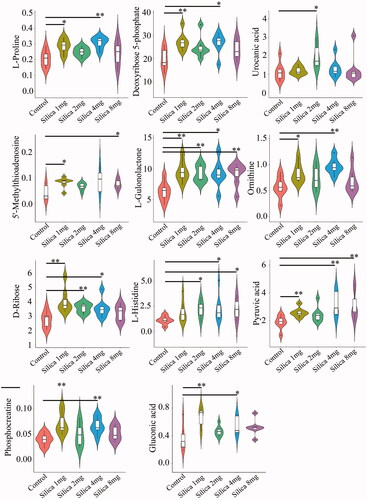
Table 1. Key differential metabolite information.
Discussion
Silicosis is a pulmonary disease characterized by pulmonary fibrosis. To promote the understanding of the pathogenesis of pulmonary fibrosis caused by silica, and provide an ideal animal model for developing new drugs for pulmonary fibrosis, this experiment revealed multiple features of mouse models of pulmonary fibrosis induced by silica at different doses.
Histological and cytological studies revealed that the lung tissue of mice inhaled with different doses of silica showed significant tissue damage, and decreased macrophages and increased lymphocytes. Except for the silica 1 mg group, neutrophils increased to varying degrees, the proportion of monocytes decreased, and the proportion of macrophages increased.
Metabolomics showed that the arginine and proline metabolic pathways and pentose phosphate pathways were dysregulated in the control vs. 1 mg silica groups and the control vs. 4 mg silica groups. The levels of l-proline, ornithine, phosphocreatine and pyruvic acid involved in arginine and proline metabolism increased to varying degrees. Arginine and proline metabolism has been shown to be important in the metabolomic studies of asbestosis, silicosis, fibrotic pulmonary sarcoidosis, idiopathic pulmonary fibrosis and other pulmonary fibrosis-related diseases. Various compounds involved in this metabolic pathway play an important role in pulmonary fibrosis [Citation10–13]. Proline is the main component of collagen, and ornithine can be converted into proline and hydroxyproline, which in turn can be converted into collagen. Collagen can cause excessive proliferation of fibroblasts and massive accumulation of extracellular matrix, which can induce pulmonary fibrosis [Citation11]. Elevated ornithine and l-proline levels may indicate continuous collagen deposition and exacerbation of pulmonary fibrosis. Phosphocreatine plays an important role in energy metabolism and adenosine triphosphate (ATP) synthesis; elevated phosphocreatine levels may indicate that energy conversion in the body is affected [Citation14,Citation15].
The pentose phosphate pathway, a form of glucose oxidative decomposition, is the main pathway for the synthesis of phosphoribose and reduced nicotinamide adenine dinucleotide phosphate, which plays an important antioxidant role in the body [Citation16]. Abnormal pentose phosphate metabolism may indicate a disorder in the normal antioxidant stress function, and the levels of deoxyribose 5-phosphate, d-ribose and gluconic acid involved in this pathway were increased to different degrees. Deoxyribose 5-phosphate and d-ribose jointly synthesize d-ribose 5-phosphate, which plays an important role in energy production, and gluconic acid is a glucose-related metabolite [Citation16,Citation17]. Elevated levels of deoxyribose 5-phosphate, d-ribose and gluconic acid indicate a dysregulated pentose phosphate pathway that leads to impaired antioxidant function [Citation18].
The control vs. 2 mg silica group showed dysregulated histidine metabolism, and the levels of l-histidine and urocanic acid involved in this pathway increased significantly. l-Histidine plays an important role in many biological processes such as proton buffering, scavenging of reactive oxygen species and erythropoiesis [Citation19]. The increase in l-histidine levels may indicate that the physiological defence processes such as proton buffering and scavenging of reactive oxygen species cannot be executed normally. During histidine metabolism, histidine is enzymatically transformed into urocanic acid, which is eventually converted into glutamate, which in turn can be converted into the antioxidant glutathione in the body. The increased levels of l-histidine and urocanic acid may indicate the imbalance in histidine metabolism and the disruption of normal body function under the influence of silica [Citation20].
Dysregulation of cysteine and methionine metabolism as well as ascorbic acid and aldose metabolism was observed in the control vs. 8 mg silica group. Levels of 5′-methylthioadenosine and pyruvic acid involved in cysteine and methionine metabolism were significantly increased. Disorders in this metabolic pathway can seriously affect the homocysteine and glutathione content and the ability of the body to counter oxidative stress [Citation21,Citation22]. 5′-Methylthioadenosine is eventually converted to methionine through a complex series of reactions in the body [Citation23]. Methionine is a precursor of cysteine, which plays an important role in protein translation and the synthesis of the antioxidant glutathione [Citation24]. Abnormal levels of 5′-methylthioadenosine may indicate abnormal synthesis of cysteine and the antioxidant glutathione, which may disrupt the body’s anti-inflammatory and antioxidant capacity.
In our study, we found that the levels of pyruvic acid in the control vs. 1 mg silica groups, the control vs. 4 mg silica groups and the control vs. 8 mg silica groups all increased to varying degrees. Pyruvic acid plays an important role in energy production. During glycolysis, glucose is broken down into pyruvic acid, which is decarboxylated under aerobic conditions to form acetyl-CoA. This compound participates in the tricarboxylic acid cycle and is broken down in the mitochondria, eventually producing ATP. An abnormal increase in pyruvic acid content may indicate dysregulated glucose metabolism decrease in ATP content and may ultimately lead to pulmonary fibrosis [Citation25,Citation26].
Ascorbic acid and aldose metabolism are important pathways of ascorbic acid production in vivo, and the levels of l-gulonolide involved in these pathways were significantly increased. Ascorbic acid has excellent antioxidant capacity and plays an important role in antioxidant stress and protection in vivo. As an important metabolite in the synthesis of ascorbic acid, the increased content of l-gulonolide may indicate that the normal synthesis of ascorbic acid is blocked, which may cause loss of antioxidant substances from the body, unchecked oxidative stress in the lungs, and ultimately, pulmonary fibrosis [Citation27].
Conclusions
In the present study, we reveal the histological, cytological and metabolic features of mouse models of pulmonary fibrosis induced by silica at four different doses. According to metabonomic analysis, a total of 11 key differential metabolites and five important metabolic pathways are screened out, and the biological significance of these important changes is discussed. The features revealed in this study contribute to a deeper understanding of the pathophysiological mechanism of silica-induced pulmonary fibrosis, and provide a guiding animal model for further relevant research and the development of drugs for pulmonary fibrosis.
Ethics statement
All animal experiments were approved by the Ethics Committee of Laboratory Animals of Baotou Medical College (Baotou, China), licence number no. 18, 2021.
Author contributions
Min Qiu contributed to study design and manuscript writing. Ling Qin contributed to sample detection and data processing. Yonghe Dong contributed to sample collection and processing. Junbing Ma contributed to experimental reagent material preparation and sample collection. Zheng Yang contributed to study design and manuscript review. Zhixiang Gao contributed to manuscript writing and data processing.
Disclosure statement
No potential conflict of interest was reported by the author(s).
Data availability statement
Data supporting the findings of this study are available on request from the corresponding author.
Additional information
Funding
References
- Tan S, Chen S. The mechanism and effect of autophagy, apoptosis, and pyroptosis on the progression of silicosis. Int J Mol Sci. 2021;22(15):8110.
- Tan S, Chen S. Macrophage autophagy and silicosis: current perspective and latest insights. Int J Mol Sci. 2021;22(1):453.
- Yang H, Yang L, Zhang J, et al. Natural course of silicosis in dust-exposed workers. J Huazhong Univ Sci Technolog Med Sci. 2006;26(2):257–260.
- Karkale S, Khurana A, Saifi MA, et al. Oropharyngeal administration of silica in Swiss mice: a robust and reproducible model of occupational pulmonary fibrosis. Pulm Pharmacol Ther. 2018;51:32–40.
- Wang H, Cui J, Hao X, et al. Silicon, an important exposure marker in vivo in silicosis research. Int Arch Occup Environ Health. 2021;94(7):1513–1522.
- Du S, Li C, Lu Y, et al. Dioscin alleviates crystalline silica-induced pulmonary inflammation and fibrosis through promoting alveolar macrophage autophagy. Theranostics. 2019;9(7):1878–1892.
- Mathai SK, Schwartz DA. Translational research in pulmonary fibrosis. Transl Res. 2019;209:1–13.
- Sugimoto N, Suzukawa M, Nagase H, et al. IL-9 blockade suppresses silica-induced lung inflammation and fibrosis in mice. Am J Respir Cell Mol Biol. 2019;60(2):232–243.
- Qiu M, Yang Z, Bian M, et al. Protective effects of isorhynchophylline against silicon-dioxide-induced lung injury in mice. Artif Cells Nanomed Biotechnol. 2020;48(1):1125–1134.
- Mirsaeidi M, Banoei MM, Nienow CK, et al. Plasma metabolomic profile in fibrosing pulmonary sarcoidosis. Sarcoidosis Vasc Diffuse Lung Dis. 2016;33(1):29–38.
- Xue C, Wu N, Fan Y, et al. Distinct metabolic features in the plasma of patients with silicosis and dust-exposed workers in China: a case-control study. BMC Pulm Med. 2021;21(1):91.
- Zhao YD, Yin L, Archer S, et al. Metabolic heterogeneity of idiopathic pulmonary fibrosis: a metabolomic study. BMJ Open Respir Res. 2017;4(1):e000183.
- Zhou M, Xue C, Fan Y, et al. Plasma metabolic profiling in patients with silicosis and asbestosis. J Occup Environ Med. 2021;63(9):787–793.
- Kakehashi A, Suzuki S, Ishii N, et al. Accumulation of 8-hydroxydeoxyguanosine, l-arginine and glucose metabolites by liver tumor cells are the important characteristic features of metabolic syndrome and non-alcoholic steatohepatitis-associated hepatocarcinogenesis. Int J Mol Sci. 2020;21(20):7746.
- Gaddi AV, Galuppo P, Yang J. Creatine phosphate administration in cell energy impairment conditions: a summary of past and present research. Heart Lung Circ. 2017;26(10):1026–1035.
- Schittenhelm D, Neuss-Radu M, Verma N, et al. ROS and pentose phosphate pathway: mathematical modelling of the metabolic regulation in response to xenobiotic-induced oxidative stress and the proposed impact of the gluconate shunt. Free Radic Res. 2019;53(9–10):979–992.
- Du X, Zeng X, Pan K, et al. Metabolomics analysis of urine from healthy wild type mice exposed to ambient PM2.5. Sci Total Environ. 2020;714:136790.
- Mahoney DE, Hiebert JB, Thimmesch A, et al. Understanding d-ribose and mitochondrial function. Adv Biosci Clin Med. 2018;6(1):1–5.
- Holecek M. Histidine in health and disease: metabolism, physiological importance, and use as a supplement. Nutrients. 2020;12(3):848.
- Lee JD, Kim HY, Kang K, et al. Integration of transcriptomics, proteomics and metabolomics identifies biomarkers for pulmonary injury by polyhexamethylene guanidine phosphate (PHMG-p), a humidifier disinfectant, in rats. Arch Toxicol. 2020;94(3):887–909.
- Vijaya Lakshmi SV, Naushad SM, Rupasree Y, et al. Interactions of 5′-UTR thymidylate synthase polymorphism with 677C –>T methylene tetrahydrofolate reductase and 66A –>G methyltetrahydrofolate homocysteine methyl-transferase reductase polymorphisms determine susceptibility to coronary artery disease. J Atheroscler Thromb. 2011;18(1):56–64.
- Blachier F, Andriamihaja M, Blais A. Sulfur-containing amino acids and lipid metabolism. J Nutr. 2020;150(Suppl. 1):2524S–2531S.
- Avila MA, Garcia-Trevijano ER, Lu SC, et al. Methylthioadenosine. Int J Biochem Cell Biol. 2004;36(11):2125–2130.
- Martinez Y, Li X, Liu G, et al. The role of methionine on metabolism, oxidative stress, and diseases. Amino Acids. 2017;49(12):2091–2098.
- Roque W, Romero F. Cellular metabolomics of pulmonary fibrosis, from amino acids to lipids. Am J Physiol Cell Physiol. 2021;320(5):C689–C695.
- Kang YP, Lee SB, Lee JM, et al. Metabolic profiling regarding pathogenesis of idiopathic pulmonary fibrosis. J Proteome Res. 2016;15(5):1717–1724.
- Paciolla C, Fortunato S, Dipierro N, et al. Vitamin C in plants: from functions to biofortification. Antioxidants. 2019;8(11):519.