
 ?Mathematical formulae have been encoded as MathML and are displayed in this HTML version using MathJax in order to improve their display. Uncheck the box to turn MathJax off. This feature requires Javascript. Click on a formula to zoom.
Abstract
This study was aimed to develop an efficient tumour-targeted liposome nanobubbles (LNBs) system using ultrasound-targeted nanobubble destruction for enhanced release and transfection of miRNA-199a-3p in hepatocellular carcinoma (HCC) therapy. The prepared LNBs comprised a polyethylene glycol-modified liposome shell and a perfluoropentane (PFP) core. MiRNA-199a-3p was attached to the nanocomposite surface via electrostatic adsorption, while RGD peptide functionalized the LNBs surface for enhanced HCC cell targeting, namely PFP@miR-RGD-LNBs. The LNBs were spherical with a narrow size distribution. The gene-loaded LNBs effectively condensed miR-199a-3p and protected it from enzymatic degradation. Low-intensity focused ultrasound (LIFU) promoted a fast release of miR-199a-3p from the prepared LNBs, thereby enhancing therapeutic effects. The combined application of PFP@miR-RGD-LNBs and LIFU exhibited a more potent inhibitory effect on HepG2 cells than the other groups, potentially due to LIFU promoting rapid and efficient gene release at the target site and increasing cell membrane permeability. Quantitative reverse transcription-polymerase chain reaction analysis revealed significantly increased mRNA expression levels of key apoptosis markers (Bad, Bax, Caspase-9 and Caspase-3) in the PFP@miR-RGD-LNBs + LIFU group compared to other groups. These findings suggest that the prepared LNBs are highly likely to be promising candidates for further exploration of HCC gene delivery and therapy.
Graphical Abstract
Introduction
Hepatocellular carcinoma (HCC) is a malignant tumour that seriously threatens human health, manifesting as pain, weight loss, ascites, jaundice and decreased liver function, which may lead to death in advanced stages. Common treatment methods include surgery, chemotherapy, radiotherapy, interventional therapy, targeted therapy and immunotherapy. However, these clinical treatment methods have limitations, such as limited applicability, unsatisfactory efficacy and significant side effects.
In recent years, gene therapy has emerged as a promising avenue for HCC treatment, particularly due to its ability to regulate specific genes and signalling pathways associated with cancer progression [Citation1–3]. This novel approach facilitates more accurate and tailored treatment outcomes compared to conventional therapies. In addition, gene therapy exhibits fewer side effects, thereby demonstrating substantial potential in the field of cancer research. MicroRNAs (miRNAs) constitute a class of short, non-coding RNA molecules that play a critical role in cancer development and progression [Citation4]. The abnormal expression of miRNAs affects cellular processes such as proliferation, apoptosis, invasion and metastasis. MiR-199a is usually expressed at low levels in HCC tissues, but is associated with multiple key genes and signalling pathways, such as mammalian target of rapamycin (mTOR), ERK/MAPK, AKT and VEGF [Citation5,Citation6]. By targeting these pathways, miR-199a inhibits tumour cell proliferation, invasion and metastasis, thus playing a suppressive role in liver cancer development and progression. Consequently, miR-199a exhibits potential therapeutic value in liver cancer treatment. Upregulating miR-199a expression can enhance tumour cell sensitivity to chemotherapeutic agents, including cisplatin and doxorubicin [Citation7,Citation8]. Furthermore, miR-199a can impact liver cancer treatment outcomes by regulating angiogenesis and immune responses within the tumour microenvironment [Citation9,Citation10]. MiR-199a-3p is a specific member of the miR-199a family derived from the 3p arm of the miR-199a precursor RNA. A recent study has shown that miR-199a-3p can inhibit hepatocyte apoptosis and liver injury by targeting PDCD4 [Citation11]. In addition, miR-199a-3p can enhance the anti-tumour effect of Paritaprevir in a liver cancer model [Citation12]. Altogether, gene therapy including miR-199a and miR-199a-3p offers a promising approach for HCC therapy by modulating specific genes and signalling pathways, leading to more precise and personalized results.
Ultrasound-targeted microbubble/nanobubble destruction (UTMD/UTND) is a promising drug and gene delivery technology [Citation13–15]. The primary working principle of UTMD or UTND involves transient cavitation effects, commonly referred to as ‘sonoporation’, and endocytosis, which facilitate the efficient entry of substances into cells [Citation16,Citation17]. Ultrasound irradiation induces microbubble/nanobubble rupture, generating high temperatures, high-speed microflows and substantial shear forces, which in turn create temporary and reversible pores in the cell membrane. Moreover, transient cavitation produces oxygen free radicals, activating vesicle-mediated cell membrane repair transport mechanisms and consequently increasing endocytosis and cell membrane permeability [Citation17,Citation18]. Compared to traditional methods such as chemical methods and electroporation, UTMD/UTND presents several advantages as a gene transfection technology. One notable advantage is that UTMD/UTND allows for the precise delivery of genes or drugs via ultrasound, eliminating the need for invasive procedures [Citation14,Citation19,Citation20]. Another advantage is the use of biocompatible microbubbles or nanobubbles as carriers, which reduces immune responses and toxicity [Citation21,Citation22]. Moreover, the mechanical action of ultrasound forms pores in the cell membrane, permitting the entry of genes or drugs into cells and increasing transfection efficiency [Citation23,Citation24]. Ultrasound also offers real-time imaging capabilities, making it possible to observe microbubble distribution and destruction within the body [Citation21,Citation25]. The accuracy of ultrasound guidance ensures the proper accumulation of microbubbles in the target area, enhancing the treatment’s specificity [Citation26,Citation27].
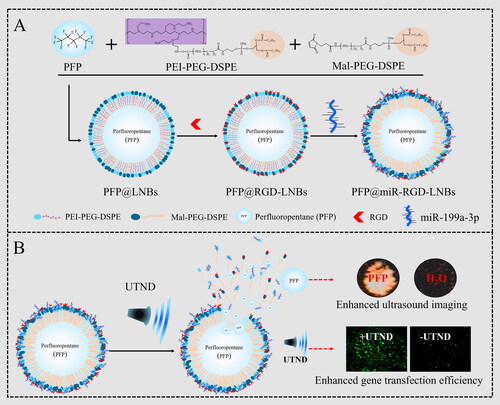
In this study, based on the foundation of earlier work on ultrasound-responsive nanocarriers [Citation28], we designed an effective tumour-targeting ultrasound-responsive nano-probe for gene therapy in HCC. The probe consists of a shell made of polyethylene glycol (PEG)-modified liposome nanobubbles (LNBs) and perfluoropentane (PFP) core. MiRNA-199-3p (miR) was attached to the surface of the nanocomposite via electrostatic adsorption, and the surface of LNBs was functionalized with RGD (Arg–Gly–Asp) peptide to enhance targeting of HCC cells, as illustrated in Scheme 1(A). With the guidance of the targeting peptide RGD, the prepared LNBs were able to enter liver cancer cells more effectively, releasing the ultrasound imaging agent (PFP) and therapeutic agent (miRNA-199a-3p,) under ultrasound mediation. The application of ultrasound energy caused PFP to evaporate, generating expanding and collapsing nanobubbles, which in turn disrupted the LNBs structure. This disruption facilitated the efficient release of miRNA carried by Lipid Nanoparticles (LNPs) into cells and increased their transfection rate, thereby enhancing the therapeutic effect on HCC (Scheme 1(B)).
Scheme 1. Schematic illustration of UTND-responsive LNBs for HCC therapy: (A) preparation of PFP@miR-RGD-LNBs; (B) UTND-mediated release of ultrasound imaging agent and therapeutic miRNA from PFP@miR-RGD-LNBs.
Materials and methods
Materials
1,2-Distearoyl-SN-glycerol-3-phosphoethanolamine-N-carboxy-polyethylene glycol 2000 (DSPE-PEG2000-COOH), 1,2-distearoyl-sn-glycero-3-phosphoethanolamine-N-[maleimide(polyethylene glycol)-2000 (DSPE-PEG2000-Mal), polyethyleneimine (PEI), 2-morpholino-ethanesulfonic acid (MES), N-hydroxysuccinimide (NHS, 99%), 2-morpholino-ethanesulphonic acid (MES) and 1-(3-dimethylaminopropyl)-3-ethylcarbodiimide hydrochloride (EDC, 99%) were purchased from Aladdin Reagent Co., Ltd (Shanghai, China). Perfluoropentane (PFP) was purchased from Sonus Pharmaceuticals (WA, USA). RGD was provided by Hangzhou Peptide Biochem Co., Ltd (Hangzhou, China) with a purity of 97%. MiR-199a (reverse transcription 5′-GTCGTATCCAGT GCAGGGTCCGAGGTATTCGCACTGGATACGACTAACCA-3′) was purchased from Guangzhou Ruibo Biotechnology Co., Ltd (Guangzhou, China). pEGFP (Invitrogen) were purchased from Thermo Fisher Scientific Inc. (CA, USA). All reagents and solvents were of analytical grade and no further purification was required unless otherwise specified. The fowling cell lines were purchased from the Shanghai Cell Bank of the Chinese Academy of Sciences: HepG2 cells (human HCC cell line), L02 cells (normal human liver cell line) and L929 fibroblast cells (mouse fibroblast cell line). The cells were cultured in Dulbecco’s modified eagle medium containing 10% fetal bovine serum (FBS) and 100 U/mL penicillin–streptomycin in a humidified incubator at 37 °C with 5% CO2.
Preparation of LNBs
DSPE-PEG2000-COOH (100 mg), PEI (1800) (658 mg), EDC (100 mg) and NHS (200 mg) were weighed. PEI was dissolved in MES (pH 5.5) and set aside. DSPE-PEG-COOH was dissolved in MES, EDC/NHS was then added to activate carboxyl groups for 30 min and was followed by the addition of the PEI solution. The mixture was stirred at room temperature for 24 h. The reaction mixture was transferred to a 3500 Da dialysis bag and dialyzed against deionized water for 2 days, with the water changed every 4 h. The product, PEI-PEG-DSPE, was obtained through freeze-drying and stored for later use. The lyophilized PEI-PEG-DSPE powder (100 mg) and DSPE-PEG2000-Mal (100 mg) were combined with PFP liquid (0.35 ml). The mixture was then subjected to ultrasonication using an ultrasonic cell disruptor for 3 min in an ice bath to ensure homogenous mixing. Cold deionized water was then added to 30 ml (2 °C –8 °C) and ultrasound was continued for 5 min to obtain PFP@PEI-Mal-PEG-DSPE solution, namely PFP@LNBs.
A measured quantity of 10 ml of the PFP@LNPs solution (10 mg/mL) was added to a container, followed by the drop-wise addition of 10 mg of RGD peptide into the solution. The mixture was then allowed to react under magnetic stirring at 4 °C for 8 h. After the reaction, the solution was transferred to a dialysis bag with a molecular weight cut-off of 3500 Da and dialyzed in an ice bath for 3 days to remove unbound peptides. The final product, named PFP@RGD-LNBs, was obtained and stored at 4 °C.
A measured quantity of 100 μL of PFP@LNBs or PFP@RGD-LNBs solution was mixed with miR-199a at different N/P ratios. The mixtures were incubated at room temperature for 15 min to obtain the gene-loaded ultrasound-responsive liposome NBs, PFP@miR-LNBs or PFP@miR-RGD-LNBs.
Characterizations of LNBs
The morphological characteristics of the prepared PFP@miR-LNBs or PFP@miR-RGD-LNBs were investigated using a transmission electron microscope (TEM) (H-800, Hitachi, Japan). The size and zeta potential of the prepared LNPs were determined using dynamic light scattering with a Zetasizer Nano-ZS 90 from Malvern Instruments (UK). The gene-loaded PFP@miR-LNBs and PFP@miR-RGD-LNBs were separately stored in PBS at 4 °C, and the changes in particle size over 7 days were measured to evaluate their solution stability.
PFP encapsulation efficiency
The total PFP encapsulation efficiency (EE) was measured using the emulsion disruption method. Methanol (0.5 ml) was mixed with the prepared PFP@LNBs (0.1 ml) and agitated thoroughly to disrupt the nano-bubble structure, thereby releasing the encapsulated PFP. The resulting solution was centrifuged at 3000 rpm for 3 min at 4 °C. The lower layer (PFP) was collected and weighted.
The density of PFP at 25 °C is 1.62 g/mL. The EE of PFP was calculated using the following equation:
miRNA condensation assay
The condensing ability of Lipid Nanoparticles (LNPs) for miR-199a was investigated using agarose gel electrophoresis. First, PFP@RGD-LNBs were mixed with miR-199a at different mass ratios (i.e. 0, 5, 10, 20, 30, 40, 50 and 60) to obtain a series of PFP@miR-RGD-LNPs samples. The prepared LNBs (7.5 μL) were mixed evenly with Tris-Acetate-EDTA (Tris-TAE) buffer (2.5 μL) (pH 8.0). The mixture (12 μL per well) was loaded onto a 3% agarose gel. The gel was electrophoresed at 110 V for 25 min using Tris-TAE buffer (pH8) as the medium. After electrophoresis, the gel was stained for 30 min in a 0.5 μg/mL ethidium bromide (EtBr) solution, and images were captured at 365 nm using a gel imaging system, with the data recorded.
RNase protection assay
Ribonuclease (RNase) protection assay was conducted with the prepared PFP@miR-RGD-LNBs and miR-199a samples. Each group contained an equal amount of miR-199a. There were four experimental groups in total, in which two samples were incubated with RNaseA enzyme (0.5% w/w) at 37 °C for 1 h. The specific experimental groups were as follows: (a) PFP@miR-RGD-LNBs + RNase; (b) PFP@miR-RGD-LNBs; (c) miR-199a-3p; (d) miR-199a-3p + RNase. From each experimental group, 10 μL of the solution was added to a 3% agarose gel. The gel was electrophoresed at 110 V for 25 min, and after the electrophoresis, the gel was stained for 30 min in a 0.5 μg/mL EtBr solution. The images were captured at 365 nm using a gel imaging system, with the data recorded.
Evaluation of gene EE and release capacity of miRNA in LNPs
The amount of miRNA encapsulated into the prepared LNPs (PFP@miR-LNBs) was measured using a nanophotometer (BioTek Instruments, Inc., USA). Briefly, an aliquot of the preparation was thoroughly dissolved in methanol (1:50, w/w) and then subjected to centrifugation (15,000 rpm, 30 min). The supernatant was collected and analyzed at 260 nm using the nanophotometer. The amount of miRNA loaded into the LNPs was expressed as miRNA EE% using following equation:
The in vitro release kinetics of miRNA from the prepared LNBs under different low-intensity focused ultrasound (LIFU) treatment were evaluated using a dialysis membrane bag (MWCO 3500 kDa, Sigma, USA) and the nanophotometer. Briefly, 0.5 ml of PFP@miR-RGD-LNBs (0.1 mg/mL) was dissolved in 4.5 ml of PBS buffer (pH 7.4), placed in the dialysis bag. The dialysis bag was immersed in a beaker containing 50 ml of PBS (pH 7.4). The samples were placed on a thermostatic shaker (100 rpm, 37 °C). Before dialysis, the sample groups were subjected to LIFU treatment (SP100 sonoporator, Sonidel Ltd, USA) at various power levels of 0, 0.8, 1.6 and 2.4 W/cm2, with a frequency of 1 MHz and a duty cycle of 50% for 60 s. At different time intervals, 1 ml of the external solution outside the dialysis bag was collected, and an equal volume of PBS was added. The amount of the released miRNA in the samples was measured using the nanophotometer.
LIFU-mediated gene transfection in vitro
The pGFP vector, encoding the green fluorescent protein (GFP), was employed for visualizing gene transfection in the study. HepG2 cells were seeded in 24-well plates at a density of 1 × 10⁵ cells per well and incubated for 24 h at 37 °C under a 5% CO2 atmosphere. Transfection complexes (i.e. consisting of PFP@pGFP-LNBs or PFP@pGFP-RGD-LNBs) were introduced to the cell groups at a mass ratio of WLNBs: WpDNA = 8:1, with the DNA content being 2 µg/well. The HepG2 cells were subsequently subjected to ultrasound treatment. The in vitro LIFU settings were power levels of 0, 0.8, 1.6, or 2.4 W/cm2, with a frequency of 1 MHz and a 50% duty cycle for 60 s. Post-ultrasound treatment, the cells were incubated for an additional 4 h at 37 °C in a humidified atmosphere containing 5% CO2. The incubation medium was then replaced with fresh medium containing 10% FBS. After 48 h of further cultivation, GFP expression in the cells was investigated using a fluorescence microscope (Hitachi F-7000, Hitachi, Japan). Preliminary screening of the optimal gene transfection parameters for LIFU was conducted for application in subsequent experiments.
HepG2 cells were seeded at a density of 3 × 10⁵ cells/well in six-well plates and incubated for 24 h at 37 °C under a 5% CO2 atmosphere. The targeted transfection complexes (PFP@miR-RGD-LNBs) were introduced to the cells at various LNBs-to-miRNA mass ratios, including 8:1, 10:1, 12:1, and 16:1. HepG2 cells were then subjected to ultrasound treatment, with in vitro LIFU settings of 1.6 W/cm2 power levels, a 1 MHz frequency and a 50% duty cycle for 60 s. Following ultrasound treatment, the cells were incubated for an additional 4 h at 37 °C in a humidified atmosphere containing 5% CO2. The medium was subsequently replaced with fresh medium containing 10% FBS. After 48 h of further cultivation, RNA was extracted from the HepG2 cells using the TRIzol reagent (Invitrogen, USA). The total RNA was reverse-transcribed into cDNA using the PrimeScript RT Reagent Kit (Takara Bio, Japan), followed by quantitative real-time polymerase chain reaction analysis.
Evaluation of ultrasound imaging performance of PFP@miR-RGD-LNBs
Solutions with different concentrations of PFP@miR-RGD-LNBs were prepared and individually placed into 2% agarose gel modules. The ultrasound system probe was evenly coated with coupling gel and positioned perpendicular to the side of the module, ensuring no air bubbles were present between the module and the ultrasound probe. Ultrasound imaging was recorded for each sample group using ultrasound contrast mode.
Cell viability and apoptosis assays
The cytotoxicity of PFP@miR-RGD-LNBs on normal liver cell line (L02 cells), fibroblast cell line (L929 cells) and hepatic cell line (HepG2 cells) were assessed using the CCK-8 assay. L02 cells were used to test the biocompatibility of normal cells, and HepG2 cells were used to evaluate the inhibitory effect of miRNA-199-3p on liver cancer cells. The cells were incubated in 96-well plates at a density of 1 × 10⁴ cells per well at 37 °C. After 24 h, cells were treated with different concentrations of PFP@miR-RGD-LNBs solutions (i.e. 10, 25, 50, 100 and 200 μg/mL) at 37 °C. For PFP@miR-RGD-LNBs + LIFU groups, after 2 h co-culture, the selected wells were subject to ultrasound for 60 s using an SP100 sonoporator with a frequency of 1 MHz, an ultrasound power density of 1.6 W/cm2 and a duty cycle of 50% (pulse frequency equal to 100 Hz). After 24 or 48 h incubation, CCK-8 solution was then added to each well, and the cells were incubated for an additional 2 h at 37 °C. The absorbance of each sample well at 450 nm was measured using a microplate reader (Molecular Devices, USA). The PBS-treated group served as a blank control. All measurements were performed in triplicate. Cell viability was calculated using the following equation:
Cellular apoptosis was assessed using FITC-Annexin V and propidium iodide staining followed by flow cytometry analysis. HepG2 cells were seeded in a 24-well plate at a density of 1 × 10⁴ cells per well and allowed to incubate for 24 h. Subsequently, they were co-incubated with samples divided into four groups: control, miRNA, PFP@miR-RGD-LNBs + LIFU and PFP@miR-RGD-LNBs. For the LIFU-treated group, the power was set at 1.6 W/cm2, and the irradiation lasted for 1 min. After LIFU exposure, the cells continued incubating for another 24 h before the staining procedure was performed.
Quantitative real-time polymerase chain reaction analysis
The gene expression levels of miR-199a-3p, Caspase-3, Caspase-9, Bax and Bad in HepG2 cells co-cultured with the prepared LNBs for 48 h were assessed using quantitative reverse transcription-polymerase chain reaction (qRT-PCR). Primer sequences for PCR amplification are listed in , provided by RIBOBIO Co. Ltd (Guangzhou, China). All experiments were performed in triplicate.
Table 1. Primers for qRT-PCR.
Western plot assay
Proteins were extracted as per the manufacturer’s instructions. These proteins were then separated using 10% SDS-PAGE and subsequently transferred onto a polyvinylidene difluoride membrane. To block non-specific protein binding, the membrane was incubated in 5.0% non-fat milk dissolved in 1× Tris-Buffered Saline (TBS). Following this, the membrane was incubated at room temperature for 1 h with primary antibodies against Bad, Bax, Caspase-9 and Caspase-3. The membrane was then incubated for 2 h with the appropriate species-specific horseradish peroxidase-conjugated secondary antibody at a dilution of 1:2000. Protein bands were detected and normalized to GAPDH bands as per the manufacturer’s recommendations. All blots were quantitatively analyzed using ImageJ software.
Statistical analysis
In this study, SPSS 20.0 software (IBM Corp., NY, USA) was used for conducting statistical analysis. The significance threshold was set at a p-value of less than 0.05 (p < 0.05, *), which indicated statistical significance. A p-value of less than 0.01 (p < 0.01, **) was considered highly significant. All measurements were performed in triplicate, and the results were reported as the mean ± standard deviation.
Results and discussion
Preparation and characterization of LNBs
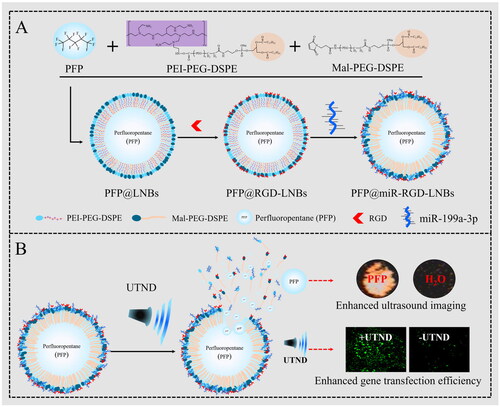
In this study, a highly efficient tumour-targeted ultrasound-responsive LNBs system was developed for the targeted delivery and release of miRNAs. First, DSPE-PEG-COOH was grafted onto PEI to obtain positively charged liposomes (DSPE-PEG-PEI). The DSPE-PEG-PEI was combined with DSPE-PEG2000-Mal, allowing the introduction of maleimide functional groups on the LNBs surface and simultaneously encapsulating PFP within the LNBs. Subsequently, the RGD (Arginine–Glycine–Aspartate) peptide was covalently linked to the LNBs surface via the maleimide functional groups. The primary role of RGD in these LNBs is to target HCCs. RGD possesses a unique affinity for αvβ3 integrin due to its specific structure and charge distribution. The arginine and aspartate residues in RGD establish salt bridges with the αvβ3 integrin. Concurrently, the compact structure of glycine grants the peptide an optimal conformation for precise binding [Citation29]. This makes RGD particularly specific for αvβ3 integrin, an integrin known to be overexpressed in tumour cells [Citation30,Citation31]. Our prior work has also confirmed the efficacy of RGD peptide in guiding carrier targeting specifically to HepG2 cells [Citation28]. MiRNA-199a-3p was loaded onto LNBs by electrostatic adsorption to form PFP@miR-RGD-LNBs. Zeta potential analysis results () showed that the zeta potential of PFP@RGD-LNBs was 36.2 ± 0.4 mV, while that of PFP@miR-RGD-LNBs was 21.6 ± 0.9 mV. Changes in zeta potential indicated the successful preparation of gene-loaded LNBs. TEM observations () showed that both PFP@miR-RGD-LNBs and PFP@miR-LNBs were spherical with similar morphological characters. The average particle size of PFP@RGD-LNBs was 168.2 nm ± 10.2 nm with a polydispersity index (PDI) of 0.21 ± 0.019 (). The average particle size of PFP@miR-RGD-LNBs was 175.1 ± 2.8 nm, with a PDI of 0.29 ± 0.168 (). These results indicated that these prepared LNBs had a relatively narrow size distribution. Additionally, the prepared ultrasound-responsive LNBs contained the sonosensitizer PFP, which could undergo phase changes upon ultrasound stimulation, releasing the miRNA loaded onto the LNBs. Experimental results showed that the EE of PFP in the prepared LNBs was approximately 78.3 ± 0.2%, and the EE of miRNA in the prepared LNBs was approximately 88.6 ± 0.6%. To evaluate the stability of the LNBs, the two groups of prepared LNBs (i.e. PFP@miR-LNBs and PFP@miR-RGD-LNBs) were stored in PBS and measured the particle size changes over 7 days at 4 °C. The results demonstrated that the particle size of PFP@miR-LNBs and PFP@miR-RGD-LNBs increased by 8.2% and 6.8%, respectively, within 7 days at 4 °C (). The zeta potential of these two LNBs solution remained relatively constant (). These findings suggested that the prepared gene-loaded LNBs exhibited excellent stability and hold potential for future applications. The size and stability of nanoparticles play a crucial role in their therapeutic effects. Due to the enhanced permeability and retention effect, nanoparticles within the range of 40–400 nm are more likely to accumulate in tumour tissues, thereby improving the targeted delivery of therapeutic drugs [Citation32]. Furthermore, stable nanoparticles are essential for maintaining their structural integrity, preventing premature release of their payloads, and ensuring effective delivery to target cells. The observed size and stability of the prepared LNBs in this study may contribute to enhancing their therapeutic effects against HCC.
Figure 1. Characterization of the prepared LNBs: (A) TEM image of PFP@miR-LNBs, scale bar 200 nm; (B) TEM image of PFP@miR-RGD-LNBs, scale bar 200 nm; (C) size distribution of PFP@miR-LNBs; (D) size distribution of PFP@miR-RGD-LNBs; (E) size of the prepared LNBs complex changed with time (n = 7 days) when stored at 4 °C; (F) zeta potential of the prepared LNBs complex changed with time (n = 7 days).
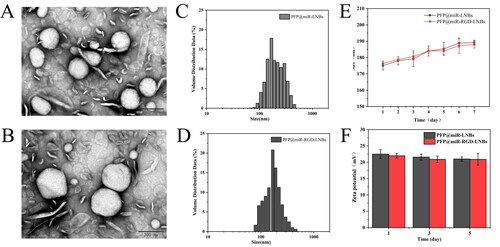
Table 2. Zeta potential of the prepared LNBs.
Evaluation of LNPs for miRNA EE, protective capability and UTND-mediated miRNA release
The ability of LNBs to condense miR-199a was investigated using agarose gel electrophoresis. As shown in , no fluorescent bands were observed at the gel lane endpoint when the mass ratio of LNBs to miRNA exceeded 6. Moreover, when the mass ratio of LNBs to miRNA was >6, the fluorescence remained in the loading well. This result suggested that PFP@miR-RGD-LNBs could completely condense miR-199a when the mass ratio was ≥8. To further confirm the protective effect of PFP@miR-RGD-LNBs on miR-199a, a gene protection assay was designed in the presence of RNase. As shown in , under normal electrophoresis conditions, miR-199a exhibited a fluorescent band at the gel lane endpoint. However, when miR-199a was combined with RNaseA, it underwent degradation, leading to the absence of fluorescent bands at the gel lane endpoint. This observation confirmed that miR-199a was indeed degraded by RNase. In contrast, when ultrasound-responsive LNBs adsorbed miR-199a and RNaseA was present simultaneously, fluorescence was observed only in the loading well and not at the gel lane endpoint. This observation indicated that miR-199a remained intact and was not degraded by RNase, thereby demonstrating the protective effect of the prepared LNBs on miR-199a. These findings highlight the potential of PFP@miR-RGD-LNBs as an effective delivery system for gene therapy. The ability of these LNBs to protect miRNA cargo from enzymatic degradation is important for ensuring successful delivery and achieving therapeutic outcomes. Moreover, the effective encapsulation of miR-199a and the demonstrated protection against RNase degradation add to the overall potential of PFP@miR-RGD-LNBs as a valuable gene therapy tool. The ability to safeguard miRNA cargo from enzymatic degradation is essential for ensuring successful delivery and achieving therapeutic outcomes, making PFP@miR-RGD-LNBs an attractive candidate for further investigation in the field of targeted gene therapy.
Figure 2. Agarose gel electrophoresis assay. (A) Evaluation of miRNA condensation ability of LNBs using agarose gel retardation experiment: LNBs and miRNA were mixed at various mass ratios, including 0, 2:1, 4:1, 6:1, 8:1, 10:1, 12:1, and 14:1. (B) Assessment of RNase protection capability of LNBs, using electrophoretic mobility analysis of LNBs complexes following RNaseA enzyme digestion.
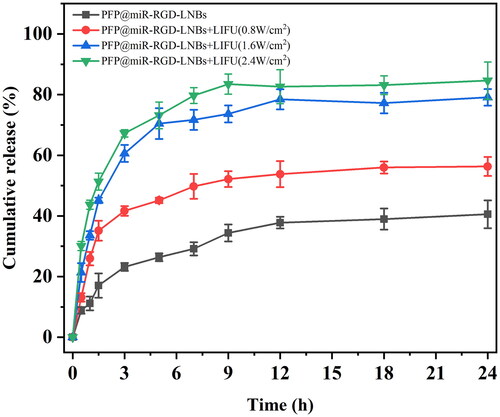
The UTMD technology is characterized by its non-invasive, safe, effective and controllable features and is widely regarded as a promising method for targeted drug or gene delivery. In this study, low-intensity focused ultrasound (LIFU) was used as an ultrasound trigger to rupture gene-loaded LNBs, allowing targeted release of miR-199a within tumour tissues while minimizing potential adverse effects on healthy tissues. Under the influence of various LIFU power levels, the miR-199a release profiles of PFP@miR-RGD-LNBs were evaluated (). As the LIFU power increased, the release rate of miR-199a from the prepared gene-loaded LNBs accelerated, and the total amount of miR-199a released was higher. LIFU power levels were set at 0, 0.8, 1.6 and 2.4 W/cm2 with an exposure time of 60 s. The corresponding drug release percentages within 24 h were 40.56 ± 4.60%, 56.32 ± 3.10%, 79.11 ± 2.75% and 84.61 ± 6.17%. A thorough examination of the release profiles at different power levels, including the control group without LIFU exposure, revealed the effectiveness of various LIFU power levels. Within the first 5 h, LIFU-treated samples released 73.17 ± 4.40% (2.4 W/cm2) and 70.44 ± 5.10% (1.6 W/cm2) of miR-199a, while the control group without LIFU exposure released only 26.38 ± 1.3% miR-199a. The miRNA release amount at 1.6 W/cm2 was approximately 2.67 times higher, and at 2.4 W/cm2, it was approximately 2.77 times higher, when compared to the control group. These findings suggested that LIFU at power levels of 1.6 and 2.4 W/cm2 could effectively disrupt gene-loaded LNBs, facilitating rapid and efficient gene release at target sites.
Figure 3. In vitro release profiles of miRNA from PFP@miR-RGD-LNBs with or without the promotion of LIFU (output power of 0.8, 1.6 or 2.4 W/cm2, 1 MHz, duty cycle of 50% and an exposure time of 60 s) at 37 °C, pH 7.4.
LIFU-mediated gene transfection in vitro
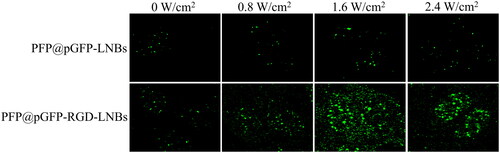
LIFU has emerged as a promising non-invasive biophysical approach for gene transfection, utilizing low-energy ultrasound waves to create bubbles on cell membranes, thereby temporarily increasing permeability and facilitating the internalization of external gene carriers. The plasmid encoding green fluorescent protein (pGFP) serves as a suitable target gene for evaluating the transfection efficiency of prepared LNBs. This is due to the fact that pGFP expression leads to the synthesis of GFP, a protein that emits green fluorescence upon exposure to ultraviolet light. As shown in , in the absence of LIFU treatment, the PFP@pGFP-RGD-LNBs group displayed a greater amount of green fluorescence than the PFP@pGFP-LNBs group, likely due to increased cellular uptake of LNBs facilitated by RGD targeting [Citation28]. Furthermore, in the PFP@pGFP-RGD-LNBs group, the highest green fluorescence intensity was observed at LIFU power of 1.6 W/cm2, followed by 2.4, 0.8, and 0 W/cm2. This indicates that a LIFU power of 1.6 W/cm2 is optimal for achieving the most efficient transfection, as the maximum green fluorescence generally signifies successful gene delivery and expression.
Figure 4. LIFU-mediated gene transfection in vitro. The LIFU were set at different power levels of 0, 0.8, 1.6 or 2.4 W/cm2, with a frequency of 1 MHz and a 50% duty cycle for 60 s. After 48 h of further incubation, GFP expression in the cells was investigated using a fluorescence microscope.
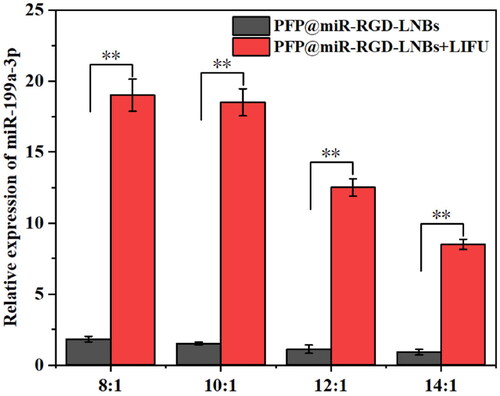
The expression levels of miR-199a-3p in HepG2 cells under different conditions were assessed using qRT-PCR. As shown in , the PFP@miR-RGD-LNBs group exhibited a decrease in miRNA expression as the proportion of miRNAs in LNBs decreased in the absence of LIFU treatment. The relative expression levels of miRNA-199a-3p were found to be 1.83 ± 0.26, 1.52 ± 0.16, 1.12 ± 0.32 and 0.91 ± 0.23 when the mass ratio of LNBs to miRNA was 8:1, 10:1, 12:1 and 14:1, respectively. Under LIFU treatment, the PFP@miR-RGD-LNBs + LIFU groups showed a similar trend but significantly higher expression levels when compared to the non-LIFU groups. The relative expression levels of miRNA-199a-3p were determined to be 19.32 ± 1.23, 18.56 ± 1.81, 12.53 ± 0.63, and 8.52 ± 0.36 when the mass ratio of LNBs to miRNA was 8:1, 10:1, 12:1, and 14:1, respectively.]. The HepG2 cell group showed approximately 10-fold higher expression levels of miRNAs under LIFU mediated than the non-LIFU groups. This observation could be attributed to the enhanced LIFU-mediated release of therapeutic agents from LNBs (). In addition, the cavitation of LIFU can temporarily increase cell membrane permeability, facilitate the entry of released genes and promote mRNA expression. After analysing , the optimal LIFU operating parameter settings were set to 1.6 W/cm2 power level, 1 MHz frequency, and 50% duty cycle for 60 s. A mass ratio of LNBs to miRNA of 8:1 for LNBs was determined to be an appropriate ratio for subsequent cell experiments.
Figure 5. Relative expression levels of miR-199a-3p in HepG2 cells measured by qRT-PCR. The cells were treated with a series of gene-loaded LNBs, where LNBs-to-miRNA mass ratios were set at 8:1, 10:1, 12:1 and 16:1. Subsequently, the cells underwent LIFU treatment at 1.6 W/cm2 power levels, a 1 MHz frequency and a 50% duty cycle for 60 s.
In vitro ultrasound imaging performance of PFP@miR-RGD-LNBs
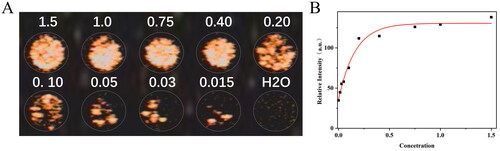
To evaluate the prepared LNBs’ ultrasound imaging performance, the experimental samples were set to contain PFP concentrations of 1.5%, 1.0%, 0.75%, 0.40%, 0.20%, 0.10%, 0.05%, 0.03%, and 0.015%. As shown in , under the contrast-enhanced ultrasound (CEUS) mode, the enhancement of ultrasound imaging increased with the rise in sample concentration. Upon quantification of the CEUS signal intensities, was generated. The signal intensity did not display a strictly concentration-dependent trend; upon reaching a certain signal intensity, increasing the concentration did not lead to a significant enhancement of signal intensity. The experimental results indicated that the optimal imaging effect was achieved when the PFP concentration in the sample was not less than 0.4%.
Figure 6. Evaluation of ultrasound imaging performance of PFP@miR-RGD-LNBs. (A) Ultrasound images of LNBs at different PFP concentrations in vitro. (B) Quantitative analysis of ultrasound relative signal intensity at various PFP concentrations.
Biocompatibility assessment of prepared LNBs
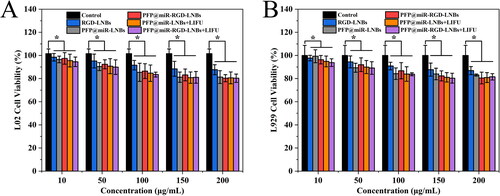
To evaluate the cytotoxicity of the prepared LNBs, L02 and L929 cells were selected as model cell lines for the study. These cells were co-cultured with different LNBs at various concentrations, and cell viability was determined after the co-incubation period. In addition, the cytotoxicity of PFP@miR-LNBs and PFP@miR-RGD-LNBs with or without LIFU treatment was also tested under the same conditions. The experimental findings demonstrated that the prepared LNBs exhibited low cytotoxicity and were well tolerated by both L02 () and L929 () cells. At a material concentration of 200 μg/mL, cell viability remained >80% for both cell lines. Furthermore, the prepared LNBs showed little toxicity to these two cell types, whether treated with LIFU or not. Under the set LIFU conditions, LNB had relatively low toxic effects on normal cells. This might be due to the fact that miRNA199a-3p tends to mainly function in HCC cells, regulating related pathways to inhibit the growth of cancer cells. These results suggested that the prepared LNB materials possess minimal cytotoxicity and exhibit favourable biocompatibility, making them suitable for further exploration in the context of gene delivery and therapeutics.
Figure 7. Cell viability of different cells treated with the prepared LNBs at various concentrations, as measured by the CCK-8 assay. (A) Viability of L02 cells treated with the prepared LNBs; (B) viability of L929 cells treated with the prepared LNBs. The LIFU treatment parameters were set at 1.6 W/cm2 power levels, 1 MHz frequency, and 50% duty cycle for 60 s.
LIFU-enhanced therapeutic effect of prepared LNPs on HepG2 cells
In order to investigate the combined therapeutic potential of PFP@miR-RGD-LNBs and LIFU on HCC cells, HepG2 cells were selected as the research model. The cells were co-cultured with various concentrations of LNBs, and the viability of HepG2 cells with or without LIFU irradiation was assessed (). After 24 h, the survival rates of HepG2 cells in both the PFP@miR-RGD-LNBs group and the PFP@miR-RGD-LNBs + LIFU group decreased as the concentration of therapeutic gene increased, indicating that these two groups had inhibitory effects on HepG2 cell proliferation. At an equivalent concentration of 50 nM miR-199a, the cell survival rates for the PFP@miR-RGD-LNBs group and the PFP@miR-RGD-LNBs + LIFU group were 56.56 ± 3.03% and 48.96 ± 1.64%, respectively. After 48 h, at an equivalent concentration of 50 nM miR-199a, the cell survival rates for the PFP@miR-RGD-LNBs group and the PFP@miR-RGD-LNBs + LIFU group were 46.36 ± 4.10% and 37.39 ± 0.98%, respectively. Reinforcing the observed trends in cell viability, apoptosis analysis () yielded similar outcomes. The rates of apoptosis across various groups were: 0.53% for the control group, 2.21% for the miR-199a group, 32.1% for the PFP@miR-RGD-LNBs group and a significant 51.8% for the PFP@miR-RGD-LNBs + LIFU group.
Figure 8. Evaluation of the anti-cancer effects of LNPs on HepG2 cells. CCK-8 assay results showing cell viability at 24 h (A) and 48 h (B) following LNBs treatments. (C) Flow cytometry analysis of apoptosis in HepG2 cells 24 h post treatment. LIFU parameters for the treated groups were set at 1.6 W/cm2 power levels, 1 MHz frequency, 50% duty cycle, with an exposure time of 60 s.
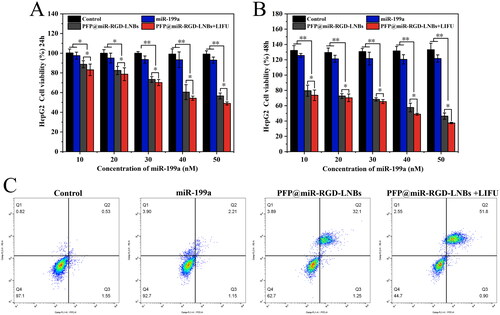
This enhanced inhibition observed in the PFP@miR-RGD-LNBs + LIFU group can be attributed to LIFU’s capability to promote increased endocytosis, subsequently enhancing the transfection efficiency of miR-199a. As a result, the therapeutic potential of PFP@miR-RGD-LNBs is magnified, leading to stronger inhibition of HCC cells. Moreover, the elevated survival rates, over 90%, in both the miR-199a and control groups suggest a possible degradation of miR-199a before it can effectively enter the cells. In summary, this study underscores that the combined use of PFP@miR-RGD-LNBs and LIFU exerts a pronounced inhibitory effect on HepG2 cells. Through optimizing miR-199a’s transfection efficiency, LIFU augments the therapeutic efficacy of this approach, indicating a promising direction for HCC treatment.
In HepG2 cells, the mRNA expression levels of key apoptosis markers, including Bad, Bax, Caspase-9 and Caspase-3, were assessed using qRT-PCR. Caspase-3 and Caspase-9 are two essential members of the caspase (cysteine–aspartic protease) protein family, which plays a critical role in the initiation and execution of apoptotic cell death. Bax and Bad belong to the Bcl-2 protein family and play crucial roles in the process of apoptosis. As pro-apoptotic proteins, Bax and Bad regulate mitochondrial outer membrane permeabilization and caspase cascade reactions by interacting with anti-apoptotic proteins, thereby modulating cell apoptosis. The qRT-PCR results demonstrated that, compared to the control group, both LIFU-treated and untreated LNBs significantly increased the mRNA expression levels of apoptosis-related markers (). Among these groups, the highest mRNA relative expression level was observed in the PFP@miR-RGD-LNBs + LIFU group, followed by the PFP@miR-RGD-LNBs group. This was attributed to the release of a higher amount of miR-199a-3p from LNBs and its subsequent uptake by the cells when LIFU was applied. Moreover, consistent with the qRT-PCR data, the Western Blot analysis () revealed a similar trend. The expression of apoptosis-related proteins was most prominent in the HepG2 cells treated with PFP@miR-RGD-LNBs under the mediation of LIFU.
Figure 9. Comparative expression of apoptosis markers in HepG2 cells after various treatments. Panels (A–D) represented the mRNA expression levels of Bad (A), Bax (B), Caspase-9 (C) and Caspase-3 (D). Panel (E) showed the Western Blot images reflecting the protein expression of these markers across different treatment groups: control, miR199a, PFP@miR-RGD-LNBs and PFP@miR-RGD-LNBs + LIFU. Cells were co-incubated with the specified LNBs formulations for 48 h, with some groups receiving LIFU treatment as designated.
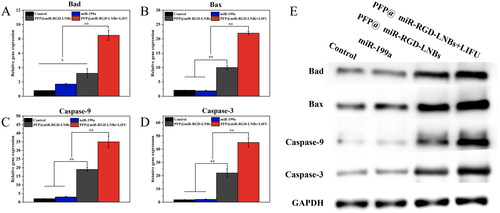
MiR-199a indirectly affects the activity of Caspase-3 and Caspase-9 by modulating the expression of various target genes, thereby participating in the regulation of cell apoptosis. For instance, a study has shown that in HCC cells, miR-199a can target and inhibit the mTOR signalling pathway, reducing Akt phosphorylation levels, and consequently affecting the phosphorylation status of Bad protein [Citation33]. Upon dephosphorylation of Bad, it interacts with Bcl-2 protein, releasing Bax, which in turn prompts the release of cytochrome c from mitochondria, activating Caspase-9 and Caspase-3, ultimately leading to cell apoptosis. Therefore, these results indicated that the combined application of PFP@miR-RGD-LNBs and LIFU enhanced the suppression of HCC cells by influencing the expression of apoptosis-related proteins, offering a novel therapeutic strategy for liver cancer treatment.
Conclusion
In this study, a highly efficient HCC-targeted ultrasound-responsive LNB system was developed for the targeted delivery and release of miRNA-199a-3p. The prepared LNBs were spherical, with a size of 175.1 ± 2.8 nm. The experimental results showed that the EE of PFP and miRNA in the prepared LNBs were approximately 78.3 ± 0.2% and 88.6 ± 0.6%, respectively. Agarose gel electrophoresis analysis demonstrated that PFP@miR-RGD-LNBs could fully condense miR-199a when the mass ratio was ≥8. LIFU at power levels of 1.6 and 2.4 W/cm2 effectively disrupted gene-loaded LNBs, promoting rapid and efficient gene release at the target site. Moreover, LIFU improved the transfection efficiency of miR-199a, enhancing the therapeutic effect. The optimal LIFU operating parameters were set at a power level of 1.6 W/cm2, a frequency of 1 MHz, and a 50% duty cycle for 60 s. The best ultrasound imaging performance was achieved when the PFP concentration in the sample was ≥0.4%. CCK8 assay results demonstrated that the prepared LNBs exhibited good biocompatibility. The combined application of PFP@miR-RGD-LNBs and LIFU showed stronger inhibitory effects on HepG2 cells compared to the non-LIFU-treatment group. qRT-PCR analysis revealed that, compared to the other groups, the mRNA expression levels of key apoptosis markers (including Bad, Bax, Caspase-9 and Caspase-3) were significantly increased in the PFP@miR-RGD-LNBs + LIFU group. The WB experiments validated this observation. The combined application of PFP@miR-RGD-LNBs and LIFU enhanced the inhibition of HCC cells by affecting the expression of apoptosis-related proteins. In conclusion, the prepared HCC-targeted ultrasound-responsive LNBs for miRNA-199a-3p delivery exhibited excellent biocompatibility and enhanced therapeutic efficacy in the treatment of HCC, highlighting its further exploration in gene delivery and therapy potential.
Author contributions
X.G.: conceptualization, formal analysis, investigation, writing – review and editing; J.L.: writing – original draft preparation, methodology, data curation and conceptualization; L.P.: writing – original draft preparation, data curation, conceptualization and investigation; K.H.: investigation and methodology; Z.H.: formal analysis and methodology; J.C.: validation and methodology; C.L.: formal analysis and resources; B.Z.: validation and resources; S.L.: data preparation and formal analysis; M.W.: data preparation and formal analysis. All authors have read and agreed to the published version of the manuscript.
Disclosure statement
No potential conflict of interest was reported by the author(s).
Data availability statement
The data that support the findings of this study are available from the corresponding author, X.G., upon reasonable request.
Additional information
Funding
References
- Redd Bowman KE, Lu P, Vander Mause ER, et al. Advances in delivery vectors for gene therapy in liver cancer. Ther Deliv. 2020;11(1):833–850. doi: 10.4155/tde-2019-0076.
- Hernandez-Alcoceba R, Sangro B, Prieto J. Gene therapy of liver cancer. World J Gastroenterol. 2006;12(38):6085–6097. doi: 10.3748/wjg.v12.i38.6085.
- Kamimura K, Yokoo T, Abe H, et al. Gene therapy for liver cancers: current status from basic to clinics. Cancers. 2019;11(12):1865. doi: 10.3390/cancers11121865.
- Bartel D. MicroRNAs: target recognition and regulatory functions. Cell. 2009;136(2):215–233. doi: 10.1016/j.cell.2009.01.002.
- Gu S, Chan W-Y. Flexible and versatile as a chameleon—sophisticated functions of microRNA-199a. Int J Mol Sci. 2012;13(7):8449–8466. doi: 10.3390/ijms13078449.
- Hou J, Lin L, Zhou W, et al. Identification of miRNomes in human liver and hepatocellular carcinoma reveals miR-199a/b-3p as therapeutic target for hepatocellular carcinoma. Cancer Cell. 2011;19(2):232–243. doi: 10.1016/j.ccr.2011.01.001.
- Chen B, Zhang D, Kuai J, et al. Upregulation of miR-199a/b contributes to cisplatin resistance via Wnt/β-catenin-ABCG2 signaling pathway in ALDHA1+ colorectal cancer stem cells. Tumour Biol. 2017;39(6):1010428317715155. doi: 10.1177/1010428317715155.
- Fan X, Zhou S, Zheng M, et al. MiR-199a-3p enhances breast cancer cell sensitivity to cisplatin by downregulating TFAM (TFAM). Biomed Pharmacother. 2017;88:507–514. doi: 10.1016/j.biopha.2017.01.058.
- Suzuki HI, Katsura A, Matsuyama H, et al. MicroRNA regulons in tumor microenvironment. Oncogene. 2015;34(24):3085–3094. doi: 10.1038/onc.2014.254.
- Paladini L, Fabris L, Bottai G, et al. Targeting microRNAs as key modulators of tumor immune response. J Exp Clin Cancer Res. 2016;35:1–19.
- Li Z, Zhou Y, Zhang L, et al. microRNA-199a-3p inhibits hepatic apoptosis and hepatocarcinogenesis by targeting PDCD4. Oncogenesis. 2020;9(10):95. doi: 10.1038/s41389-020-00282-y.
- Callegari E, Guerriero P, Bassi C, et al. miR-199a-3p increases the anti-tumor activity of palbociclib in liver cancer models. Mol Ther Nucleic Acids. 2022;29:538–549. doi: 10.1016/j.omtn.2022.07.015.
- Chen Z-Y, Yang F, Lin Y, et al. New development and application of ultrasound targeted microbubble destruction in gene therapy and drug delivery. Curr Gene Ther. 2013;13(4):250–274. doi: 10.2174/15665232113139990003.
- Mayer CR, Geis NA, Katus HA, et al. Ultrasound targeted microbubble destruction for drug and gene delivery. Expert Opin Drug Deliv. 2008;5(10):1121–1138. doi: 10.1517/17425247.5.10.1121.
- Carson AR, McTiernan CF, Lavery L, et al. Gene therapy of carcinoma using ultrasound-targeted microbubble destruction. Ultrasound Med Biol. 2011;37(3):393–402. doi: 10.1016/j.ultrasmedbio.2010.11.011.
- Shin Low S, Nong Lim C, Yew M, et al. Recent ultrasound advancements for the manipulation of nanobiomaterials and nanoformulations for drug delivery. Ultrason Sonochem. 2021;80:105805. doi: 10.1016/j.ultsonch.2021.105805.
- Aw MS, Paniwnyk L, Losic D. The progressive role of acoustic cavitation for non-invasive therapies, contrast imaging and blood-tumor permeability enhancement. Expert Opin Drug Deliv. 2016;13(10):1383–1396. doi: 10.1080/17425247.2016.1192123.
- Juffermans LJM, Dijkmans PA, Musters RJP, et al. Transient permeabilization of cell membranes by ultrasound-exposed microbubbles is related to formation of hydrogen peroxide. Am J Physiol Heart Circ Physiol. 2006;291(4):H1595–H1601. doi: 10.1152/ajpheart.01120.2005.
- Chen S, Ding J-h, Bekeredjian R, et al. Efficient gene delivery to pancreatic islets with ultrasonic microbubble destruction technology. Proc Natl Acad Sci U S A. 2006;103(22):8469–8474. doi: 10.1073/pnas.0602921103.
- Li H, Zhang Y, Shu H, et al. Highlights in ultrasound-targeted microbubble destruction-mediated gene/drug delivery strategy for treatment of malignancies. Int J Pharm. 2022;613:121412. doi: 10.1016/j.ijpharm.2021.121412.
- Hernot S, Klibanov A. Microbubbles in ultrasound-triggered drug and gene delivery. Adv Drug Deliv Rev. 2008;60(10):1153–1166. doi: 10.1016/j.addr.2008.03.005.
- Luk BT, Zhang L. Current advances in polymer-based nanotheranostics for cancer treatment and diagnosis. ACS Appl Mater Interfaces. 2014;6(24):21859–21873.
- Li HL, Zheng XZ, Wang HP, et al. Ultrasound-targeted microbubble destruction enhances AAV-mediated gene transfection in human RPE cells in vitro and rat retina in vivo. Gene Ther. 2009;16(9):1146–1153. doi: 10.1038/gt.2009.84.
- Deng Q, Chen J-L, Zhou Q, et al. Ultrasound microbubbles combined with the NFκB binding motif increase transfection efficiency by enhancing the cytoplasmic and nuclear import of plasmid DNA. Mol Med Rep. 2013;8(5):1439–1445. doi: 10.3892/mmr.2013.1672.
- Schutt EG, Klein DH, Mattrey RM, et al. Injectable microbubbles as contrast agents for diagnostic ultrasound imaging: the key role of perfluorochemicals. Angew Chem Int Ed Engl. 2003;42(28):3218–3235. doi: 10.1002/anie.200200550.
- Rix A, Curaj A, Liehn E, et al. Ultrasound microbubbles for diagnosis and treatment of cardiovascular diseases. Semin Thromb Hemost. 2020;46(5):545–552. doi: 10.1055/s-0039-1688492.
- Amate M, Goldgewicht J, Sellamuthu B, et al. The effect of ultrasound pulse length on microbubble cavitation induced antibody accumulation and distribution in a mouse model of breast cancer. Nanotheranostics. 2020;4(4):256–269. doi: 10.7150/ntno.46892.
- Guo X-M, Chen J-L, Zeng B-H, et al. Ultrasound-mediated delivery of RGD-conjugated nanobubbles loaded with fingolimod and superparamagnetic iron oxide nanoparticles: targeting hepatocellular carcinoma and enhancing magnetic resonance imaging. RSC Adv. 2020;10(64):39348–39358. doi: 10.1039/d0ra06415g.
- Plow EF, Haas TA, Zhang L, et al. Ligand binding to integrins. J Biol Chem. 2000;275(29):21785–21788. doi: 10.1074/jbc.R000003200.
- Asati S, Pandey V, Soni V. RGD peptide as a targeting moiety for theranostic purpose: an update study. Int J Pept Res Ther. 2019;25(1):49–65. doi: 10.1007/s10989-018-9728-3.
- Zitzmann S, Ehemann V, Schwab M. Arginine-glycine-aspartic acid (RGD)-peptide binds to both tumor and tumor-endothelial cells in vivo. Cancer Res. 2002;62(18):5139–5143.
- Subhan MA, Yalamarty SSK, Filipczak N, et al. Recent advances in tumor targeting via EPR effect for cancer treatment. J Pers Med. 2021;11(6):571.
- Wang Z, Ting Z, Li Y, et al. microRNA-199a is able to reverse cisplatin resistance in human ovarian cancer cells through the inhibition of mammalian target of rapamycin. Oncol Lett. 2013;6(3):789–794. doi: 10.3892/ol.2013.1448.