
 ?Mathematical formulae have been encoded as MathML and are displayed in this HTML version using MathJax in order to improve their display. Uncheck the box to turn MathJax off. This feature requires Javascript. Click on a formula to zoom.
ABSTRACT
The manufacturing factory layout planning process is commonly supported by the use of digital tools, enabling creation and testing of potential layouts before being realised in the real world. The process relies on engineers’ experience and inputs from several cross-disciplinary functions, meaning that it is subjective, iterative and prone to errors and delays. To address this issue, new tools and methods are needed to make the planning process more objective, efficient and able to consider multiple objectives simultaneously. This work suggests and demonstrates a simulation-based multi-objective optimisation approach that assists the generation and assessment of factory layout proposals, where objectives and constraints related to safety regulations, workers’ well-being and walking distance are considered simultaneously. The paper illustrates how layout planning for a logistics area can become a cross-disciplinary and transparent activity, while being automated to a higher degree, providing objective results to facilitate informed decision-making.
1. Introduction
Factory layouts are planned, designed, simulated and confirmed with the assistance of digital tools by which factory layouts are first realised in virtual environments before being built in the real world (Kuhn, Citation2006; Wang & Chatwin, Citation2005). Various software applications are frequently in use to create the cross-disciplinary content of manufacturing planning tasks in order to assess different aspects and questions from stakeholders (Mourtzis, Citation2020). The diverse IT landscape provides various capabilities, including all the planning activities used to enhance the product and production engineering processes (Shariat Zadeh et al., Citation2017). Simulation-driven production development is key and is applied with virtual models on all planning aspects and stages for manufacturing, e.g. processes, resources, factory layouts, capacity and ergonomics. The combined planning of all these activities is often referred to as the digital factory (Kuhn, Citation2006). The digital factory concept includes all the planning activities used to enhance the product and production engineering processes.
The different planning activities are related in the sense that a resulting output for one of the activities is often an input for another planning activity (Süße & Putz, Citation2021), e.g. the building model designed is a constraining input for the factory layout planning and limits the positioning of equipment. Often the planning activities respond to different questions and aspects of a project. Hence, the planning of a factory layout needs to consider several cross-disciplinary aspects and requirements from different stakeholders.
Frequently the information created in one virtual planning activity needs to be distributed to another planning activity manually, e.g. the engineer for one planning task needs to export the resulting content of the task and manually make sure that the required information is converted to readable content for other engineers and for other applications, since the diverse IT landscape generates and uses different file formats (Shariatzadeh et al., Citation2012). Hence, these activities are considered as isolated virtual planning activities, where the planning tasks are typically performed serially. This often leads to slow progress and problematic iterations in the planning process, in turn leading to the risk of late and suboptimised solutions (Lindskog et al., Citation2017).
This manual and serial approach is a cumbersome iterative process with a high risk of faulty inputs and updates since the information needed from cross-discipline tasks is also created based on experience and is manually distributed (Süße & Putz, Citation2021). At many companies, planning of factory layouts is linked to specific expert roles and is not considered objective in the sense that, when creating the factory layouts, the person planning the factory layout typically utilises his or her own experience and awareness of rules and regulations (Agyapong-Kodua et al., Citation2014). Due to this manual and largely subjective process of creating and verifying the requirements, there is a risk that regulations are neglected or misinterpreted, in turn causing the factory layout to fail to fully fulfil internal company guidelines or external rules and regulations.
The commonly defined state-of-art method described in the literature for the planning and design process of factory layouts is systematic layout planning (SLP) (Muther & Hales, Citation2015). However, the way the literature describes the SLP method, the planning and design activities of factory layouts are simplified. Frequently the approach relates to how to plan and optimize positions of rectangular or quadratic resources and equipment in top view, i.e. in a two dimensional (2D) environment; see, for example, Zuo et al. (Citation2014) and Wan et al. (Citation2022), often with the two objectives to minimize the area utilization and the distance between these rectangular shaped equipment. Thus, these approaches often overlook the integration of multiple objectives, and particularly objectives representing a range of different types of aspects, including aspects related to safety and worker well-being (Besbes et al., Citation2021).
In practice however, different types of equipment often have specific clearance requirements based on their components, functionalities and safety regulations (Zuo et al., Citation2014). However different parts of an equipment, for example electrical cabinets, hydraulic parts, operator panels or conveyors, may require different clearances around them, and not only in two dimensions. This suggests that a three dimensional (3D) environment needs to be accounted for in the factory layout planning process. In addition, when considering workers’ well-being in the factory layout planning process, it is imperative to also represent the height dimension since it influences the body postures that the workers assume during work, e.g. due to picking heights.
The shortcomings of the current way of planning factory layouts highlight a need to assist this process so that it can be performed more efficiently and objectively. This would mean challenging the current experience-based, manual and serial approach to plan factory layouts. We hypothesise that it would be advantageous to introduce enhanced digital support in the layout planning process, which would not only address traditional layout efficiency metrics but also emphasizes safety regulations and worker well-being, and integrate 3D simulations for a more comprehensive layout planning process.
Previous studies, such as Harari et al. (Citation2017) and (Citation2019), have explored multi-objective optimisations in 3D simulations for workstation design, highlighting the efficiency of genetic algorithms (GA). However, the application of GA in factory layout planning, particularly considering safety regulations, productivity and worker well-being, remains unexplored.
This work investigates and demonstrates the application of a simulation-based multi-objective optimisation method utilising GA in the context of factory layout planning. This method simultaneously considers safety regulations, worker well-being and worker walking distance. This is demonstrated with a use case in the context of planning the layout of a logistics area, where parts are loaded into fixtures, boxes and wagons to be sent forward to the assembly lines of production at a vehicle manufacturer.
2. Method
Two software tools were utilised to create and demonstrate the enhanced digital support for layout planning: Industrial Path Solutions (IPS) and Ergonomics in Production Platform (EPP). These two software tools have an established integration and can in this context be seen as one system. The IPS software is a math-based software tool used for simulations of virtual environments with capabilities such as rigid body path planning (Carlson, Citation2001), flexible components (soft material able to bend) (Hermansson et al., Citation2013), digital human modelling (DHM) with ergonomics simulations (Hanson et al., Citation2019), optimisation of robot and multi-robot stations (Hermansson et al., Citation2021) and surface treatment processes (Mark et al., Citation2014). IPS provides an application programming interface (API) for the LUA scripting language, an open-source lightweight scripting language (Ierusalimschy, Citation2006). The software system composed by IPS and EPP facilitates running simulation-based multi-objective optimisations with requirements, variables, objectives, and optimisation algorithms. Genetic algorithm (GA) was used as optimisation technique to search for solutions. This choice was based on experiences from previous studies that have investigated simulation-based multi-objective optimisation of productivity and worker well-being, where GA was found to be the most effective (Harari et al., Citation2019). In this case the non-dominated sorting genetic algorithm-II (NSGA-II) evolutionary algorithm for multi-objective optimisation was utilised (Deb et al., Citation2002). The NSGA-II algorithm was chosen due to its efficiency in maintaining a diverse population of solutions, fostering exploration of the solution space and preventing premature convergence on suboptimal solutions (Deb et al., Citation2002). This characteristic is particularly useful in computationally expensive problems, where exploring a wide range of potential solutions is necessary to find the best solutions for the defined objectives of the multi-objective optimisation problem. The NSGA-II algorithm employs non-dominated sorting to identify the best solutions within the investigated search space, thereby presenting a Pareto front composed of solutions that are not dominated by any other solutions (Deb et al., Citation2002).
2.1. Setting up the optimisation case
shows the simulation and optimisation framework followed to create and demonstrate enhanced digital support for layout planning (Iriondo Pascual et al., Citation2021).
Figure 1. Simulation and optimisation framework (Iriondo Pascual et al., Citation2021).
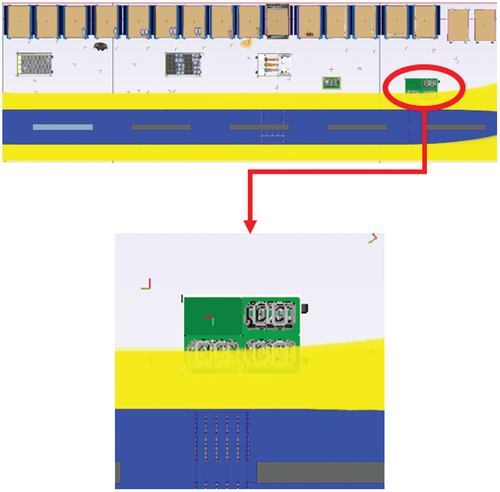
Following the framework, the first step is Problem definition (). The problem was defined as a multi-disciplinary issue, where the task was to optimise the layout of an existing logistics area currently in use in production (). The optimisation should consider distances for the workers to walk and the musculoskeletal risk scores, separately for the two logistics area workers, i.e. a tugger train driver and a logistics kitting worker picking parts from the material façade (tables with boxes and racks with shelves and pallets on various heights) onto the wagons and fixtures to be loaded on the train.
Figure 2. Current original solution of the logistics area represented by green box (left), zoomed in (right).
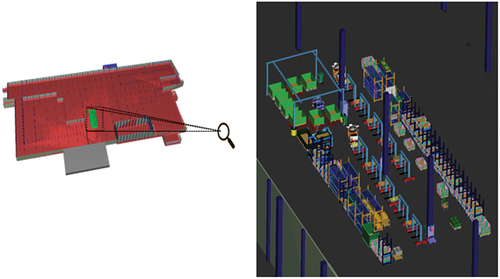
For the Requirements specification (), in total three staff members (experts and layout engineers) were interviewed (semi-structured interviews) at the Scania site Oskarshamn, Sweden, to clarify the details of the requirements specification. These experts and layout engineers are responsible for the planning of the logistics area used as test case for the demonstrator. The interviewees verified that the planning process of factory layouts is a multi-objective optimisation problem. The planning staff wanted to test if multi-objective optimisation could be utilised in the factory layout planning process, hence the logistics area was selected as suitable for the study. Through the discussions, the requirements were specified by defining the process steps of a kitting sequence. This kitting sequence delineates the order of the tasks carried out to refill the train with the two workers involved, i.e. the tugger train driver and the logistics kitting worker kitting the wagons with parts. Since the demonstrator deals with an existing logistics area (in this work referred to as the original solution) and adjacent production areas, the scope was also restricted so that the volume used by the current logistics area or potential found solutions could not exceed the current volume claims. This means the equipment needs to be positioned within the green box in .
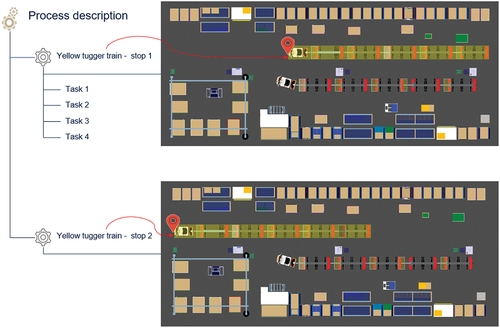
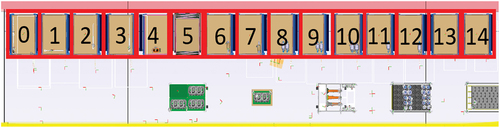
This sets a constraint of keeping all layout proposals spatially within the same volume as the current logistics area and original solution (). For the demonstrator, the optimisation setup was limited to the tasks of the tugger train driver and the tasks of the logistics kitting worker for the yellow train stop 1 () and not the complete logistics area. For this part of the logistics area, there are 15 racks containing shelves with pallets and parts (shelves with height adjustability) and additionally four wagons and one table with fixtures, boxes and parts, all of which are considered rearrangeable from a layout perspective, as long as they are kept within the allowed area of the factory (). This constitutes the material façade from where the logistics kitting worker first collects parts and loads the wagons, then later these wagons are collected and loaded by the tugger train driver onto the train during the yellow train stop 1. Another constraint was defined to only allow solutions where in-house guidelines for the tugger train’s safety distance were considered. The safety distance value required, states a free space between the tugger train and surroundings of a minimum of 600 mm.
Figure 3. Train stops 1 and 2 for the yellow tugger train at the logistics area, top view.
The third step of the framework, Data collection (), included the collection of datasets for the demonstrator, where geometrical representations of the products, parts, building and intended resources were retrieved to describe the current logistics area setup, i.e. the original solution. The building information, designed with AutoCAD Architecture software, and the virtual descriptions of the equipment, designed with Dassault software Catia V5, were exported and converted for IPS import. Hence, the virtual environment imported to the DHM module Intelligently moving manikins (IMMA) in IPS consists of a building model and individual models of equipment and resources spatially positioned in relation to the building’s point of origin, representing the CAD environment ().
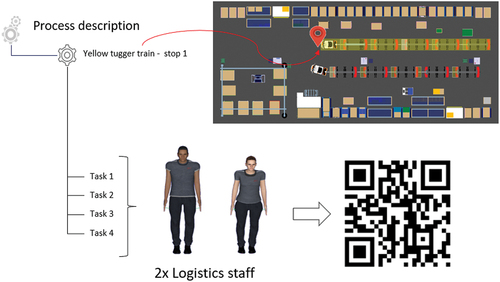
The fourth step, Model creation in DHM tool (), consisted of defining the process description (the kitting sequence). Two digital Human models () (also referred to as Manikins) were added to the simulation scene to represent the two workers handling the logistics area. A female manikin with a stature of 1,674 mm and a body weight of 65 kg, representing the 50th percentile of the female Swedish population (Hanson et al., Citation2009), was used to simulate the logistics kitting worker, and a male manikin with a stature of 1 792 mm and a body weight of 78 kg, representing the 50th percentile of the male Swedish population (Hanson et al., Citation2009), was used to simulate the tugger train driver.
The tasks of the tugger train driver and those of the logistics kitting worker for the yellow train stop 1 () were represented in the DHM tool by two Action sequences (), one for each manikin and their respective tasks.
The kitting sequence and manikins were added to an operation sequence description in IPS. The simulation of the original solution, with its sequence of tasks, is presented with an online animation at https://vimeo.com/687109728 and can also be reached via the QR code in .
Figure 4. Work sequence for the yellow train’s first stop, see QR code for video.
To verify that the safety distance constraints for the tugger train are considered when planning the logistics area, a LUA script was developed to generate geometrical constraints of the safety distance around the train ().
Figure 5. Generation of safety distance reservation for the tugger train.
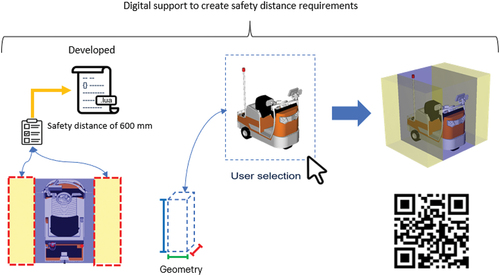
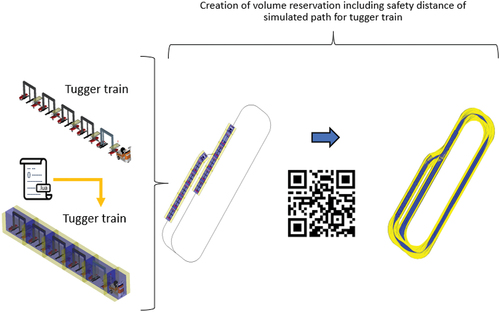
The script uses the selected geometries to generate the safety distance around the selected geometry (). The script execution is showcased with an online animation at https://vimeo.com/668223928 and can also be reached via the QR code in . From the simulated tugger train’s movement, one can add the safety distance and generate a sweep volume; this is simulated and presented with an online animation at https://vimeo.com/668233686 and can also be reached via the QR code in .
Figure 6. Volume reservation of safety distance of the tugger train path.
The safety distance sweep volume was then considered as a fixed object in the optimisation, representing a volume where the equipment and resources should not be positioned. This feature also enabled evaluating the current logistics area setup (the original solution), where it was noted that it did not fulfil the safety distance requirements of the tugger train path ().
Figure 7. The original solution not fulfilling the safety distance requirements of the tugger train path.
The next process step, Optimisation definition (), consisted of defining Optimisation variables, Optimisation constraints and Optimisation objectives.
The Optimisation variables were defined in EPP by selecting the objects in the simulation scene that can have alternating spatial positions. The movement range values that the optimisation algorithm could use were defined as variable constraints. The optimisation algorithm treats the positioning of each object in the simulation scene independently. Therefore, if not governed, most of the solutions offered by the algorithm would be non-valid due to collisions. However, in this use case, 15 logistics racks, representing a part of the material façade, have to be positioned without colliding with each other.
In order to avoid collisions, the positioning of the racks was redefined as a combinatory problem, with 15 positions {0, 1, 2.14} defined, and the algorithm chose the permutation for each solution ().
Figure 8. Fifteen permutations for the racks.
A decision tree was defined in EPP to allow the algorithm to choose a permutation. A node defined the direction for each level of the decision tree. To obtain a permutation of n elements, n-1 nodes needed to be defined. The last element was the remaining element in the set. In this case, 14 nodes were required to locate 15 racks. The range of values for each node was the total number of elements n minus the level of decision i minus one: n-i-1. The algorithm provided a value for each of the 14 nodes with the ranges {[0–14],[0–13].[0–1]}, creating a permutation of 15 elements when the algorithm provided the 14 values. An example of this approach for three elements and two nodes is shown in .
Figure 9. Example of all permutations for three elements defined by node sets n.
The number of possible permutations of the racks was defined by the permutation of the 15 elements without repetition, i.e. .
The remaining objects of the material façade, the four wagons and the table, could be positioned in seven locations. The same permutation approach was used for the seven locations; however, only the first five levels of the decision tree were generated since only five elements (four wagons and one table) needed to be located. Therefore, the number of possible permutations was ()
5!
2,520. The positioning of the racks, wagons and table led to a combinatory problem of
possible permutations without collision.
In addition to spatial positioning of the racks, the height position of the shelves in the racks could vary and was considered a variable. The height of the lower shelves was defined between the allowed heights of 70 – 277 mm from the floor. The top shelves could be positioned between 485 and 900 mm from the floor. These allowed heights were defined to avoid collisions with the floor and in between shelves of the same rack. Each shelf was added as a real variable, i.e. a variable that can take real number values. As previously mentioned, the optimisation variables had variable constraints, meaning that defining additional Optimisation constraints was not needed in this case.
Then the Optimisation objectives () were defined in EPP by selecting the manikins and other elements in the model of the simulation scene and selecting the type of objectives. One set of objectives for the logistics area was defined so as to minimise the spaghetti diagrams (Gladysz et al., Citation2018), i.e. minimise the walking distance for the logistics kitting worker (DWKT) and the walking distance for the tugger train driver (DWTT). Then with each solution, the walking distance (DWKT and DWTT) for the respective manikin was calculated based on the start and end positions of the parts in the kitting sequence and then summarised to the total walking distance per individual worker.
Further objectives were defined to minimise the musculoskeletal load for the workers in the logistics area, i.e. to strive to find ergonomic layout solutions that provide physical well-being for the workers. For this objective, the ergonomics evaluation method Ovako Working posture Assessment System (OWAS) (Karhu et al., Citation1977) was used in combination with the Lundqvist Index (Lundqvist, Citation1988). The OWAS method provides the assessment of aggregated biomechanical load based on four subgroups (back, arms, legs, lifted weight). OWAS classifies the actual aggregated biomechanical load according to four action categories (AC) (Mattila et al., Citation1993):
AC1 – Work postures are considered usually with no particular harmful effect on the musculoskeletal system. No actions are needed to change work postures.
AC2 – Work postures have some harmful effect on the musculoskeletal system. Light stress, no immediate action is necessary, but changes should be considered in future planning.
AC3 – Work postures have a distinctly harmful effect on the musculoskeletal system. The working methods involved should be changed as soon as possible.
AC4 – Work postures with an extremely harmful effect on the musculoskeletal system. Immediate solutions should be found to change these postures.
However, this classification in OWAS is only done for instances in time. Therefore OWAS was combined with the Lundqvist Index, which facilitates the assessment of aggregated biomechanical load over time (Lundqvist, Citation1988). Having a method that facilitates the assessment of worker well-being over time was essential in this case since the simulations in IPS IMMA represent human work carried out over time (Hanson et al., Citation2019). The Lundqvist Index spans from the minimum value of 100 (meaning 100% of time in AC1) to the maximum value of 400 (meaning 100% of time in AC4). Since the OWAS Lundqvist Index (OWASLI) facilitates assessment of aggregated biomechanical load over time, a lower index indicates better design solutions in regard to the worker well-being objective, and a higher index mean greater exposure to potential risks of work-related musculoskeletal disorders (WMSDs). The Lundqvist Index factor L was classified based on Höldrich (Citation2011) ().
Table 1. Lundqvist Index factor with classification according to Höldrich (Citation2011).
As a last step for the Optimisation definition (), the optimisation algorithm was configured for the use case, later to be used in the Optimisation method step ().In order to utilize the NSGA-II algorithm, population size, child population size, tournament size, crossover probability and mutation probability are common operators that need to be set in order to generate new offspring solutions from existing solutions of the population (Deb et al., Citation2002). The output from simulations in IPS IMMA is deterministic, and the NSGA-II algorithm evolves in every new generation of settings for the next simulation, iteratively assessing and improving the simulation output results until it reaches a convergence point. Several initial runs of a simplified model of the simulation were carried out to find a fitting configuration of the operators. The final configuration of the optimisation algorithm operators are given in . The same configuration was used for the complete model. The start population used by the NSGA II algorithm was generated with random seed.
Table 2. Configuration of the optimisation algorithm operators.
With the optimisation definition and the model creation in the DHM tool, the software system composed by IPS and EPP performs optimisations in accordance with the simulation and optimisation framework (). The Simulation method was defined in the DHM tool and used the simulation method ‘Human movement prediction in kinematic simulations using optimisation-based approach’ according to the classification in Wolf et al. (Citation2020). After that, a Simulation was run in the DHM tool, and when the simulation was finished, the values of the objectives were calculated and retrieved following the Extraction of simulation data and Assessment of targets (optimisation objectives in this case) (). Then the optimisation algorithm collected the information from the DHM tool and evaluated with the Optimisation method whether the Optimisation finished condition was met or not. If not, the optimisation algorithm continued and provided new values as input with the process step Modification of optimisation variables. In this phase, each offspring solution’s Optimisation variables were sequentially sent to the DHM tool’s model. This required an automated reconfiguration of the DHM tool’s CAD environment before performing simulation runs of each tested solution. First, the resources constituting the layout setup were repositioned in regards of proposed Optimisation variables, followed by recalculating the path planning of the shelves, repositioning the Human models footing positions and updating the Action sequence. Then with an updated CAD environment, the simulation run was triggered to retrieve the corresponding objective values for the sent solutions’ Optimisation variables. This was then performed sequentially for each proposed solution of an offspring. Subsequently, this update iteratively triggered the execution of the Simulation, for each updated Model creation within the DHM tool of each solution. This was followed by the Extraction of simulation data, Assessment of targets and further Modification of optimisation variables () continuing into iterations of the NSGA-II algorithm.
Once the optimisation was finished, i.e. when a convergence in the optimisation objectives values had been achieved, the next process step was Presentation of results in decision support tool (). This was done by running a fast non-dominated sorting algorithm, filtering out dominated solutions and generating charts and a table with all Pareto front solutions. The remaining steps in the simulation and optimisation framework () relate to how desired solutions are finally selected, typically involving human decision making. These steps are not part of the work covered in this paper.
3. Results
Convergence was reached after 1 680 investigated solutions generated by using the NSGA-II algorithm. All solutions generated fulfilled the safety distance requirement of the path of the tugger train. While convergence of the results was achieved, there is no guarantee the real Pareto front has been achieved due to the non-polynomial hard complexity of the optimisation problem. All 1 680 solutions were subjected to the fast non-dominated sorting process; in this process, solutions that are not dominated by any other solutions are identified and assigned a rank of 1 (Deb et al., Citation2002). These non-dominated solutions collectively form what is known as the Pareto front and represents the set of best trade-off solutions among the ranked solutions (Deb et al., Citation2002). The Pareto front was formed by the non-dominated solutions out of all 1 680 solutions considering the walking distance for each worker (DWKT and DWTT) and the OWAS Lundqvist Index optimisation objectives (OWASLIKT and OWASLITT, respectively for the two workers). It was observed that the OWAS Lundqvist Index for the tugger train driver (OWASLITT) was kept at index 100 for all solution alternatives generated by the algorithm, i.e. having the same value as the original solution. An index of 100 is the lowest possible value, corresponding to the assessment ‘very little irksome’ (). This meant that, for this specific multi-objective optimisation and conditions setup, three objectives remained to be considered instead of four.
3D plots of the values of all 1 680 solutions for the three objectives are shown in , where the solutions forming the Pareto front are highlighted by surfaces.
Figure 10. 3D plot (view 1) of the objectives OWASLIKT, DWKT and DWTT.
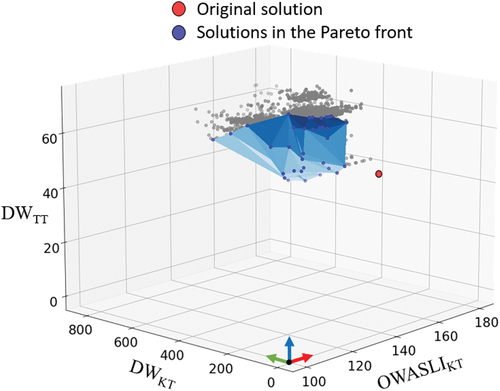
Figure 11. 3D plot (view 2) of the objectives OWASLIKT, DWKT and DWTT.
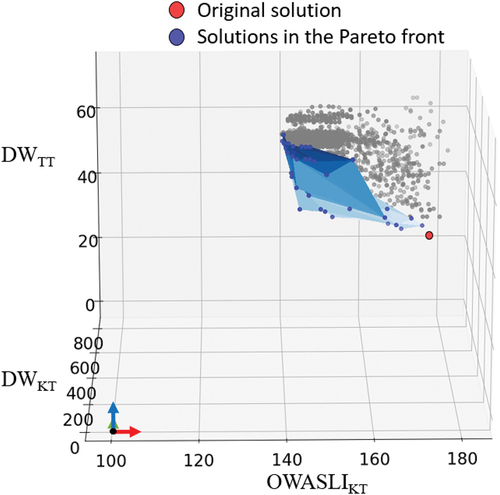
From the optimisation results, there were 34 solutions defining the Pareto front. These solutions, represented by their specific solution numbers, are presented and compared with the values of the original solution in .
Table 3. Values of the three objectives for the solutions in the pareto front, compared with values of the original solution.
It is worth noticing that all solutions in the Pareto front, except one, have a lower score of OWASLIKT index than the original solution, indicating that those solutions would be more successful in ensuring worker well-being for the logistics kitting staff. There are 16 solutions in the Pareto front that either have lower DWKT or DWTT than the original solution, but no solutions in the Pareto front that have both DWKT and DWTT simultaneously better than the original solution. Based on the objectives, the original solution could be considered part of the Pareto front. However, it is worth reiterating that the original solution does not comply with the rules and regulations associated with the path of the tugger train (). In contrast, all solutions generated by the optimisation approach fulfilled the rules and regulations.
All solutions listed in the Pareto front are considered to be the best found solutions searched by the NSGA-II algorithm. Given the non-polynomial hard complexity nature of the optimisation problem, achieving globally optimal solutions is challenging. This means that each solution in the Pareto front represents the best solutions out of the investigated solutions regarding the optimisation objectives while fulfilling the constraints defined. Hence, the findings in present possible solutions to proceed with further analyses, in order to better investigate and understand the consequence of the layout proposals and then take informed decisions based on objective values.
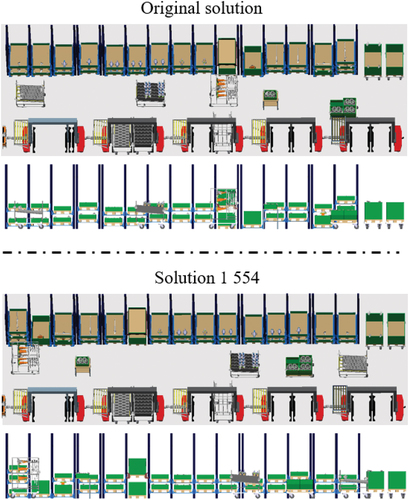
The optimisation considered the constraints of the logistics area and produced specific values for the defined objectives, but it also allowed to load each solution in IPS for visual inspection. This means that decisions can be based on both comparing objective values between the solutions and visually comparing the differences between the layout proposals. In , solution 1 554, one of the solutions in the Pareto front, is compared with the original solution. The values of each objective are given in . Solution 1 554 keeps OWASLIKT within reasonable values, 140 (little irksome) rather than the original solutions OWASLIKT value of 174 (irksome). Further, solution 1 554 sets the DWKT to a slightly reduced walking distance compared to the original solution (9.5 meters less), although increasing the DWTT (25 meters more). It is worth repeating that solution 1 554 complies with the rules and regulations for the path of the tugger train while the original solution fails to do so.
Figure 12. The original solution (top) compared with solution 1 554 (below).
4. Discussion
Planning factory layouts is an activity that influences, and is influenced by, a wide range of other activities carried out in manufacturing planning, e.g. in regard to processes, resources, capacity and ergonomics. These different planning activities are typically related, where an output from one planning activity is an input to another planning activity. This means that the different planning activities do not consider all issues simultaneously, in turn easily leading to slow processes and risks of suboptimised outcomes. The demonstrator solution of an enhanced digital support presented in this paper illustrates how layout planning can become a cross-disciplinary and transparent activity, where the multi-objective optimisation approach has the potential to facilitate objective support for the decision-making process of layouts and the ability to display values behind each proposed layout solution.
From a production research and development perspective, the characteristics of the enhanced digital support are in line with two focus areas in Industry 4.0: simulation and automation (Nahavandi, Citation2019), i.e. utilising advantages of simulation and combining simulation with an automated optimisation approach to trigger the generation of potential layout solutions and have them evaluated in an automated manner.
4.1. Consideration of results
The results are promising in that the multi-objective optimisation approach, handling several variables, constraints, parameters and objectives simultaneously, provided feasible solutions when applied to the use case. The multi-objective optimisation approach proposed several solutions in an automated manner and presented the results, both in terms of values and simulations, facilitating numerical and visual assessment of the proposed solutions. This helps a development team (e.g. consisting of production engineers, logistics engineers and ergonomists) to make informed decisions on solutions that balance conflicting objectives in a good way. This ability to objectively evaluate and compare different design proposals is believed to encourage improvements and assist design decisions to account for why a solution is to be implemented or when there is a need to find better design solutions. This multi-objective approach aligns with the description of needs to solve suboptimal processes in Lindskog et al. (Citation2017). Overall, the multi-objective optimisation approach agrees with the general trend to automate processes and support digital work considering large datasets and smart solutions for decision making.
An additional finding shown by the demonstrator is the approach to provide digital support for the layout planner by facilitating guidance in the planning tool when creating volume reservations for safety distances around equipment and its paths. Using such support, rules and regulations are less likely to be violated as they were in the original solution in this use case. The scripts developed for this purpose are generalisable in the sense that they create safety distances based on user-selected geometries in the simulation scene, i.e. the scripts can be used for all kinds of geometrical representations to automatically create safety distances around a selected geometry and could be used in other use cases.
4.2. Consideration of method
With this demonstrator, the NSGA-II algorithm was utilised to run a multi-objective optimisation of a simulation model of a logistics area in a DHM tool software. Future studies could investigate and compare other potential algorithms to utilise when performing multi-objective optimisations for similar design problems, to compare results between algorithms and find the ones with better performance.
For the demonstrator and use case, the OWAS Lundqvist index was used as an evaluation method for the two workers’ well-being and allowed to evaluate aggregated biomechanical load over time of the entire action sequence defined. However, there are other ergonomics evaluation methods available which also could be used in other cases depending on exposures to be assessed, which could also be investigated in future studies.
The OWAS Lundqvist indices together with calculating walking distance for respective worker per solution were used as system (layout) performance indicators. The walking distance by each worker influences the process time of the action sequence (with shorter walking distance, the process time decreases), but one could of course add other objectives to consider when running multi-objective optimisations of factory layouts.
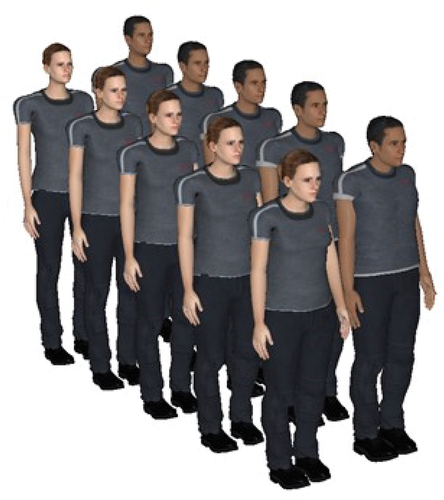
Another aspect is the consideration of anthropometric diversity among workers. For this use case, a male manikin and a female manikin, both representing the 50th percentile of the Swedish population respectively per gender, were used. This limits the ability of the simulations, and hence the solutions, to consider workers with other anthropometries. Potentially one could aim to represent a wider anthropometric diversity in future optimisation cases, including the representation of other nationalities. One approach to represent anthropometric diversity in simulations is to use a family of manikins, defined in a systematic way to represent the desired percentage of the targeted population () (Brolin et al., Citation2019). An example of applying a manikin family approach in the context of multi-objective optimisation is presented in Iriondo Pascual et al. (Citation2021), this as a step towards reaching the objective of Industry 5.0 in regard to more human-centric manufacturing systems in the future (Breque et al., Citation2021; Ivanov, Citation2023). In upcoming studies, this research aims to incorporate the consideration of diversity among workers in the context of factory layout planning.
Figure 13. Illustration of a manikin family to represent anthropometric diversity.
In addressing the challenges inherent in factory layout planning, our study suggests a significant shift from utilising traditional 2D methods to utilising a more complex 3D multi-objective optimisation framework. This transition to a 3D environment, e.g. necessitated by the evaluation of worker well-being and the comprehensive assessment of workers’ interactions within the logistics area, represents a pivotal aspect of the demonstrated enhanced digital support for layout planning.
A key distinction of the demonstrated approach lies in the integration of layout problem optimisation variables that span across both the xy-plane and the z-direction, underscoring the 3D nature of the problem. This complexity is further amplified by the incorporation of four optimisation objectives, two for each worker, representing the worker well-being and walking distance. Such a comprehensive approach is crucial for accurately evaluating critical factors like picking heights, which are central to worker well-being.
This shift to see the factory layout as a 3D optimisation problem is not just a dimensional change; it represents a fundamental enhancement in how to address the multifaceted nature of manufacturing environments. Traditional 2D optimisation methods, while effective in simpler scenarios, fall short in capturing the intricacies of real-world factory settings where three-dimensional space utilisation and human factors play a significant role (Besbes et al., Citation2021). However, the complexity scales with the number of dimensions, making evaluations of each solution more computationally expensive than other meta-model based optimisations or 2D simulation-based optimisations. The optimisation problem in this study needed 24 minutes per evaluation, corresponding to 28 days in total to be completed using a desktop computer with a i7-9700K processor. Adding to the complexity, the DHM tool used to create the demonstrator, as is the case for most DHM tools, lack native support to perform optimisations of productivity and worker well-being. Hence, tailor made solutions to facilitate the integration of optimisation algorithms were required. This lack of native support is believed to be a reason for the small number of published studies of simulation-based multi-objective optimisations of productivity and worker well-being.
The approach presented in this paper is not only aligned with the evolving trends of Industry 4.0 (Nahavandi, Citation2019), but also with the broader goals of sustainable, human-centric and resilient manufacturing practices in Industry 5.0 (Ivanov, Citation2023).
5. Conclusion
The planning of factory layouts is a common challenge, involving several cross-disciplinary experts and stakeholders; it sets the foundation of the potential of the workshop. With the current way of working, the result of the factory layout frequently depends on the communication between several cross-disciplinary experts, such as ergonomists and engineers, and their combined experience in the design and decisions regarding the factory layout.
This creates a call for tools and methods in the planning process of factory layouts that facilitate making informed decisions considering several objectives simultaneously. This paper demonstrates a solution of an enhanced digital support to utilise simulation-based multi-objective optimisation as a means to plan factory layouts. Providing such digital support in early planning phases of factory layouts is argued to provide risk mitigation, projects with less costly retrospective engineering and earlier project completion. The demonstrator illustrates a way of cross-disciplinary, transparent and collective planning of layouts, thereby facilitating better-informed decisions in the factory layout planning process.
Assisting and improving the factory layout planning process by the use of multi-objective optimisation would impact on individuals, organisations and on the society, potentially free up time and efforts in the design activities for engineers and enhance objectivity when evaluating layout proposals. With automated objective generation of solution proposals for factory layouts, reengineering and rebuilds should decrease meaning less impact on use of resources. This is a competitive advantage in the industry while also decreasing environmental impact. The research also supports that design solutions fulfil rules and regulations affecting the work environments for the company’s workers and their quality of life, hence supporting social sustainability. This aligns with Goal 8 and 9 in Agenda 2030, adopted by all United Nations Member States in 2015.
5.1. Future research
The continuation of this research is to investigate other factory layout cases, involving other manufacturing processes and challenges, such as assembly manufacturing where the product often is in motion when staff carries out the assembly tasks and mounts parts to the product in motion, with the intent to further improve and automate actions in the planning of virtual factory layouts.
This work utilized the NSGA-II algorithm in the context of simulation-based multi-objective optimisation to suggest and demonstrate an approach that assists the generation and assessment of factory layout proposals, highlighting the transformation of layout planning into a transparent and interdisciplinary activity. A significant aspect of our future research will focus on conducting a comparative analysis of different optimisation algorithms, particularly those suited for complex 3D environments like the one explored in this study. While the NSGA-II algorithm has proven effective for the current described case, exploring and benchmarking other algorithms in similar 3D multi-objective scenarios will deepen the understanding of relative efficiencies and effectiveness. Such comparative studies will provide valuable insights into algorithm performance in complex, real-world manufacturing settings and support the development of more robust and adaptable optimisation tools. In addition an important aspect for future research is to address the question of supporting the decision-makers in how to select the most suitable solution among generated solutions.
Acknowledgments
The authors appreciatively thank the support of Scania CV AB, the research school Smart Industry Sweden (20200044) and the research project Virtual Factories with Knowledge-Driven Optimisation (2018-0011) funded by the Knowledge Foundation via the University of Skövde. With this support the research was made possible.
Disclosure statement
No potential conflict of interest was reported by the author(s).
Additional information
Funding
References
- Agyapong-Kodua, K., Haraszkó, C., & Németh, I. (2014). Resource selection ontologies in support of a recipe-based factory design methodology. International Journal of Production Research, 52(21), 6235–24. https://doi.org/10.1080/00207543.2014.918287
- Besbes, M., Zolghadri, M., Costa Affonso, R., Masmoudi, F., & Haddar, M. (2021). 3D facility layout problem. Journal of Intelligent Manufacturing, 32(4), 1065–1090. https://doi.org/10.1007/s10845-020-01603-z
- Breque, M., De Nul, L., Petridis, A., & European Commission, Directorate-General for Research and Innovation. (2021). Industry 5.0: Towards a sustainable, human-centric and resilient European industry. https://doi.org/10.2777/308407
- Brolin, E., Högberg, D., Hanson, L., & Örtengren, R. (2019). Development and evaluation of an anthropometric module for digital human modelling systems. International Journal of Human Factors Modelling and Simulation, 7(1), 47–70. https://doi.org/10.1504/IJHFMS.2019.102178
- Carlson, J. S. (2001). Quadratic sensitivity analysis of fixtures and locating schemes for rigid parts. Journal of Manufacturing Science and Engineering, 123(3), 462–472. https://doi.org/10.1115/1.1365397
- Deb, K., Pratap, A., Agarwal, S., & Meyarivan, T. (2002). A fast and elitist multiobjective genetic algorithm: NSGA-II. IEEE Transactions on Evolutionary Computation, 6(2), 182–197. https://doi.org/10.1109/4235.996017
- Gladysz, B., Santarek, K., & Lysiak, C. (2018). Dynamic spaghetti diagrams. A case study of pilot RTLS implementation. In Intelligent systems in production engineering and maintenance – ISPEM 2017, 637:238–48. Advances in intelligent systems and computing. Springer International Publishing. https://doi.org/10.1007/978-3-319-64465-3_24
- Hanson, L., Högberg, D., Carlson, J. S., Delfs, N., Brolin, E., Mårdberg, P., Spensieri, D., Björkenstam, S., Nyström, J., & Ore, F. (2019). Industrial path solutions – Intelligently moving manikins. In S. Scataglini & G. Paul (Eds.), DHM and posturography (pp. 115–124). Elsevier.
- Hanson, L., Sperling, L., Gard, G., Ipsen, S., & Olivares Vergara, C. (2009). Swedish anthropometrics for product and workplace design. Applied Ergonomics, 40(4), 797–806. https://doi.org/10.1016/j.apergo.2008.08.007
- Harari, Y., Bechar, A., Raschke, U., & Riemer, R. (2017). Automated simulation-based workplace design that considers ergonomics and productivity. International Journal of Simulation Modelling, 16(1), 5–18. https://doi.org/10.2507/IJSIMM16(1)1.355
- Harari, Y., Bechar, A., & Riemer, R. (2019). Simulation-based optimization methodology for a manual material handling task design that maximizes productivity while considering ergonomic constraints. IEEE Transactions on Human-Machine Systems, 49(5), 440–448. https://doi.org/10.1109/THMS.2019.2900294
- Hermansson, T., Bohlin, R., Carlson, J. S., & Söderberg, R. (2013). Automatic assembly path planning for wiring harness installations. Journal of Manufacturing Systems, 32(3), 417–422. https://doi.org/10.1016/j.jmsy.2013.04.006
- Hermansson, T., Carlson, J. S., Linn, J., & Kressin, J. (2021). Quasi-static path optimization for industrial robots with dress packs. Robotics and Computer-Integrated Manufacturing, 68, 102055. https://doi.org/10.1016/j.rcim.2020.102055
- Höldrich, A. (2011). Work load examinations at the log wood production. Journal of Agricultural Machinery Science, 7(2), 133–136.
- Iriondo Pascual, A., Högberg, D., Lämkull, D., Luque, E. P., Syberfeldt, A., & Hanson, L. (2021). Optimization of productivity and worker well-being by using a multi-objective optimization framework. IISE Transactions on Occupational Ergonomics and Human Factors, 9(3–4), 142–153. https://doi.org/10.1080/24725838.2021.1997834
- Ivanov, D. (2023). The industry 5.0 framework: Viability-based integration of the resilience, sustainability, and human-centricity perspectives. International Journal of Production Research, 61(5), 1683–1695. https://doi.org/10.1080/00207543.2022.2118892
- Karhu, O., Kansi, P., & Kuorinka, I. (1977). Correcting working postures in industry: A practical method for analysis. Applied Ergonomics, 8(4), 199–201. https://doi.org/10.1016/0003-6870(77)90164-8
- Kuhn, W. (2006). Digital factory – Simulation enhancing the product and production engineering process. In Proceedings of the 2006 Winter Simulation Conference, Monterey, CA, USA (pp. 1899–1906). https://doi.org/10.1109/WSC.2006.322972.
- lerusalimschy, R. (2006). Programming in Lua (2nd ed.). Lua.org.
- Lindskog, E., Vallhagen, J., & Johansson, B. (2017). Production system redesign using realistic visualisation. International Journal of Production Research, 55(3), 858–869. https://doi.org/10.1080/00207543.2016.1218085
- Lundqvist, P. (1988). Working Environment in Farm Buildings – Results of Studies in Livestock Buildings and Greenhouses [ Thesis]. Sveriges Lantbruksuniversitet.
- Mark, A., Bohlin, R., Segerdahl, D., Edelvik, F., & Carlson, J. S. (2014). Optimisation of robotised sealing stations in paint shops by process simulation and automatic path planning. International Journal of Manufacturing Research, 9(1), 4–26. https://doi.org/10.1504/IJMR.2014.059597
- Mattila, M., Karwowski, W., & Vilkki, M. (1993). Analysis of working postures in hammering tasks on building construction sites using the computerized OWAS method. Applied Ergonomics, 24(6), 405–412. https://doi.org/10.1016/0003-6870(93)90172-6
- Mourtzis, D. (2020). Simulation in the design and operation of manufacturing systems: State of the art and new trends. International Journal of Production Research, 58(7), 1927–1949. https://doi.org/10.1080/00207543.2019.1636321
- Muther, R., & Hales, L. (2015). Systematic layout planning (4th ed.). Management & Industrial Research Publications.
- Nahavandi, S. (2019). Industry 5.0—A human-centric solution. Sustainability, 11(16), 4371. https://doi.org/10.3390/su11164371
- Shariat Zadeh, N., Lindberg, L., El-Khoury, J., & Sivard, G. (2017). Service oriented integration of distributed heterogeneous IT systems in production engineering using information standards and linked data. Modelling & Simulation in Engineering, 1, 1–23. https://doi.org/10.1155/2017/9814179
- Shariatzadeh, N., Sivard, G., & Chen, D. (2012). Software evaluation criteria for rapid factory layout planning, design and simulation. Procedia CIRP, 3, 299–304. https://doi.org/10.1016/j.procir.2012.07.052
- Süße, M., & Putz, M. (2021). Generative design in factory layout planning. Procedia CIRP, 99, 9–14. https://doi.org/10.1016/j.procir.2021.03.002
- Wang, Q., & Chatwin, C. R. (2005). Key issues and developments in modelling and simulation-based methodologies for manufacturing systems analysis, design and performance evaluation. The International Journal of Advanced Manufacturing Technology, 25(11–12), 1254–1265. https://doi.org/10.1007/s00170-003-1957-7
- Wan, X., Zuo, X., Li, X., & Zhao, X. (2022). A hybrid multiobjective GRASP for a multi-row facility layout problem with extra clearances. International Journal of Production Research, 60(3), 957–976. https://doi.org/10.1080/00207543.2020.1847342
- Wolf, A., Miehling, J., & Wartzack, S. (2020). Challenges in interaction modelling with digital human models – A systematic literature review of interaction modelling approaches. Ergonomics, 63(11), 1442–1458. https://doi.org/10.1080/00140139.2020.1786606
- Zuo, X., Murray, C. C., & Smith, A. E. (2014). Solving an extended double row layout problem using multiobjective tabu search and linear programming. IEEE Transactions on Automation Science and Engineering, 11(4), 1122–1132. https://doi.org/10.1109/TASE.2014.2304471