Abstract
Purpose
Vestibular system is critical for maintaining balance. This study aimed to determine the function of the saccule of the otolith organ in adults with type 1 diabetes (T1D) using cervical vestibular evoked myogenic potential (cVEMP) and its independently associated demographic, clinical and laboratory variables.
Method
This case-control cross-sectional study included 60 patients (male = 15; female = 45) and 30 healthy adults. They underwent cVEMP.
Results
Patients had mean age of 30.63 ± 4.20 years and duration of illness of 14.68 ± 3.65 years. More than 50% had frequent diabetic ketoacidosis (DKA), 30% had frequent hypoglycaemic attack, 35% had comorbid hyperlipidaemia, and 40% had peripheral neuropathy. Dizziness was reported in 30%. Compared to controls, 40% of patients had significantly delayed absolute latencies of P1 and N1 (p = 0.01) either unilateral or bilateral and 80% had reduced P1-N1 amplitudes (p = 0.001). Higher frequencies of abnormalities were present bilaterally. Asymmetry ratio (AR) was reported in 25%. Patients with longer duration of diabetes (>5 year), dizziness, HbA1c (>7%), frequent DKA or hypoglycaemic attacks and peripheral neuropathy had significantly prolonged P1 and N1 latencies and reduced P1-N1 amplitudes compared to those with shorter duration of diabetes, without dizziness, with HbA1c% ≤7%, low frequency of DKA hypoglycaemic attacks and those without peripheral neuropathy. Multiple regression analysis showed that presence of delayed P1 latencies and reduced P1-N1 amplitudes were significantly correlated with duration of diabetes > 5 years [OR = 3.60 (95%CI = 1.80–6.44), p = 0.01; OR = 4.56 (95%CI = 2.80–7.80), p = 0.01] and HbA1c levels >7% [OR = 5.26(95%CI = 3.83–8.05), p = 0.001; OR = 4.55(95%CI = 2.45–8.55), p = 0.001].
Conclusion
The dysfunctions of the saccule of otolith organ and/or its pathway are prevalent in adults with T1D and correlated with duration and severity of diabetes. Therefore, optimal control of glycemic control is essential.
Keywords:
Disclosure statement
No potential conflict of interest was reported by the author(s).
Figure 1. Results of serum levels of lipids and lipoproteins of the studied groups.
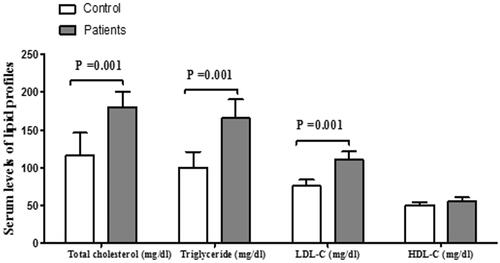
Figure 2. Results of cVEMP P1 and N1 latencies (A) and P1-N1 amplitudes (B) of the studied groups.
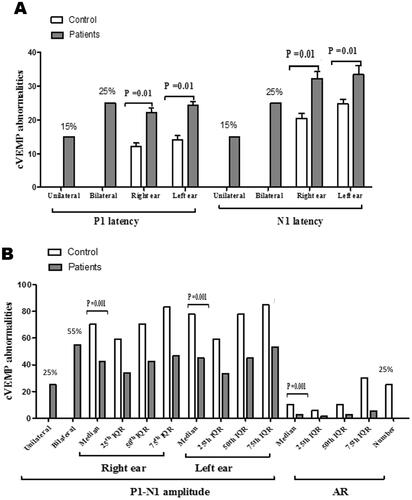
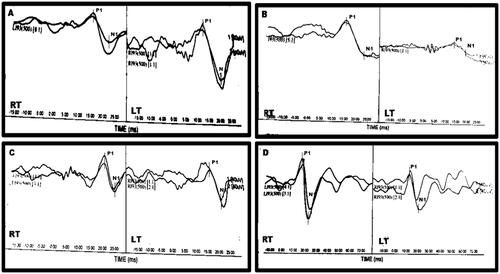
Figure 3. Representative cVEMP waveforms: (A) A patient with normal P1 (RT = 15.33 ms; LT = 15.08 ms) and N1 (RT = 21.75; ms; LT = 21.76 ms) latencies, reduced amplitude on the RT side (43.82 µV) and normal on the LT (92.51 µV). AR is 35.71%. (B) A patient with normal P1 (RT = 15.25 ms; LT = 14.67 ms) and N1 (RT = 20.67; ms; LT = 22.67 ms) latencies, reduced amplitude on the LT side (20.39 µV) and normal on the RT (90.73 µV). AR is 63.30%. (C) A patient with longer RT P1 (RT = 18.08 ms; LT = 13.00 ms) and RT N1 (RT = 24.25; ms; LT = 22.75 ms) latencies and normal amplitudes (RT: = 71.17 µV; LT = 69.95 µV). AR is 0.86%. (D) A healthy subject with normal P1 (RT = 14.00 ms; LT = 14.60 ms) and N1 (RT = 20.03 ms; LT = 22.33 ms) latencies and amplitudes (RT = 102.18 µV; LT = 84.11 µV). AR is 9.70%.