
 ?Mathematical formulae have been encoded as MathML and are displayed in this HTML version using MathJax in order to improve their display. Uncheck the box to turn MathJax off. This feature requires Javascript. Click on a formula to zoom.
ABSTRACT
Nd1−xPbxFeO3 (x = 0.1–0.3) solid solutions were prepared by aliovalent substitution of Pb2+ at the Nd3+ site using the conventional solid-state reaction route. The structural, magnetic and dielectric properties and hopping mechanism of these solid solutions are reported. XRD data shows that all the samples possessed orthorhombic crystal structures. No impurity phase was found, indicating that Pb2+ was well within its solid solubility limit. All samples exhibited magnetic ordering with the Mr value decreasing from 2.42 emu/g for the x = 0.1 sample to 1.79 emu/g for the x = 0.3 sample. The coexistence of the multi-valance state of the Fe ion was explored using XPS analysis. The dielectric constant (ε׳) and dielectric loss (ε״) were found to decrease with increases in the frequency of the applied electric field and to show Cole–Cole relaxation behavior. The temperature-dependent variation of exponent “n” (obtained from the Jonscher’s power law fitting) explains the conduction model that the system follows exactly.
1. Introduction
Rare earth orthoferrites with the general formula RFeO3 (where R is a rare earth ion) possessing distorted perovskite structures are important for various technologically applications, such as solid oxide fuel cells, sensors, photo catalysis and spintronics devices [Citation1–Citation6]. The competition of Fe–Fe, R–Fe and R–R interactions due to the simultaneous presence of R3+ and Fe3+ magnetic sub-lattices results in some interesting phenomena in these materials. NdFeO3 (NF) is an important orthoferrite that exhibits G-type antiferromagnetism (AFM) at room temperature (TN ~ 620–760 K). The AFM in NF is considered to be due to antiparallel coupling between two magnetic ions of the Fe3+ sub-lattice via oxygen ions [Citation7–Citation9]. The enhancement of its (AFM) magnetic properties is thus expected to make it useful for various other important technical applications, such as magneto-optical switches and memory storage devices [Citation10]. Partial substitution of rare earth cations with alkaline earth elements has been reported to have a significant effect on the structural and physical properties of ReFeO3 (Re – rare earth cation) [Citation11–Citation13]. Enhancement of the structural and magnetic properties of LaFeO3 by aliovalent substitution has been reported previously [Citation14]. Aliovalent substitution creates a charge imbalance that enhances various magnetic, dielectric and other physical properties. Li et al. reported modification of the magnetic properties by Ca2+ substitution in NdFeO3 [Citation15], but the effect of Pb2+ substitution on the structural and physical properties of NdFeO3 has not yet been reported.
In this paper, we report a systematic study of the effect of 10–30% Pb2+ substitution on the structural, morphological, magnetic and dielectric properties and hopping mechanism.
2. Experimental
Nd1−xPbxFeO3 (x = 0.1–0.3) solid solutions were synthesized using the conventional solid-state reaction route. The raw materials, Nd2O3, PbO and Fe2O3 (99.99% purity) obtained from Sigma Aldrich, were weighed in stoichiometric proportions and mixed using a mortar and pestle for one hour. The powder was then transferred to a bottle containing propanol and zirconia balls and ball-milled successively for 12 h in simple and planetary ball mills respectively. The mixed powder was then calcined at 1000°C for 12 h. The calcined powder was mixed with PVA binder (2 wt%). The mixed binder powder was then pressed to in the form of pellets 10 mm in diameter and ~1 mm thick. The pellets were then sintered at a temperature of 1200°C for 2 h in a lead environment to reduce the weight loss due to lead volatility in a closed crucible-type arrangement. XRD data for the sintered samples was collected from 10° to 120° at a step size of 0.02° and a scan speed of 2°/min using a Shimadzu (Maxima) diffractometer equipped with a Cu Kα (λ = 1.54 A°) anode. The surface morphology was investigated using an FE-SEM (Supra 55) from Carl Zeiss at the same magnification of 40 KX using an in-lens detector and an accelerating voltage of 10 kV. The density of the sintered pellets was measured using a lab-made setup based on the Archimedes principle. Magnetic measurements were conducted using a Vibrating Sample Magnetometer (VSM) EZ9 from Microscence. X-ray photoelectron spectra (XPS) were measured using an Omicron ESCA+ electron spectrometer equipped with a monochromatic Al Kα (1486.7 eV) from Oxford instruments of Germany. The room temperature dielectric properties and ac conductivity at various temperatures were examined using an impedance analyzer from KEYSIGHTS Technologies equipped with a high-temperature furnace.
3. Results
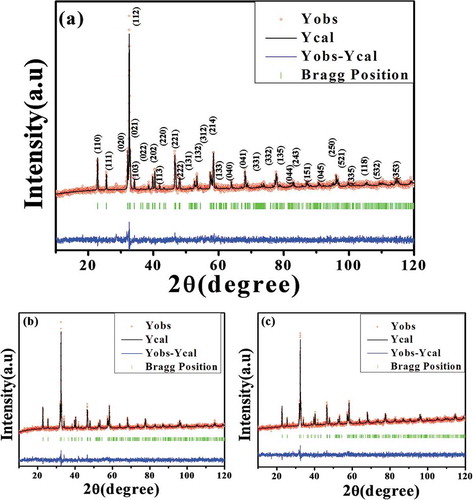
XRD diffractograms of Nd1−xPbxFeO3 (x = 0.1–0.3) samples are shown in . The sharp, high-intensity diffraction peaks reveal the crystalline nature of the samples. In order to confirm the crystal structure and hence retrieve structural information on these solid solutions, Rietveld refinement was carried out using FULL PROF suit software. The initial model and parameters for the orthorhombic space group P b n m (No. 62) were taken to be those reported by Kumar et al. [Citation14]. A Thompson Cox Hastings function with axial divergence symmetry was used to model the peak profiles. The background was fitted using a sixth order polynomial. The scale factor, zero displacement, lattice parameters, and atomic position coordinates x, y and z for Nd3+/Pb2+, OI and OII were taken as refinement parameters. The nice agreement between the observed and theoretical data (Rietveld refined) shows that the initial model was quite close to the actual model. No peaks are left unassigned, indicating that Pb2+ substitutes nicely in the NdFeO3 lattice up to x = 0.3 and is well within its solid solubility limits. The lattice parameters remain practically unchanged. The refined cell parameters are given in .
Table 1. The refined lattice parameters, R-factors, atomic positions of various atoms, and Biso of NdxPb1−xFeO3 where x = 0.1, 0.2 and 0.3 samples.
Figure 1. Observed (black solid line) and fitted (red circle) XRD data for (a) x = 0.1, (b) x = 0.2 and (c) x = 0.3 Nd1−xPbxFeO3 samples.
Scanning electron microscope (SEM) micrographs of samples Nd1–xPbxFeO3 (x = 0.1–0.3) are shown in . All the micrographs were recorded at the same magnification of 40KX using an in-lens detector. The images clearly reveal that the microstructure consists of very small, homogenous, randomly oriented, well-interlinked and non-uniform (in shape and size) grains. It is clear from the microstructure that there is a gradual decrease in average grain size from x = 0.1–0.3. The average grain size was measured as 0.84, 0.73 and 0.67 μm. The density of the samples was found to increase from 6.98 to 7.38 g/cm3, respectively, for x = 0.1 to x = 0.3. It is clear that with increasing the concentration of Pb2+, the compactness of the grains increases and that the density of the samples increases as a result. The values for grain size along with the standard deviation, experimental density, theoretical density and densification rate are given in .
Table 2. The experimental density (g/cm3), theoretical density (g/cm3), experimental density/theoretical density × 100 (%) and grain size (μm) of NdxPb1−xFeO3 where x = 0.1, 0.2 and 0.3 samples.
Figure 2. SEM micrographs of (a) x = 0.1, (b) x = 0.2 and (c) x = 0.3 Nd1−xPbxFeO3 samples.
Room temperature magnetization vs. magnetic field (M vs. H hysteresis loop) measurements for the Nd1–xPbxFeO3 (x = 0.1–0.3) samples are shown in . The magnetic data clearly reveal that (a) all the hysteresis loops are non-saturating in nature (even up to 1.5T); (b) all the samples exhibit finite coercivity; and (c) the remnent magnetization of the samples decreases from 2.42 emu/g for the x = 0.1 sample to 1.79 emu/g for the x = 0.3 sample, whereas coercivity also decreases continuously from 1684.43 Oe for the x = 0.1 sample to 611.83 Oe for the x = 0.3 sample. The above features of the hysteresis loops indicate that these samples are not purely ferromagnetic in nature. Since pure NF is a G-type antiferromagnetic material, the decreasing trend of remnent magnetization with the composition (x) can be explained on the basis of variations in the concentration of Fe3+ or Fe2+ ions or of competition between AFM and FM interactions. It has already been reported that sintering of orthoferrites at high temperatures under ambient oxygen pressure results in formation of oxygen vacancies which create multivalent Fe states [Citation14]. The charge imbalance (created by multivalent Fe states) is further enhanced due to aliovalent doping of Nd3+ by Pb2+. According to the Goodenough–Kanamori rule [Citation16], a strong negative super-exchange interaction between Fe3+ and Fe3+ through oxygen (O2−) anions results in antiferromagnetic ordering, whereas a direct exchange interaction between Fe3+/Fe3+ and Fe3+/Fe2+ through vacancies (Vᵒ) may result in ferromagnetic ordering. We believe that both these interactions are present in our samples. The presence of both these interactions results in non-saturating hysteresis loops along with finite coercivity. The concentration of Fe3+and Fe2+ ions depends on the concentration of oxygen vacancies and the extent of doping of Pb2+ at the Nd3+ site. As a result, the strength of these two interactions (AFM and FM) also varies. At low lead (Pb2+ ion) concentration (x = 0.1), FM interactions dominate with respect to AFM interactions, which results in the highest remnant magnetization (Mr). Beyond x = 0.1, AFM interactions start to dominate with respect to FM interactions, resulting in decreases in Mr with increases in the Pb2+ content. Thus it is clear from the data that 10% Pb2+ substitution in NF is an optimized concentration to achieve enhanced magnetic properties.
Figure 3. The plot of magnetization (emu/g) vs. magnetic field (Oe) at room temperature for (a) x = 0.1, (b) x = 0.2 and (c) x = 0.3 Nd1−xPbxFeO3 samples.
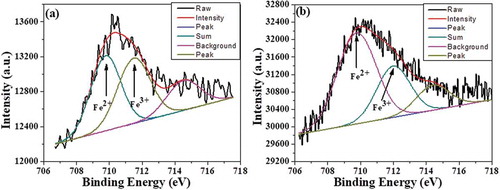
In order to confirm the coexistence of Fe2+ and Fe3+ ions and variations in their relative concentrations in our samples, X-ray photoelectron spectroscopy (XPS) measurements were carried out. Fe core level spectra of Nd1−xPbxFeO3 (x = 0.1 and 0.3) samples are shown in . The core level peaks are quite broad and show asymmetry towards the higher energy side, implying the presence of double peaks. Peak deconvolution was conducted using XPSPEAK 4.1 software assuming a Gaussian peak profile. The fitted data are also shown in . The fitting analysis shows that the Fe3+:Fe2+ ratio decreases from 2.01 to 1.05 as x varies from 0.1 to 0.3 (Mr also decreases up to x = 0.3). It has been proposed that oxygen may be released from the lattice during high-temperature sintering, leading to creation of oxygen vacancies as per the following reaction: O0≤> 1/2O2 + V¨0 + 2e´. The electrons released due to oxygen vacancies (V¨0) may be captured by Fe3+, which is then converted into Fe2+, resulting in an increase in the concentration of Fe2+ ions. Thus, it is clear that the Mr data in our samples are directly correlated with variations in the Fe3+:Fe2+ ratio. This type of behavior was also hypothesized in the room temperature magnetic explanation. Thus, the XPS data serve to confirm that hypothesis to same extent [Citation17–Citation20].
Figure 4. Fitted XPS data for Fe 2p core level spectra of (a) x = 0.1 and (b) x = 0.3 Nd1−xPbxFeO3 samples.
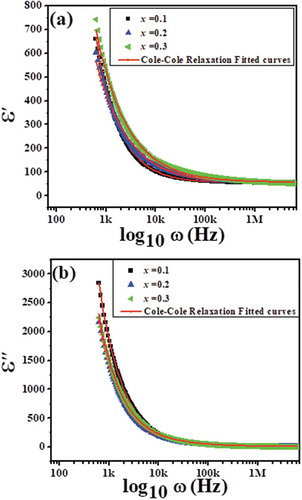
The frequency dependence of the dielectric constant (ε׳) and dielectric loss (ε״) of Nd1-xPbxFeO3 solid solutions for (x = 0.1–0.3) at room temperature in the frequency range 100 Hz–100 KHz is shown in , respectively. It is clear from the figures that both ε׳ and ε״ decrease with increases in frequency. The values of ε׳ and ε״ decrease abruptly in the low-frequency region and slowly in the high-frequency region. These observations can be explained by the dipole relaxation phenomenon [Citation21]. The net polarization of dielectric materials is the sum of the contributions of dipolar, ionic, electronic and interfacial polarizations. In the low-frequency region, all of these polarizations respond to the time varying electric field, leading to increased total polarizibilty of the samples and hence to high values for both ε׳ and ε״. With increases in frequency, however, the dipolar orientations do not switch at sufficiently fast rates to remain in alignment with the switching electric field. As a result, different polarization contributions are filtered out with increasing frequency, leading to a decrease in net the polarization of the material and hence to low values to both ε׳ and ε״. The Cole–Cole relaxation model (a modified form of the Debye relaxation model) has been used to explain the relaxation phenomenon [Citation22]. According to this model, ε׳ and ε״ vary with frequency as follows:
where ε∞ = the dielectric constant measured at high frequency, εs = the dielectric constant measured at low frequency, ω = 2πf the angular frequency of the applied field and τ = the characteristic relaxation time of the medium. The exponent parameter α usually varies between 0 and 1, and describes the shape of the spectral curves. It may be noted that for α = 0, the Cole–Cole model is reduced to the Debye model. The frequency-dependent dielectric data fitted using Cole–Cole dispersion formulas are also shown in , and various fitting parameters are summarized in . It is clear from that the dispersion curves show symmetric broadening and a good fit with the Cole–Cole relaxation model. Furthermore, it can be seen from that the value of α is greater than “0” (for both ε׳ and ε״) for all compositions, implying that the relaxation is stretched. Hence, the relaxation extends over a wider frequency range than Debye relaxation, implying that the samples exhibit non-Debye relaxation [Citation23]. It is also clear from the that the value of α (for both ε׳ and ε״) starts to increase as it moves from the x = 0.1 to the x = 0.3 system, which implies that the x = 0.3 system exhibits the most stretched relaxation among all the samples [Citation24].
Table 3. The non-linear fitting parameters of dielectric constant and dielectric loss versus frequency of Nd1−xPbxFeO3 where x = 0.1, 0.2 and 0.3 samples.
Figure 5. Non-linear fitting of (a) dielectric constant vs. frequency and (b) dielectric loss vs. frequency for Nd1−xPbxFeO3 samples (where x = 0.1, 0.2 and 0.3).
shows the frequency dependence of electrical conductivity for Nd1−xPbxFeO3 (x = 0.1–0.3) ceramics at room temperature. The AC conductivity is calculated from the measured dielectric data using the relation: σac = 2πfε׳εotanδ [Citation25], where the parameters have their usual meaning. It can be observed that the AC conductivity increases with increasing frequency for all the compositions. It is further clear from the figure that the conductivity shows two distinct regimes within the measured frequency limits: (i) a plateau region and (ii) a dispersion region. The plateau region corresponds to the low-frequency region. In this region, conductivity has been found to be independent of frequency. The dispersion region corresponds to the high-frequency region. In this region, conductivity increases with increases in frequency. In fact, the plateau region corresponds to DC conductivity (σdc) and the dispersion region corresponds to AC conductivity (σac). The frequency dependence of AC conductivity in ceramics is generally analyzed using Jonscher’s power law [Citation26]: σac = σdc+ Aωn, where “A” is the dispersion parameter representing the strength of polarizibilty and “n” is the dimensionless frequency exponent representing the interaction between mobile ions the surrounding lattice [Citation27]. According to Jonscher, the origin of the frequency dependence of conductivity lies in the relaxation phenomenon arising due to hopping of mobile charge carriers [Citation28]. It is also clear from the figure that the observed value of σac in the high-frequencies region is the lowest for sample x = 0.1 and starts to increase with the move from the x = 0.1 sample to the x = 0.3 sample. This increase in conductivity might be understood in terms of the concentration of oxygen vacancies (structural defects) [Citation29]. The concentration of oxygen vacancies starts to increase with the move from x = 0.1 to x = 0.3 with the partial substitution of Pb ions in the NdFeO3 system, respectively. Thus, with increases in the concentration of oxygen vacancies, the concentration of structural defects increases, leading to an increase in the value of conductivity.
Figure 6. Non-linear fitting of AC conductivity vs. frequency of (a) x = 0.1, (b) x = 0.2 and (c) x = 0.3 for Nd1−xPbxFeO3 samples.
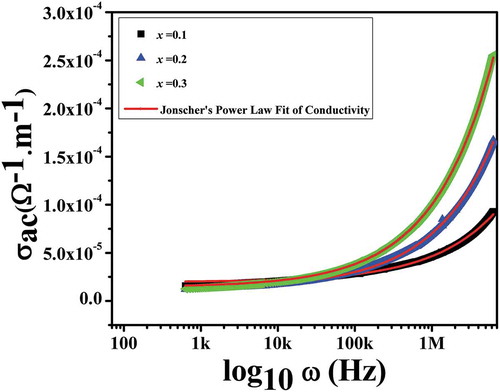
The frequency-dependent conductivity data were fitted using Jonscher’s power law. The various fitting parameters obtained by fitting are summarized in . σdc was found to vary from 1.3810−5 Scm−1 to 1.98
10−5 Scm−1, implying insulating behavior of the ceramics. σdc was been found to correlate with increasing values of “x”. The value of n has been found to vary from 0.52 to 0.56. The value of n < 1 signifies that the charge carriers present in the sample adopt a translational motion with sudden hopping [Citation30,Citation31].
Table 4. The non-linear fitting parameters of ac conductivity versus frequency of NdxPb1−xFeO3samples where x = 0.1, 0.2 and 0.3.
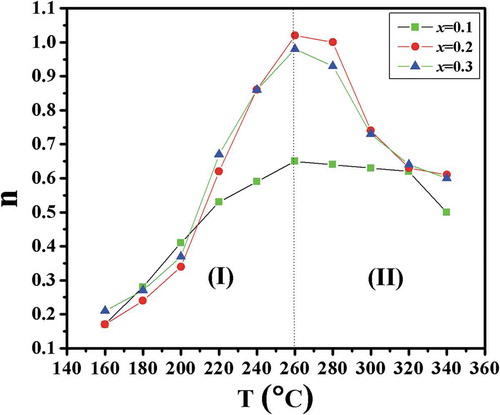
The temperature-dependent electrical conductivity plots for x = 0.1, x = 0.2 and 0.3 are shown in . The temperature- and frequency-dependent conductivity data were fitted using Jonscher’s power law. The frequency- and temperature-dependent n is the most important parameter used to explain the suitable models for the conduction mechanism. shows the variations in n versus temperature for x = 0.1, x = 0.2 and 0.3. Many models have been reported. According to the CBH (correlated barrier hopping) Model, n decreases with increases in temperature, whereas in the OLPT (overlapping large polaron tunneling) Model, n first decreases with increases in temperature up a to certain lower value and then increases with further increases in temperature. In quantum mechanical tunneling (QMT) Model, the value of n ~ 0.8 and is temperature independent [Citation32–Citation34]. It is clear from , n increases with increases in temperature in region (I). It then decreases with temperature in region (II). This observation demonstrates that small polaron tunneling (NSPT) is an appropriate model for electrical conduction in the first region, whereas, the correlated barrier hopping (CBH) model is most suitable for characterizing the electrical conduction in the second region.
Figure 7. Non-linear fitting of AC conductivity vs. frequency at different temperatures (160–340°C) for (a) x = 0.1, (b) x = 0.2 and (c) x = 0.3 Nd1−xPbxFeO3 systems.
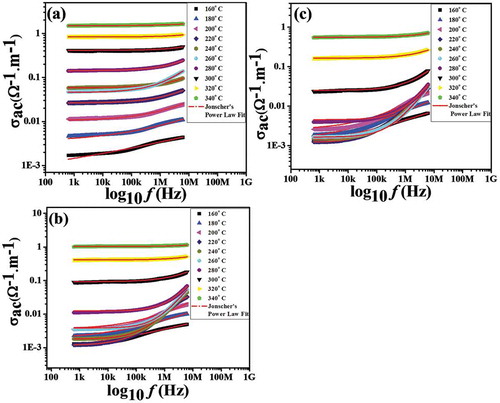
Figure 8. Variations in n (obtained through Jonscher “power law fitting“) with temperature for Nd1−xPbxFeO3 samples (where x = 0.1, 0.2 and 0.3).
4. Conclusion
Nd1−xPbxFeO3 (x = 0.1–0.3) solid solutions were successfully synthesized by the conventional solid-state reaction route. The phase purity and orthorhombic structure of these samples were confirmed using an X-ray diffraction technique. The A-site charge disorder and the formation of oxygen vacancies were found to play important roles in governing the magnetic properties of these solid solutions, which was explained using the Goodenough–Kanamori rule. The dielectric constant (ε׳) and the dielectric loss (ε״) versus frequency curves were fitted using the Cole–Cole dispersion formula and the results revealed that the dielectric dispersion curves show non-Debye relaxation behavior. The electrical conductivity versus frequency curves were analyzed by applying Jonscher’s power law. The value of the temperature dependent exponent “n” was found to be less than 1 for all compositions, which signifies the presence of charge carriers that adopt a translational motion with sudden hopping. The variations in “n” (obtained from Jonscher’s power law fitting) with temperature reveal that the conduction mechanism obeys the small polaron tunneling (NSPT) model at below 260°C, whereas the sample follows the CBH model at above 260°C.
Acknowledgments
The authors wish to thank the Centre for Emerging Life Sciences, GNDU for providing characterization facilities (FESEM and VSM). One author (Sunil Kumar) also wishes to thank UGC-RGNF for providing financial support. Another author (Shubhpreet Kaur) also thanks the UGC-DAE Consortium for Scientific Research, Mumbai for providing financial support.
Disclosure statement
No potential conflict of interest was reported by the authors.
Additional information
Funding
References
- Chen L, Li TW, Cao S, et al. The role of 4f-electron on spin reorientation transition of NdFeO3: A first principle study. J Appl Phys. 2012;111:103905.
- Yuan S, Wang Y, Shao M, et al. Magnetic properties of NdFeO3 single crystal in spin reorientation region. J Appl Phys. 2011;109:07E144.
- Serna PV, Campos CG, Sanchez F, et al. Mechanosynthesis, crystal structure and magnetic characterization of Neodymium ferrite. Mater Res. 2016;19(2):389–393.
- Mir SA, Ikram M, Asokan K. Structural, optical and dielectric properties of Ni substituted NdFeO3. Optik. 2014;125:6903–6908.
- Bashir A, Ikram M, Kumar R, et al. Structural, magnetic and electronic structure studies of NdFe1-xNixO3 (0≤ x ≤ 0.3). J Phys. 2009;21:325501.
- Ahmad I, Akhtar MJ, Younas M, et al. Small polaronic hole hopping mechanism and Maxwell Wanger relaxation in NdFeO3. J Appl Phys. 2012;112:074105.
- Slawinski W, Prezenioslo R, Sosowska I. Spin reorientation and structural changes in NdFeO3. J Phys. 2005;17:4605–4614.
- Hearne GR, Pasternak MP, Taylor RD, et al. Electronic structure and magnetic properties of LaFeO3 at high pressure. Phys Rev B. 1995;51:17.
- Gorodetsky G, Sharon B, Shtrikkman S. Magnetic properties of an antiferromagnetic orthoferrites. J Appl Phys. 1968;39:2.
- Chanda S, Saha S, Dutta A, et al. Raman spectroscopy and dielectric properties of nanoceramic NdFeO3. Mater Res Bull. 2013;48:1688–1693.
- Li L, Song D, Wang TM, et al. Synthesis and structural characterization of gadolinium-calcium ferrites. J Alloys Compd. 1997;261:299–303.
- Li J. Structural characterization of Sm1-xCaxFeO3-y (0≤ x ≤0.50). J Alloys Compd. 1994;203:L1–L4.
- Roh KS, Ryu KH, Yo CH. Nonstoichiometry and physical properties of the perovskite BaxLa1-xFeO3-y. J Mater Sci. 1995;30:1245–1250.
- Kumar S, Pal J, Kaur S, et al. The effect of aliovalent Pb2+ dopant on the magnetic and magnetodielectric properties of LaFeO3 solid solutions. J Magn Magn Mater. 2018;467:89–95.
- Li J, Kou X, Qin Y, et al. Structures and magnetic properties of Nd1-xCaxFeO3. J Appl Phys. 2002;92:12.
- Goodenough JB. Magnetism and the chemical bond. New York: Interscience –Wiley; 1963.
- Meng J, Yuan N, Liu X, et al. Assessment of LaM0.25Mn0.75O3-δ (M = Fe, Co, Ni, Cu) as promising cathode materials for intermediate-temperature solid oxide fuel cells. Electrochim Acta. 2015;264–275.
- Wang Y, Jiang QH, He HC, et al. Multiferroic BiFeO3 thin films prepared via a simple sol-gel method. Appl Phys Lett. 2006;88:142503.
- Zhang H, Liu WF, Wu P, et al. Unusual magnetic behaviors and electric properties of Nd-doped BiFeO3 nanoparticles calcined at different temperatures. J Nanopart Res. 2014;16:2205.
- Singh A, Pandey V, Kotnala RK, et al. Direct evidence for multiferroic magnetoelectric coupling in 0.9BiFeO3-0.1BaTiO3. PRL. 2008;101:247602.
- Kumar M, Yadav KL. J Phys. 2002;19:242202.
- Cole KS, Robert H. Dispersion and absorption in dielectrics:- alternating current characteristics. J Chem Phys. 1941;9:341–351.
- Havriliak S, Negami S. A complex plane representation of dielectric and mechanical relaxation processes in some polymers. Polymer. 1967;8:161–210.
- Pal J, Kumar S, Singh L, et al. Mat Res Bulletin. 2018;102:36–44.
- Prakash V, Choudhary SN, Sinha TP. Dielectric relaxation in complex perovskite oxide BaCo1/2W1/2O3. Physica B. 2008;403:103–108.
- Jonscher AK. The Universal dielectric response. Nature. 1977;267:673–679.
- Pradhan DK, Behera B, Das PR. Studies of dielectric and electrical properties of a new type of complex tungsten bronze electroceramics. J Mater Sci Mater Electron. 2012;23:779.
- Dyre JC, Schroder TB. Ac hopping conduction at extreme disorder takes place on the percolating cluster. PRL. 2008;101:025901.
- Shariq M, Kaur D, Chandel VS, et al. Electrical, surface morphology and magneto-capacitance properties of Pb free multiferroic (BiFeO3)1-x (BaTiO3)x. Acta Phys Polonica A. 2015;127:1675–1679.
- Pattanayak S, Choudhary RNP, Das PR. Effect of Gd substitution on phase transition and conduction mechanism of BiFeO3. J Mater Sci Mater Electron. 2013;24:2767–2771.
- Catalan G, Scott JF. Physics and applications if bismuth ferrite. Adv Mater. 2009;21:2463.
- Tan M, Koseoglu V, Alan F, et al. Overlapping large polaron tunneling conductivity and giant dielectric constant in Ni0.5Zn0.5Fe1.5Cr0.5O4nanoparticles (NPs). J Alloys Compd. 2011;509:9399–9405.
- Vaish R, Varma KBR. Dielectric properties of Li2O-3B2O3glasses. J Appl Phys. 2009;103:064106.
- Megdiche M, Pellegrino CP, Gargouri M. Conduction mechanism study by overlapping large polaron tunneling model in SrNiP2O7ceramic compound. J Alloys Compd. 2014;584:209–215.