
 ?Mathematical formulae have been encoded as MathML and are displayed in this HTML version using MathJax in order to improve their display. Uncheck the box to turn MathJax off. This feature requires Javascript. Click on a formula to zoom.
ABSTRACT
Monolithic NbB2, NbB2-SiC, and NbB2-SiC-GNP samples were produced by spark plasma sintering (SPS), and the effects of additives on the mechanical and thermal properties, microstructures, and oxidation behavior of the samples were investigated. The addition of SiC up to 30 vol% decreased the Vickers hardness of the binary composites due to microcrack formation. The fracture toughness and oxidation resistance of NbB2 were improved with the incorporation of SiC. Fracture toughness was higher for all the composites in comparison to monolithic NbB2, moreover the highest value of ~5.2 MPa·m1/2 exhibited by 3 vol% GNP-containing composite. A strong interface and homogeneous distribution of GNPs enhanced the thermal transfer properties and improved the oxidation resistance of selected NbB2-SiC ceramics in oxidation studies at 1200°C. A combination of high mechanical properties, high thermal conductivity, and low mass gain was achieved for the NbB2-SiC-GNP samples with 1 and 3 vol% GNPs.
1. Introduction
Niobium diboride (NbB2) is a member of ultra-high-temperature ceramics (UHTCs). UHTCs have a high melting temperature (above 3000°C) and structural integrity in extreme conditions at elevated temperatures. They are notable for their extreme hardness (≥20 GPa), excellent thermal shock resistance, and high thermal and electrical conductivities [Citation1]. The main applications of UHTCs are as nozzle and armor materials; leading edges, nose caps, and protective coatings for atmospheric re-entry vehicles and hypersonic systems; and cathode materials for various metal-processing operations [Citation2,Citation3].
An Nb-B binary equilibrium phase diagram [Citation4] indicates the possibility of formation of five compounds: Nb3B2, NbB, Nb5B6, Nb3B4, and NbB2. While other phases melt incongruently, the NbB2 phase melts congruently at ~3040°C. NbB2 is a compound with a solubility range extending from 64 to 76 at% B or 65 to 70 at% B, as determined by Nowotny et al. [Citation5] and Nunes et al. [Citation6], respectively. The Nb atoms in NbB2 form a hexagonal closed packed crystal structure with space groups of P6/mmm and lattice parameters a = 3.116 Å and c = 3.264 Å [Citation7]. The structure of NbB2 comprises hexagonally close-packed Nb atoms and layers of B atoms in 2D graphite-like rings [Citation8]. The high melting temperature (~3040°C), extreme hardness (~21 GPa), high Young’s modulus (~300 GPa) and good chemical resistance of NbB2 are attributed to its bonding type and crystal structure [Citation1].
Although borides have many superior properties, their brittle nature and relatively low-temperature oxidation problem limit their use as monolithic forms. Formation of composite structures for many applications is essential. Significant improvements in the densification, oxidation resistance, and toughness of borides have been reported with the incorporation of silicon carbide (SiC). Superior properties such as high thermal conductivity and the toughening mechanisms they provide, graphene nanoplatelets (GNPs) have become preferred reinforcing materials in recent years.
The literature indicates that the addition of graphene to various ceramic matrices improved their fracture toughness through different toughening mechanisms, such as pull-out, crack deflection, crack bridging, etc. GNPs can also be used to enhance other critical properties, such as the thermal and electrical conductivities of UHTCs. Especially high thermal conductivity is essential for use in the nose caps and leading edges of hypersonic vehicles to effectively reradiate heat through the cooler surfaces of the systems.
The use of graphene has been utilized in several UHTCs, such as TiB2-SiC [Citation9], ZrB2-SiC [Citation10,Citation11], TiB2-TiC [Citation12], SiC [Citation13], and TaC [Citation14,Citation15]. In our previous study [Citation9], the effects of silicon carbide and silicon carbide-graphene platelet additions on the properties of TiB2 were investigated. It was found that the GNP positioning and homogeneous distribution of GNP are critical parameters for achieving properties such as high fracture toughness, high thermal conductivity and improved oxidation resistance. The highest mechanical properties and good oxidation behavior were obtained with 0.5 and 1 vol% GNPs.
In general, studies of NbB2 have focused mainly on superconducting behavior [Citation7,Citation16,Citation17]. The sinterability of NbB2 and methods of NbB2 powder synthesis have also been studied by many authors. Matsudaira et al. [Citation18] synthesized NbB and NbB2 powder by solid-state reaction between Nb metal and amorphous B powder. The authors investigated the sinterability of the synthesized powder at 1600°C for 15 min under 4 GPa and reported a relative density of ~90%. Iizumi et al. [Citation19] prepared a powder mixture of Nb-B (1:2 at%) using a planetary ball mill. Balci et al. [Citation20] used a novel powder metallurgy method to synthesize nano-sized niobium boride powder from oxide raw materials and a reducing agent, that is, Mg. In another study, Balci et al. [Citation21] studied spark plasma sintering of niobium boride powder with NbB, Nb3B4, NbB2 phases at 1500°C with a holding time of 15 min under 60 MPa and reported a relative density, Vickers hardness and fracture toughness of ~84%, ~14 GPa and ~2MPa·m1/2, respectively. Sairam et al. [Citation22] synthesized NbB2 powder using elemental Nb and amorphous B, and produced monolithic NbB2 ceramics with a relative density of ~ 97.7% by spark plasma sintering at 1900°C with a holding time of 15 min. The authors reported respective hardness and fracture toughness values of ~20 GPa and ~4 MPa·m1/2 for monolithic NbB2. Demirskyi et al. prepared spark plasma sintered B4C–NbB2 composites [Citation23] with 15, 35 or 60 mol% NbB2, and SiC-NbB2 [Citation24] composites with 37–50 vol% NbB2. Another study [Citation25] investigated the high-temperature performance of spark plasma sintered NbB2. The authors reported an increment of ~14% in flexure strength values with increases in temperature from room temperature to 1800°C.
The objectives of this study were to produce spark plasma sintered NbB2 ceramics with SiC and SiC-GNP and to investigate the effects of secondary phases on the mechanical and thermal properties and oxidation behavior of these samples.
2. Materials and methods
2.1. Composite production
Niobium diboride (NbB2, H.C. Starck, grade AB 102,697, metal basis), alpha-silicon carbide (α-SiC, H.C. Starck, grade UF-10-A, AB13455) and graphene nanoplatelets (GNP, Nanokomp, purity > 97, thickness: 5–8 nm, diameter: 5–10 µm) were used as starting materials. Nine different compositions were prepared (). The powder preparation method is explained in detail in a previous publication [Citation9]. The samples were sintered at SPS temperatures of 1700 or 1750°C (depending on the composition) for 5 min under a uniaxial pressure of 50 MPa with a heating rate of 2°C/s in a vacuum. The sintered specimens were in the form of pellets 50 mm in diameter and ~4 mm thick. The volume fraction of NbB2 was maintained at a constant 70% for triple composites, because a combination of superior densification and mechanical properties was achieved for this content in NbB2-SiC composites.
Table 1. Composition, density, hardness, and fracture toughness values for spark plasma sintered specimens (NC: not calculated).
2.2. Characterization of the composites
Archimedes principle was used to measure the density of the samples. The resulting values were converted to relative densities using the theoretical densities and the volume fractions of the NbB2 (6.97 g/cm3), α-SiC (3.21 g/cm3) and GNPs (1.9 g/cm3). The crystalline phases were identified by X-ray diffractometer (XRD; MiniFlex, Rigaku Corp.) in the 2θ = 20–90° range with CuKα radiation. The microstructures of the sintered samples were investigated using scanning electron microscopy (FESEM; JSM 7000F, JEOL Ltd.). The Vickers hardness and fracture toughness values were determined from Vickers indentations (VHMOT, Leica Corp.) under loads of 9.8 and 19.6 N, respectively. The average value (from 10 measurements) for each sample was used to evaluate the hardness and fracture toughness. The indentation fracture toughness values were measured using the equation derived from Anstis et al. [Citation26].
The oxidation resistance of the specimens was evaluated in stagnant air in a furnace (Nabertherm C42) at 1100–1300°C for 90–360 min. The samples were put on a refractory tile and placed into a MoSi2 resistance-heated furnace at oxidation temperatures. They were then cooled inside the furnace. The sample weights were measured before and after oxidation to determine the mass change, and the dimensions were measured to calculate the surface area of each test specimen. The specific mass change values were calculated from the total mass change divided by the surface area of the samples. The oxide layers and fracture surfaces of the samples were characterized using a scanning electron microscope (SEM; JEOL JSM 7000F). Chemical analysis and dot mapping of the elements were performed with energy dispersive spectroscopy (EDS; Oxford INCA).
The thermal conductivities of the samples were calculated as a function of temperature (25°C to 300°C) from the measured thermal diffusivities (α) and constant pressure heat capacities (cp). The measurements were conducted under a nitrogen atmosphere by the laser flash method (Flashline 4010, Anter Corp.). The average values of three shots were recorded as functions of the test temperature. The thermal conductivity values of the specimens were calculated using the following equation [Citation9]:
where k is the thermal conductivity and ρ is the bulk density.
3. Results and discussions
3.1. Densification behavior and crystalline phases
shows the variations in the measured and relative densities of the samples depending on their SiC and GNPs content. The NbB2 and NbB2-SiC composites exhibited relative densities of >97%. However, the measured densities of NbB2-SiC-GNP samples sintered at 1700°C were higher than the predicted theoretical densities. shows the XRD patterns of monolithic NbB2 before and after sintering at 1750°C, and samples of 30S, 25S5G and 23S7G after sintering at 1700°C. XRD analysis revealed that monolithic NbB2 had a single phase before and after sintering. Characteristic peaks of NbB2 (JCPDS: 35–0742) and α-SiC (JCPDS: 49–1428) were identified, moreover, no chemical reaction was detected between NbB2 and α-SiC for any binary composition at 1700°C. On the other hand, XRD analysis ( and e) showed that increasing the amount of GNPs content in the overall powder mixture led to formation of a multi-phase: NbB2 and Nb3B4 (JCPDS: 03–065-2553). The theoretical density of body-centered orthorhombic Nb3B4 (~ 7.32 g/cm3) [Citation27] is higher than that of NbB2. The relative densities of the GNP-containing samples could not be measured because the true density of the composites was unknown.
Figure 1. XRD patterns of (a) NbB2 starting powder, (b) monolithic sintered NbB2, (c) sample 30S, (d) sample 25S5G, and (e) sample 23S7G.
To explain the mechanisms of formation of a second niobium boride phase (Nb3B4), NbB2-GNP binary composites with 5 and 7 vol% GNP were prepared by SPS at 1700°C. The XRD patterns of the NbB2-GNP binary composites are given in Figure S1. No formation of the Nb3B4 phase was observed by XRD for the NbB2-GNP binary composites after sintering at 1700°C. However, composites with SiC and GNP had a Nb3B4 phase ( and e). It is believed that the formation of the Nb3B4 phase is related to the presence of both SiC and GNP additions.
According to an equilibrium phase diagram of the Nb–B binary system [Citation28], the NbB2 phase with a boron content range of 65–70% (at) was transformed during SPS to lower boron content (58–65%) ranges of the Nb3B4 and NbB2 phases in this study. Yeh et al. [Citation29] reported the formation of a secondary Nb3B4 phase with the NbB2 phase.
Punch displacement data were employed to analyze the densification behavior of the samples. Densification studies revealed that the addition of 10 vol% SiC to NbB2 reduced the starting and completion temperatures of shrinkage from 1340 to 1250°C and from 1745 to 1690°C, respectively. Further addition of SiC (30 vol%) resulted in a slight decrement (~20°C) in the starting temperature of shrinkage. The presence of SiC as a secondary phase is effective in removing the oxide impurities from the NbB2 powder particle surfaces. SiC particles can also enhance densification by inhibiting grain growth [Citation30,Citation31].
Shrinkage started at higher temperatures (~1330°C) for the GNP-containing samples compared to the NbB2-SiC composites. It was observed that densification was limited by the volume fraction of GNPs, and that in turn, high amounts of GNPs hinder the densification of NbB2-based composites [Citation32]. This could be related to agglomerates of graphene detected in the samples with high concentrations of GNPs making sample densification difficult.
3.2. Microstructural evaluation
shows micrographs of the fracture surfaces of sintered monolithic NbB2 and NbB2-SiC binary (GNP addition-free) composites. Microstructural observations of the samples are in agreement with the measured relative densities ().
Figure 2. SEM images of the fracture surfaces of (a) sample 100N, (b) sample 10S, (c) sample 20S, (d) sample 30S, and (e) microcracks in sample 30S. The circles in (c) and (e) show microcracks, and the magnification of (e) is different.
The fracture mode of monolithic NbB2 was observed to be mainly transgranular, and its microstructure contained large grains with an average grain size of ~8 µm. The pores were round in shape and were located mainly at multiple grain junctions (). -e show the fracture surfaces of NbB2-SiC composites. Black-looking SiC grains with grain sizes of less than ~3 µm were present at three points () as isolated, equiaxed particles in intergranular positions of NbB2. SiC grains block the movement of NbB2 grain boundaries; they therefore prevent coarsening of the NbB2 grains. The fracture mode changes to the mainly intergranular fracture with the addition of SiC. A high-magnification micrograph () clearly shows microcrack formation in the NbB2-SiC composites. The anisotropy of the hexagonal grain structures of NbB2 and α-SiC, along with the mismatched coefficients of thermal expansion (CTE) between the NbB2 and α-SiC phases, could be reasons for the microcracks formation indicative of residual thermal stresses. High heating and cooling rates were applied during the SPS process and when the composites were cooled from the sintering temperature to room temperature, internal residual stresses arose due to the mismatch of thermal expansion coefficients between NbB2 and α-SiC. The reported CTE values (at 20°C) along the a-axis are 6.0 × 10⁻⁶/°C and 3.7 × 10⁻⁶/°C for NbB2 and α-SiC, respectively [Citation33,Citation34]. Along the c-axis, NbB2 has a CTE of 7.7 × 10⁻⁶/°C, and α-SiC has a CTE of 4.5 × 10⁻⁶/°C. This could lead to the formation of microcracks.
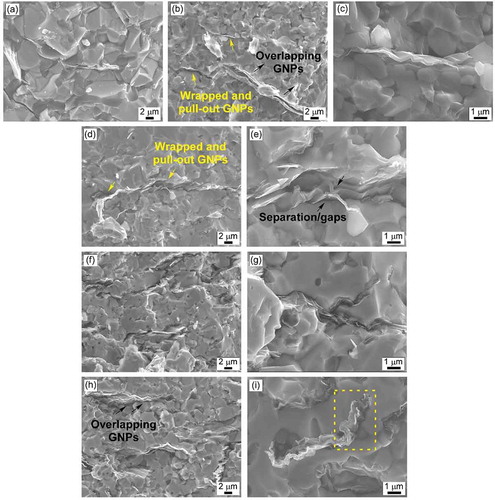
shows micrographs of the fracture surfaces of NbB2-SiC-GNP composites taken at different magnifications (×3k and ×10k). The dense, uniform microstructure was examined. The fracture surfaces of the samples revealed that graphene platelets were homogeneously distributed in the NbB2-SiC matrix forming network structures. The platelets were wrapped around the NbB2 and SiC grains. It was also observed that the platelets conformed to the shapes of the NbB2 and SiC grain boundaries. and show kinked GNPs in the NbB2-SiC matrix. The GNPs were bent at high angles (≥90°) to form a corrugated structure without fracturing. A similar microstructure was also observed by Nieto et al. for TaC [Citation14] and Al2O3 [Citation35]. In addition, this wrapping tendency of the GNPs increased as the amounts of addition were increased (magnified view in ). It was determined that some of the GNPs agglomerated ( and ) and overlapping (with a thickness of ~0.5 µm). GNP protrusion and pull-out from the NbB2-SiC matrix was also observed. It was noted that GNP-containing composites exhibited a finer grain structure, which could be attributed to effects of the grain wrapping and pinning of GNPs at the grain boundaries.
Figure 3. SEM images of the fracture surfaces of the NbB2-SiC-GNP composites: (a) sample 29S1G, (b) and (c) sample 27S3G, (d) and (e) sample 25S5G, (f) and (g) sample 23S7G, and (h) and (i) sample 20S10G.
3.3. Mechanical properties
shows the mechanical properties of monolithic NbB2 and NbB2-based composites. The average Vickers hardness of sample 100N was measured as ~20 GPa. The average Vickers hardness of the NbB2-SiC binary composites with relative densities of ~97% decreased from ~20 GPa to ~18.9 and ~17.9 GPa with 10 and 20 vol% SiC, respectively. The reduction in Vickers hardness could be attributed to the presence of microcracks. Microcraking could originate from two causes: the anisotropy of the hexagonal NbB2 and α-SiC grains, and the mismatched coefficients of thermal expansion (CTE) between the matrix and reinforcing phases. Moreover, rapid heating and cooling were applied during the sintering process. The mismatched CTEs of NbB2 and α-SiC can cause internal residual stresses when binary composites are cooled from the sintering temperature (1700°C) to room temperature. This can lead to a reduction in average Vickers hardness with the formation of microcracks, microstructural defects, etc. On the other hand, the addition of 30 vol% increased the average Vickers hardness of binary composites to ~24 GPa. One possible reason for the increased hardness is considered, namely, since the theoretical Vickers hardness of sintered monolithic NbB2 and α-SiC are ~20 [Citation24] and ~26 GPa [Citation9], respectively, the increase in hardness could be attributable to the presence of a high volume fraction of the harder reinforcement phase. Although the formation of microcracks was also examined for the sample with 30 vol% SiC ( and e), the high volume fraction of SiC may overcome the opposite effect of microcracking and result in higher hardness.
also shows the Vickers hardness of the NbB2-SiC-GNP triple composites. It was observed that the Vickers hardness of the composites exhibited a dependence on the volume fraction of the GNPs. The average hardness of the samples with 0, 1, 3 and 5 vol% GNPs had almost the same value of ~24 GPa. The hardness decreased by ~7 and ~11% with the additions of 7 and 10 vol% GNPs into the NbB2-SiC matrix. The interfacial bonding strength between the matrix grains and the matrix-reinforcing phase determine the hardness of the graphene-containing samples [Citation36]. The reduced hardness with high GNP loadings (7 and 10 vol%) could be attributable to the existence of agglomerated and overlapping of GNPs, which can lead to the formation of non-uniform distribution.
The fracture toughness values as a function of composition are listed in . The average fracture toughness of sample 100N was measured as ~3.8 MPa·m1/2. A similar result was reported by Sairam et al. [Citation22], who achieved a fracture toughness of ~4 MPa·m1/2 for spark plasma sintered monolithic NbB2 at 1900°C. The measured fracture toughness of the NbB2-SiC composites ranged from ~4.2 to ~4.6 MPa·m1/2, which is significantly higher than that of the monolithic NbB2. The average fracture toughness increased by ~11%, ~16%, and ~23% with the addition of 10, 20, and 30 vol% SiC into the NbB2, respectively. The highest fracture toughness of ~4.6 MPa·m1/2 was achieved with the addition of 30 vol% SiC.
In our previous study [Citation9], SiC and SiC-GNP were incorporated into TiB2. The hardness and fracture toughness values for monolithic sintered TiB2 were measured as ~24.2 GPa and ~3.9 MPa·m1/2, respectively. In addition, if the mechanical properties of TiB2-20 vol% SiC binary composites are compared with sample 20S, it is evident that higher Vickers hardness (~9%) and indentation fracture toughness (~20%) values were achieved when the matrix was TiB2. The higher hardness of monolithic TiB2 as compared with NbB2 was expected due to the strength of the B-B bonds, which control the hardness of borides. In general, Group IVB borides (Ti, Zr, Hf) have higher hardness and thermal conductivity than Group VB borides (V, Nb, Ta) [Citation8].
The fracture toughness values of samples 27S3G and 25S5G were ~ 5.2 and ~5 MPa·m1/2, respectively. The fracture surface micrographs of these composites (-e) revealed kinked and pulled-out GNPs. It is well known that GNP kinking is one of the primary energy dissipating mechanisms [Citation37].
The highest GNP addition (10 vol%) lowered the fracture toughness by ~ 20% compared to the composite with 3 vol% GNP. The dispersal of GNP in the NbB2-SiC matrix becomes more challenging when high volume fractions are introduced. The 7 and 10 vol% addition of GNP led to agglomeration and overlapping of platelets, as seen in the fracture surfaces of these composites ( and i). Nieto et al. [Citation37] reported that the formation of thick platelets reduced the flexible character of GNPs and impeded their reinforcing ability. As reported by Nieto et al. [Citation37] and Markandan et al. [Citation38], thick platelets originating from agglomeration or overlapping of GNPs caused the formation of localized porosity, which serve as crack initiation sites. Accordingly, the reduction in fracture toughness could be attributed to the creation of thick overlapping GNPs.
shows crack paths generated by the Vickers indentation tests. The crack propagation path for monolithic sintered NbB2 was mainly transgranular (). On the other hand, the crack propagation paths for binary and triple composites were both intergranular (black circles in ) and transgranular. The effective toughening mechanism for NbB2-SiC binary composites is considered to be microcracking, which originates due to the CTE differences between NbB2 and SiC. Crack branching and deflection were also examined for the samples with GNP. Crack deflection () occurs when a crack encounters GNP and changes its direction. Due to their high in-plane strength and high aspect ratio of the platelets, GNPs are thought to be highly effective crack deflectors. As discussed earlier in the microstructural characterization section, pull-out and platelet kinking are considered to be other toughening mechanisms for GNP-containing composites.
Figure 4. SEM images of indentations and indentation crack paths in the polished surfaces of (a) and (b) sample 100N, (c) sample 30S, and (d) sample 25S5G. Note that the magnifications vary.
GNP toughening mechanisms have been reported for the various spark plasma sintered ultra-high temperature matrices such as ZrB2 [Citation39] and TaC [Citation14,Citation15]. Yadhukulakrishnan et al. [Citation39] reported a fracture toughness value of ~2.8 MPa·m1/2 for a ZrB2-GNP composite and attributed this value to the crack deflection and crack bridging occurring with the reinforcement of 6 vol% GNP. Nieto et al. [Citation14] studied a model for correlating improvement in damping behavior with fracture toughness and reported the effect of a homogeneous distribution of GNP in the energy dissipation mechanism. Nieto et al. [Citation15] also produced TaC-GNP composites and investigated an improvement in fracture toughness by up to 99%. As stated in the previous section, moreover, a thermal expansion mismatch between the matrix and secondary particulates can lead to residual stresses. The local residual stresses induced by the mismatch of the thermal expansion coefficients of NbB2 and SiC matrix grains and GNPs (~1 × 10⁻⁶/°C) [Citation9] can improve the fracture toughness of composites. Further work is needed to quantify the relative contributions of all the toughening mechanisms, but it is possible to conclude that improvement in toughness, especially for composites with 1, 3, and 5 vol% GNP, is probably related to a combination of toughening mechanisms, such as crack bridging, crack deflection and GNP bending, and incorporation of secondary particles with different thermal expansion coefficients into the matrix.
3.4. Oxidation studies
The oxidation behavior of monolithic NbB2 and NbB2-based composites in air was evaluated at 1200, 1300 and 1400°C for 90–360 min. The oxidation results at 1400°C were not measured due to partial melting and interaction of the samples with the substrate. Figure S2 shows photographs of monolithic NbB2 and NbB2-SiC samples with different SiC contents after oxidation at 1200 and 1300°C for 90 min. The surfaces of the samples were completely covered with a rough white layer after oxidation at 1200°C. On the other hand, visible structural damage and partial melting were observed for samples after oxidization at 1300°C.
shows the specific weight change per unit area of monolithic NbB2 and NbB2-SiC composites depending on the composition and exposure time at 1200°C. Monolithic NbB2 exhibited parabolic behavior and the highest weight gain due to the formation of a dense, thick and continuous protective layer. Accordingly, higher specific mass gains were obtained with longer exposure as shown in . The mass gain of monolithic NbB2 increased from ~28 to ~50 mg/cm2 when the exposure time was increased from 90 to 360 min, respectively.
Figure 5. Specific weight changes in monolithic NbB2 and NbB2-SiC composites with respect to time at 1200°C.
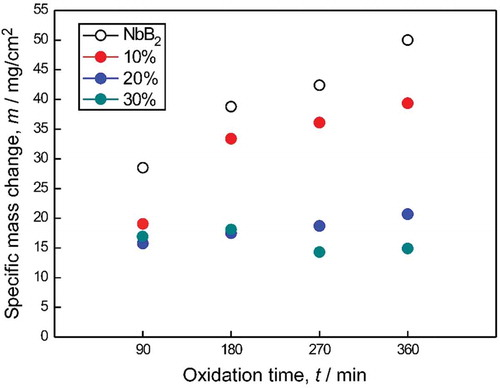
also shows specific mass changes per unit area of the NbB2-SiC composites depending on the SiC content and exposure time at 1200°C. It is clear that the SiC-containing samples showed lower specific mass change results than monolithic NbB2, and the mass gain results decreased with increases in SiC content. The specific mass change values were in the range of ~28–50 and ~10–39 mg/cm2 for monolithic NbB2 and the NbB2-SiC composites, respectively. The lowest mass gain (~14 mg/cm2) was obtained for sample 30S after oxidation at 1200°C for 270 min.
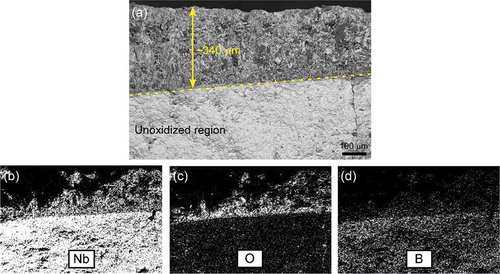
shows cross-sectional morphology and energy dispersive X-ray spectroscopy (EDS) maps of the oxide scale formed at 1200°C after 180 min for sample 100N. Maps of the niobium (Nb), oxygen (O) and boron (B) concentrations showed that ~ 340 µm thick surface layer was composed of these elements. X-ray diffraction (XRD) analysis of the oxide layer revealed the presence of the Nb3BO9 phase.
Figure 6. (a) Cross-sectional micrograph of sample 100N after oxidation at 1200°C for 180 min, and elemental composition maps showing the distribution of (b) niobium, (c) oxygen, and (d) boron.
The current literature reveals a very limited number of studies on the oxidation behavior of NbB2 ceramics. Talmy et al. [Citation40] performed oxidation studies on hot-pressed monolithic NbB2 at 1000°C for 120 min and reported that the samples were coated with a thick, porous layer containing Nb3BO9 and B2O3. Mansurova et al. [Citation41] studied the oxidation behavior of Nb-Si eutectic alloy and explained the formation of the Nb3BO9 phase as a result of the interaction of B2O3 and Nb2O5 when the temperature is above 750°C. Similarly, Cheng et al. [Citation42] reported formation of the Nb3BO9 phase in the form of 3Nb2O5.B2O3 in Nb-B-Si alloys after oxidation at 1100°C for 1h and attributed the existence of this phase to the transformation of NbO2 to Nb2O5 leading to a tendency of Nb2O5 to react with B2O3. Possible reactions during the oxidation of monolithic NbB2 can be summarized as follows:
Cheng [Citation42] et al. investigated the sequential oxidation layers. Eq. (2) occurs when the amount of oxygen is insufficient; NbO2 is then transformed to the Nb2O5 as oxidation proceeds. As shown in Eq. (4), Nb2O5 tends to react with B2O3 and form Nb3BO9 phase on the outer layer. The B2O3 evaporates at high temperatures, and pores may also occur in the oxide layer.
shows the cross-sectional morphology and EDS mapping of sample 30S after oxidation at 1200°C for 180 min. When the specimen was exposed to air at 1200°C, ~245 µm thick continuous oxide layer was formed on the surface (). The surface layer was composed of flakes ( inset). X-ray mapping showed homogeneous distributions of niobium (Nb), oxygen (O), boron (B), and silicon (Si). Inhomogeneous distribution of bright looking carbon (C) was also observed in the ~130 µm thick region of the oxide layer. This carbon might have been trapped inside the oxide layer due to the high NbB2 oxidation rate and rapid formation of Nb3BO9. X-ray diffraction (XRD) analysis revealed the presence of Nb3BO9 and SiO2 phases. The assumed main reaction in the oxidation of α-SiC on oxidation temperature of 1200°C is described by the following equation:
Figure 7. (a) Cross-sectional micrograph of sample 30S after oxidation at 1200°C for 180 min, and elemental composition maps showing the distribution of (b) niobium, (c) oxygen, (d) boron, (e) silicon, and (f) carbon. The inset in (a) is a surface micrograph of the oxide scale.
Figure S3 shows photographs of NbB2-SiC-GNP samples with different GNP contents after oxidation testing at 1200 and 1300°C for 90 min. The surfaces of the samples were completely covered with an oxide layer. No visible structural damage was observed in the samples containing GNP after oxidization at 1300°C. Composites with different GNP contents showed better structural integrity after oxidation at 1300°C compared to monolithic NbB2 and NbB2-SiC composites (Fig. S2). Enhanced oxidation behavior with the addition of GNP was reported by Nieto et al. [Citation43] for TaC-based composites. They observed the thinnest oxide layer formation in a sample with 3 vol% GNPs, and the grain-sealing mechanism of the GNPs explained the enhanced oxidation resistance of the GNP-containing composites.
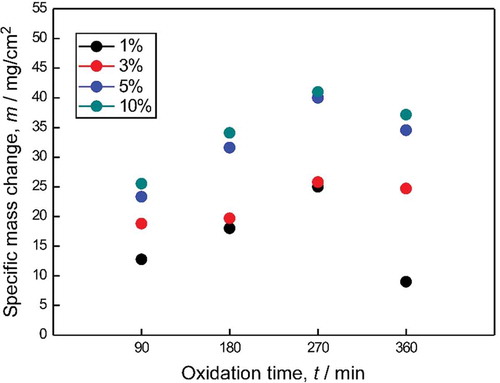
shows the specific mass change per unit area of NbB2-SiC-GNP composites depending on the GNPs content and exposure time at 1200°C. The mass gain results of triple composites exhibited parabolic behavior, and the values were lower than that of the monolithic NbB2 for the same oxidation conditions. Moreover, the specific mass change results increased with increases in the GNPs content. The smallest mass gain was achieved for sample 29S1G. The mass gain values for sample 29S1G were ~13 and ~25 mg/cm2 after oxidation at 1200°C for 90 and 270 min, respectively. The mass gain value for the same sample decreased from ~13 to ~7 mg/cm2 when the oxidation temperature was increased from 1200 to 1300°C.
Figure 8. Specific weight changes in NbB2-SiC-GNP composites with respect to time and GNP content at 1200°C.
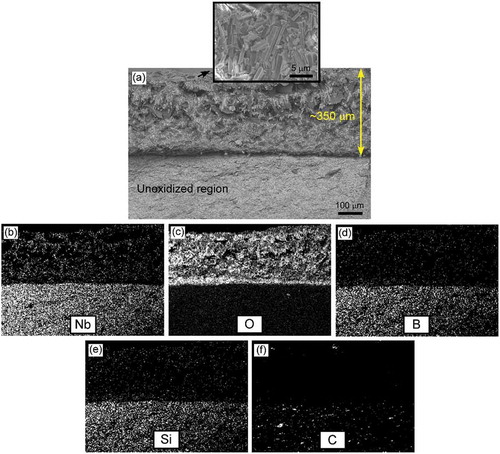
shows the cross-sectional morphology of sample 27S3G and EDS mapping of Nb, O, B, Si and C after oxidation testing at 1200°C for 180 min. Oxidation of GNP-containing samples resulted in formation of a two-layered structure (i.e., oxide scale and unoxidized region). Mapping of the elements showed that the outermost layer with a thickness of ~350 µm was composed of Nb3BO9 and SiO2, and formation of this thick oxide layer was due to oxidation of NbB2 and α-SiC. The oxide layer did not contain carbon (), in contrast to the observed in NbB2-SiC composite (), although carbon distribution was also low in its unoxidized layer. This decrease in carbon content is believed to be due to the release of carbon as CO gas.
Figure 9. (a) Cross-sectional micrographs of sample 27S3G after oxidation at 1200°C for 180 min, and elemental composition maps showing the distribution of (b) niobium, (c) oxygen, (d) boron, (e) silicon, and (f) carbon. The inset in (a) is a surface micrograph of the oxide scale.
Nb3B4 phase formation was observed for NbB2-SiC-GNP composites, as mentioned in Section 3.1. The boron content of Nb3B4 is lower than that of the NbB2 phase; therefore, the presence of Nb3B4 might exert a positive effect on the oxidation resistance of samples.
shows the thermal conductivities (k) of monolithic sintered NbB2 and NbB2-based binary and ternary composites as a function of composition and temperature. The standard deviation was less than 2.5% of the average diffusivity for the test temperatures. The thermal conductivity values of all the samples decreased with increases in the test temperature. Monolithic sintered NbB2 possessed higher conductivities than binary and ternary composites, and the thermal conductivity of pure NbB2 varied widely, from ~102 W/m·K at 25°C to ~60 W/m·K at 300°C. Transition borides exhibit metallic behavior. The decrease in the k value with increases in temperature is expected for NbB2, as for other transition borides such as TiB2 [Citation9], ZrB2 [Citation44,Citation45] or HfB2 [Citation45,Citation46] due to high scattering of phonons and electrons at elevated temperatures.
Figure 10. Thermal conductivity values as a function of temperature for monolithic NbB2 and the NbB2-SiC and NbB2-SiC-GNP composites.
The reported thermal conductivity values for monolithic NbB2 are limited. Lauwers et al. [Citation47] reported a low thermal conductivity of ~24 W/m·K for monolithic NbB2, but they did not provide the test temperature and density of the sample. The maximum thermal conductivity obtained in this study was ~102 W/m·K for monolithic NbB2, which is much higher than any previously reported [Citation47]. This might be attributable to the larger average grain size of monolithic sintered NbB2.
In the present study, the specific heat values for monolithic NbB2 increased with increases in temperature, and they were measured as ~43.6 J/mol·K and ~47.2 J/mol·K at 100 and 300°C, respectively. Similar specific heat values were reported by Kaur et al. [Citation48], who measured the specific heat of NbB2 at different temperatures.
Changes in thermal conductivity values are known to depend mainly on the type and amount of secondary phases. The presence of SiC as a secondary phase decreased the thermal conductivity values in the present study. The k values of NbB2-SiC binary composites were in the range of ~50-~90 W/m·K and decreased with increases in SiC content. The k value decreased by ~14% and ~38% with the addition of 10 vol% and 30 vol% SiC, respectively to the monolithic NbB2 at test temperatures of 100°C (). Hilmas et al. [Citation49] reviewed the effects of second phase additions on thermal conductivity of ZrB2 and HfB2 and concluded that additions, including SiC, reduce the k values of borides. They also stated that electrons control the total thermal conductivity (electron and phonon contributions) of borides. SiC is a semiconductor material that exhibits greater insulating behavior than borides. Incorporation of SiC into the diboride matrix decreases the electron contribution and increases the phonon contribution. Moreover, microcracks (shown in ), which have a similar effect to that of porosity on heat conduction, and SiC purity plays an essential role in lowering the thermal conductivities of SiC-containing boride-based composites. The same behavior was also reported in our previous study for TiB2-based composites [Citation9]. Hu et al. [Citation50] evaluated the effects of SiC additions on the thermal and electrical conductivities of spark plasma sintered ZrB2 and HfB2 ceramics. They reported a ~ 6% decrease in thermal conductivity when the SiC content was increased from 5 to 10 vol%, but the authors did not explain this phenomenon. In contrast to the ~3% and ~20% increases in thermal conductivity with the additions of 20 and 30 vol% SiC, respectively, reported by Hu et al. [Citation50], a ~ 6% decrement was achieved in the present study. Zimmerman et al. [Citation44] reported a ~ 17% increase in the room temperature thermal conductivity of ZrB2 with the addition of 30 vol% SiC. However, the thermal conductivities of monolithic ZrB2 were higher than those of ZrB2-SiC composites at test temperatures higher than 127°C.
The thermal conductivities of NbB2-SiC-GNP composites showed different trends depending on the GNP content and test temperature. The k values of the sample with 1 vol% GNP were ~80 and ~62 W/m·K at test temperatures of 25 and 300°C, respectively. The thermal conductivity of the sample with 10 vol% GNP was also ~80 W/m·K at 25°C, but a significant reduction was observed at 300°C. It is evident that the thermal conductivities of samples with different GNP contents were very close at lower test temperatures, but they diverged at elevated temperatures. This could be related to the thermal boundary resistance of GNPs and matrix grains. Gap formation or separations between matrix grains could be another reason for the low thermal conductivities of composites with high GNP content. Overlapping and agglomerated GNPs and the separation of the matrix grains and GNPs gained dominance in samples with high GNP loadings.
When all the results are examined, it is clear that unagglomerated, homogeneous distribution of graphene is critical to the ability of this additive to improve densification, mechanical properties, oxidation resistance, and thermal conductivity. Similar conclusions have been reported in previous studies for different matrices such as polymers [Citation51], Al2O3 [Citation52], and metals [Citation53].
4. Conclusions
Monolithic NbB2 and SiC and SiC-GNP-containing NbB2 composites were prepared by SPS.
Although the relative densities of triple composites were not measured because of the formation of a secondary boride phase of Nb3B4, a ~ 97% relative density was achieved for NbB2 and NbB2-SiC composites.
The SiC addition decreased the average grain size of NbB2 and changed the fracture mode to mainly intergranular configuration. 10 and 20 vol% SiC addition decreased the Vickers hardness values due to the formation of microcracks, but the addition of 30 vol% SiC to NbB2 improved its oxidation resistance and resulted in increases in hardness and fracture toughness by ~20% and 23%, respectively.
A combination of superior hardness, fracture toughness, and thermal conductivity values and the lowest mass gains was achieved for the composites with 1 and 3 vol% GNPs. The increase in fracture toughness can be attributed to a combination of toughening mechanisms, including crack deflection and branching, GNP pull-out and kinking. Difficulty in densification, poor mechanical properties and lower thermal conductivities were observed when the GNP content exceeded 5 vol% owing to the agglomeration and/or overlapping of GNPs and weak interfaces between GNPs and matrix grains.
Supplemental Material
Download MS Word (573 KB)Acknowledgments
Provision of financial support for this research by the Scientific and Technological Research Council of Turkey (TUBITAK) under project number 215M617 is gratefully acknowledged. The authors are also thankful to B. Yavas and H. Sezer for SPS experiments and microstructural investigations, respectively.
Disclosure statement
No potential conflict of interest was reported by the authors.
Supplemental material
Supplemental data for this article can be accessed here.
Additional information
Funding
Related Research Data
References
- Paul A, Jayaseelan DD, Venugopal S, et al. UHTC composites for hypersonic applications. J Am Ceram Soc Bull. 2012;91:22–28.
- Wuchina E, Opila E, Opeka M, et al. UHTCs: ultra-high temperature ceramic materials for extreme environment applications. The Electrochem Soc. 2007 Winter;16(4):30–36.
- Wuchina E, Opeka M, Causey S, et al. Designing for ultrahigh-temperature applications: the mechanical and thermal properties of HfB2, HfCx, HfNx and αHf(N). J Mater Sci. 2004;39:5939–5949.
- Otani S, Korsukova MM, Mitsuhashi T. Floating zone growth and high-temperature hardness of NbB2 and TaB2 single crystals. J Cryst Growth. 1998;194:430–433.
- Nowotny H, Benesovsky F, Kieffer R. Beitrag zum Aufbau der Systeme Niob-Bor und Tantal-Bor (Contribution to building the systems niobium-boron and tantalum-boron). Z Metalkde. 1959;50:417–423.
- Nunes CA, Kaczorowski D, Rogl P, et al. The NbB2-phase revisited: homogeneity range, defect structure, superconductivity. Acta Mater. 2005;53:3679–3687.
- Sikder AS, Islam AKMA, Nuruzzaman M, et al. Superconducting NbB2: an ab initio study of elastic constants. Solid State Commun. 2006;137:253–256.
- Fahrenholtz WG, Hilmas GE, Talmy IG, et al. Refractory diborides of zirconium and hafnium. J Am Ceram Soc. 2007;90:1347–1364.
- Akin I, Kaya O. Microstructures and properties of silicon carbide- and graphene nanoplatelet-reinforced titanium diboride composites. J Alloy Compd. 2017;729:949–959.
- Asl MS, Kakroudi MG. Characterization of hot-pressed graphene reinforced ZrB2-SiC composites. Mater Sci Eng A. 2015;625:385–392.
- Zhang X, An Y, Han J, et al. Graphene nanosheet reinforced ZrB2-SiC ceramic composite by thermal reduction of graphene oxide. RSC Adv. 2015;5:47060–47065.
- Yin Z, Yuan J, Xu W, et al. Graphene nanosheets toughened TiB2-based ceramic tool material by spark plasma sintering. Ceram Int. 2018;44:8977–8982.
- Sedlak R, Kovalcikova A, Girman V, et al. Fracture characteristics of SiC/graphene platelet composites. J Eur Ceram Soc. 2017;37:4307–4314.
- Nieto A, Lahiri D, Agarwal A. Nanodynamic mechanical behaviour of graphene nanoplatelet-reinforced tantalum carbide. Scripta Mater. 2013;69:678–681.
- Nieto A, Lahiri D, Agarwal A. Graphene nanoplatelets reinforced tantalum carbide consolidated by spark plasma sintering. Mat Sci Eng A. 2013;582:338–346.
- Leyarovska L, Leyarovski E. A search for superconductivity below 1 K in transition metal borides. J Less-Common Met. 1979;67:249–255.
- Takahashi T, Kawamata S, Noguchi S, et al. Superconductivity and crystal growth of NbB2. Physica C. 2005;426:478–481.
- Matsudaira T, Itoh H, Naka S, et al. Synthesis of niobium boride powder by solid state reaction between niobium and amorphous boron. J Less Common Met. 1989;155:207–214.
- Iizumi K, Sekiya C, Okada S, et al. Mechanochemically assisted preparation of NbB2 powder. J Eur Ceram Soc. 2006;26:635–638.
- Balci O, Agaogullari D, Ovecoglu ML, et al. Synthesis of niobium borides by powder metallurgy methods using Nb2O5, B2O3 and Mg blends. Trans Nonferrous Met Soc China. 2016;26:747–758.
- Balci O, Agaogullari D, Muhaffel F, et al. Effect of sintering techniques on the microstructure and mechanical properties of niobium borides. J Eur Ceram Soc. 2016;36:3113–3123.
- Sairam K, Sonber KJ, Murthy T, et al. Reaction spark plasma sintering of niobium diboride. Int J Refract Met Hard Mater. 2014;43:259–262.
- Demirskyi D, Sakka Y. In situ fabrication of B4C–NbB2 eutectic composites by spark-plasma sintering. J Am Ceram Soc. 2014;97:2376–2378.
- Demirskyi D, Vasylkiv O. Mechanical properties of SiC–NbB2 eutectic composites by in situ spark plasma sintering. Ceram Int. 2016;42:19372–19385.
- Demirskyi D, Solodkyi I, Nishimura T, et al. High-temperature strength and plastic deformation behaviour of niobium diboride consolidated by spark plasma sintering. J Am Ceram Soc. 2017;100:5295–5305.
- Anstis GR, Chantikul P, Lawn BR, et al. A critical evaluation of indentation techniques for measuring fracture toughness: i direct crack measurements. J Am Ceram Soc. 1981;64:533–538.
- Samsonov GV. Plenum press handbooks of high-temperature materials no:2 properties index. 1st ed. New York: Springer; 1964.
- Borges LA, Coelho GC, Nunes CA, et al. New data on phase equilibria in the Nb-rich region of the Nb-B system. J Phase Equilibria. 2005;24:140–146.
- Yeh CL, Chen WH. Preparation of niobium borides NbB and NbB2 by self-propagating combustion synthesis. J Alloy Compd. 2006;420:111–116.
- Basu B, Raju GB, Suri AK. Processing and properties of monolithic TiB2 based materials. Int Mater Rev. 2006;51:352–374.
- Monteverde F. Beneficial effects of an ultra-fine α-SiC incorporation on the sinterability and mechanical properties of ZrB2. Appl Phys A Mater Sci Proc. 2006;82:329–337.
- Kim HJ, Lee SM, Oh YS, et al. Unoxidized graphene/alumina nanocomposite: fracture-and wear-resistance effects of graphene on alumina matrix. Sci Rep. 2014;4. Article number: 5176: 1–10.
- King DS, Fahrenholtz WG, Hilmas GE. Microstructural effects on the mechanical properties of SiC-15 vol% TiB2 particulate-reinforced ceramic composites. J Am Ceram Soc. 2013;96:577–583.
- Kumashiro Y, edited by. Electric refractory materials. New York: Taylor & Francis; 2005.
- Nieto A, Zhao JM, Han YH, et al. Microscale tribological behavior and in vitro biocompatibility of graphene nanoplatelet reinforced alumina. J Mech Behav Biomed Mater. 2016;61:122–134.
- Papageorgiou DG, Kinloch IA, Young RJ. Mechanical properties of graphene and graphene-based nanocomposites. Prog Mater Sci. 2017;90:75–127.
- Nieto A, Bisht A, Lahiri D, et al. Graphene reinforced metal and ceramic matrix composites: a review. Int Mater Rev. 2017;62:241–302.
- Markandan K, Chin JK, Tan MTT. Recent progress in graphene based ceramic composites: a review. J Mater Res. 2017;32:84–106.
- Yadhukulakrishnan GB, Karumuri S, Rahman A, et al. Spark plasma sintering of graphene reinforced zirconium diboride ultra-high temperature ceramic composites. Ceram Int. 2013;39:6637–6646.
- Talmy IG, Wuchina EJ, Zaykoslr JA, et al. Properties of ceramics in the NbB2-CrB2 system. Ceram Eng Sci Proc. 1996;3:128–135.
- Mansurova AN, Gulyaeva RI, Chumarev VM. Kinetic analysis of the oxidation of Nb-Si eutectic alloy doped with boron. Inorganic Mater: Appl Res. 2017;8:318–326.
- Cheng J, Yi S, Park JS. Simultaneous coating of Si and B on Nb-Si-B alloys by a halide activated pack cementation method and oxidation behaviors of the alloy with coatings at 1100°C. J Alloy Compd. 2015;644:975–981.
- Nieto A, Kumar A, Lahiri D, et al. Oxidation behavior of graphene nanoplatelet reinforced tantalum carbide composites in high temperature plasma flow. Carbon. 2014;67:398–408.
- Zimmermann JW, Hilmas GE, Fahrenholtz WG. Thermophysical properties of ZrB2 and ZrB2-SiC ceramics. J Am Ceram Soc. 2008;91:1405–1411.
- Loehman R, Corral E, Dumm HP, et al. Ultra high temperature ceramics for hypersonic vehicle applications. Albuquerque, NM: Sandia National Laboratories; 2006. p. SAND2006–2925.
- Opeka MM, Talmy IG, Wuchina EJ, et al. Mechanical, thermal, and oxidation properties of refractory hafnium and zirconium compounds. J Eur Ceram Soc. 1999;19:2405–2414.
- Lauwers B, Vleugels J, Malek O, et al. Electrical discharge machining of composites. In: Hocheng H, editor. Machining technology for composite materials: principles and practice. Philadelphia: Woodhead Publishing in Materials; 2012:186–191.
- Kaur N, Mohan R, Gaur NK, et al. Cohesive and thermal properties of transition metal diborides. Physica B. 2009;404:1607–1610.
- Harrington GJK, Hilmas GE. Thermal conductivity of ZrB2 and HfB2. In: Fahrenholtz WG, Wuchina EJ, Lee WE, et al., editors. Ultra-high temperature ceramics: materials for extreme environment applications. New Jersey: John Wiley & Sons, Inc; 2014:197–235.
- Hu C, Sakka Y, Jang B, et al. Microstructure and properties of ZrB2-SiC and HfB2-SiC composites fabricated by spark plasma sintering (SPS) using TaSi2 as sintering aid. J Ceram Soc Japan. 2010;118:997–1001.
- Atif R, Iman F. Reasons and remedies for the agglomeration of multilayered graphene and carbon nanotubes in polymers. Beilstein J Nanotechnol. 2016;7:1174–1196.
- Liu J, Yan H, Jiang K. Mechanical properties of graphene platelet-reinforced alumina ceramic composites. Ceram Int. 2013;39:6215–6221.
- Hu Z, Tong G, Lin D, et al. Graphene-reinforced metal matrix nanocomposites - a review. Mater Sci Technol. 2016;32:930–953.