
 ?Mathematical formulae have been encoded as MathML and are displayed in this HTML version using MathJax in order to improve their display. Uncheck the box to turn MathJax off. This feature requires Javascript. Click on a formula to zoom.
ABSTRACT
In the present study, the plasma electrolytic oxidation method was used to form ceramic coatings on pure Ti substrates. For this purpose, five different aluminate-based electrolytes containing various sodium-based additives (sodium hydroxide, sodium phosphate, sodium silicate, sodium tetraborate and sodium fluoride) were used. The role of additives in the growth, macrostructure, surface and cross-sectional microstructure, phase composition and corrosion resistance of the coatings was evaluated. An X-ray diffractometer and scanning electron microscope were used to study the microstructure and phase composition of the coatings, respectively. The corrosion resistance of the coatings was investigated by applying electrochemical impedance spectroscopy and potentiodynamic polarization tests in a 3.5 wt. % NaCl solution. The results revealed that use of a sodium phosphate additive led to formation of a coating (4.33 µm thick) with the most suitable microstructure and highest corrosion resistance (4.36 × 10⁶ Ω cm2), which was 53 times higher than that of uncoated Ti.
1. Introduction
Some remarkable properties of Ti such as high specific strength, low density, excellent thermal stability, high mechanical strength, chemical inertness and high corrosion resistance have led to widespread application of this metal and its alloys in the aerospace, automotive, chemical and biomedical industries [Citation1–Citation3]. The high reactivity of Ti and its alloys with oxygen when exposed to air or moisture leads to formation of thin protective oxide films (typically 2–5 nm) on their surfaces, which are the main contributors to high corrosion resistance in these materials [Citation4–Citation6]. Weak corrosion protective properties of these oxide films in aggressive media can, however, result in the release of toxic metal ions, galvanic corrosion, or reduced corrosion resistance due to the strong negative standard electrode potential of Ti (−1.63 V (SHE)) and its reactivity to surrounding media [Citation7,Citation8]. Various techniques such as chemical vapor deposition (CVD), physical vapor deposition (PVD), thermal oxidation, magnetron sputtering, anodization, plasma spraying and plasma electrolytic oxidation (PEO) have therefore been used as surface modification methods to coat these materials [Citation9,Citation10]. Recently, the PEO process, derived from traditional anodic oxidation, has attracted considerable interest as a cost-effective, eco-friendly and highly efficient coating technique [Citation11,Citation12]. The PEO process has been used to form hard wear- and corrosion-resistant ceramic coatings with excellent adhesion to substrates on the surfaces of Al, Mg, Ti and their alloys [Citation12,Citation13]. This process is carried out at voltages higher than the oxide film dielectric breakdown voltage in an aqueous solution with components that participate in the final coating [Citation14,Citation15]. Thermal and anodic oxidation, plasma chemical reactions and thermolysis processes may provide the complex formation mechanism of PEO coatings at the discharge zones [Citation16,Citation17]. In fact, when the voltage is higher than the breakdown voltage, the dielectric instability in the oxide film causes discharging and spark development, as well as visible light emission and gas release, on the anode surface [Citation18]. The micro-discharging and sparks lead to localized high pressure (102–103 MPa) and temperature (103–104 K) inside the discharge channels and form an oxide coating as a result of exchanges occurring between the electrolyte and the metallic substrate during the plasma thermochemical interactions [Citation18,Citation19]. The composition and temperature of the electrolyte, oxidation time, applied voltage, current frequency and anodic current density affect the characteristics of the PEO coating [Citation3]. The composition of the PEO coating is determined by the chemical composition of the electrolyte and substrate material [Citation20]. The studies available in the published literature [Citation1,Citation9,Citation12,Citation21,Citation22] have reported and confirmed that the chemical composition of the electrolyte has a major effect on the corrosion behavior of PEO coatings. Shokouhfar et al. [Citation22] concluded, for instance, that a change in electrolyte components, even when all other conditions remained constant, led to a change in the sparking voltage and, consequently, to a change in the size and uniformity of the surface pores. An increase in the sparking voltage resulted in an increase in the size of the pores and the evenness of their distribution on the surface. The authors showed that after replacing the aluminate-based electrolyte additive (using NaF instead of KOH), the uniformity of the surface and adhesion and corrosion resistance of the coating declined and no TiAl2O5 phase was observed. The chemical composition of the electrolyte is therefore known one of the most important parameters that might affect the microstructure, phase composition and properties of PEO coatings. Different chemical additives can be used to modify the characteristics and chemical composition of the electrolyte. In the present study, since the acceleration of metal passivation and dielectric breakdown and, therefore, the formation of a thin insulating film, are influenced by the chemical composition of the electrolyte [Citation3], so with regard to this as well as achieving the best possible surface structure and corrosion behavior, five different additives were used. These five additives included sodium hydroxide (NaOH), sodium phosphate (Na3PO4), sodium silicate (Na2SiO3), sodium tetraborate (Na2B4O7) and sodium fluoride (NaF). Although the effects of some of these additives have been investigated in numerous papers, no comparative of the effects of these five additives on the surface structure and corrosion behavior of coatings formed on pure Ti under constant voltage conditions and using an aluminate-based electrolyte has yet been conducted. The influence of these additives on the macrostructure, microstructure, phase composition and corrosion resistance of the coatings were therefore studied.
2. Experimental procedure
The substrate (anode) for the PEO treatment was made from pure Ti with dimensions of 2 cm× 2 cm× 0.2 cm whose chemical composition is given in . Before the PEO process, specimens were ground with SiC papers (#100–2000 grit) and rinsed in distilled water, followed by cold air drying. The PEO treatment was conducted using a PM700/7 PRC apparatus with a DC power supply at a constant applied voltage of 420 V for 180 s. In the PEO process, an ASTM 316 stainless-steel container was used as the cathode. The coating processes were carried out with aluminate-based electrolytes containing 10 g/l NaAlO2 and five different sodium-based additives, as listed in . The electrolytes’ temperature was kept close to 35°C with a cold water circulating system during the PEO process. A D812 Weilheim instrument was used to measure the conductivity values of the PEO electrolytes. The morphology of the coatings was studied using a JEOL JSM-840A scanning electron microscope (SEM). The coatings’ thicknesses were measured by Digimizer software. A PAN analytical X‘ Pert Pro MPD X-ray diffractometer (XRD) was used to analyze the phase compositions of the coatings.
Table 1. The chemical composition of the commercial pure titanium used in this study (wt. %).
Table 2. The chemical composition, sparking voltage and electrical conductivity of different electrolytes.
We used electrochemical impedance spectroscopy (EIS) and potentiodynamic polarization (PDP) tests to study the corrosion behavior of uncoated and coated samples. These measurements were conducted in a 3.5 wt. % NaCl solution at 25 ± 1°C using a μAutolab Type III/FRA2 system and three-electrode flat cells. The flat cells used a platinum plate and Ag/AgCl saturated in KCl as the counter and reference electrodes, respectively. The surface area of the working electrode (sample) coming to contact with the NaCl solution was 0.28 cm2. NOVA 2.1 impedance software was used to assess the corrosion resistance of the samples. Prior to the corrosion tests, the specimens were immersed in 3.5 wt. % NaCl solution for 1800 s in order to reach a stable open circuit potential (OCP). A frequency range of 100 kHz to 10 mHz and an amplitude of 10 mV were used for the EIS tests. In addition, a scanning range from −250 mV associated with the open circuit potential and a 1 mV/s scan rate were used in conducting the PDP measurements.
3. Results and discussion
3.1. Growth of the coatings
Increasing the voltage for 20 s at the start of the PEO treatment caused the current to increase rapidly. At this stage, an oxidation process and gas evolution occurred in all the electrolytes. At the same time, when the applied voltage reached the breakdown voltage, dielectric breakdown of the oxide film occurred and, subsequently, the sparking phenomenon began (including a large number of small, white, visible and short-life sparks) [Citation23]. The onset of the sparking phenomenon on the surface of the samples led to a slow decrease in the current. As the duration of the process increased, the size and intensity of the sparks increased and their number decreased. During the coating process, moreover, the sparks first turned yellow and then gradually changed to orange. In the PEO process, the localized increase in temperature and melting of the coating by sparking resulted in an eruption of molten materials from the discharge channels, which were then cooled rapidly by the electrolyte to form a porous structure [Citation24,Citation25]. In fact, the electrochemical oxidation of the surface anode that is free of discharges and high-temperature reactions created by electric discharges are the two processes that are simultaneously responsible for PEO coating growth [Citation26]. Due to the change in electrical conductivity, the sparking voltage and, therefore, the sparks’ characteristics were different for each electrolyte (). In PEO treatment, the energy level is determined by the intensity of the sparks, which is directly related to their sizes [Citation27]. The use of NaOH and Na3PO4 additives in the base electrolyte led to the formation of small regular uniform sparks. The high electrical conductivity of the electrolyte containing Na2SiO3 led to the formation of large, intense sparks and, consequently, to large micro-discharges with uneven distribution on the anode surface. The use of a low-conductivity electrolyte containing Na2B4O7 resulted in an increase in the sparking voltage and the formation of large and non-uniform sparks. The sparking phenomenon in this electrolyte was also slightly delayed compared with that of other electrolytes. Adding NaF to the base electrolyte also caused larger, more severe and fewer sparks of the NaOH and Na3PO4 additives.
3.2. Macroscopic images of the coatings
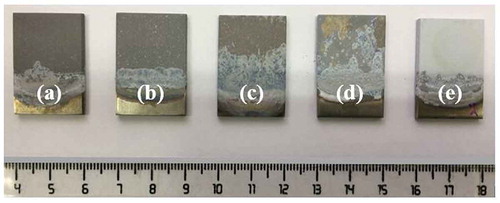
Based on the macroscopic images of the coatings shown in , it was determined that the coatings fabricated by the electrolytes containing different additives had different colors and appearances due to their different structures and properties. The samples coated in the electrolytes containing NaOH ()) and Na3PO4 ()) additives had the most uniform coatings. There were, however, a few visible white spots of the electrolyte components on the surface of the specimen coated in the electrolyte containing Na3PO4. A part of the coating formed using the electrolyte containing Na2SiO3 ()) was covered by electrolyte salts due to severe gas evolution and sparks resulting from the high electrical conductivity. In other words, a small part of the surface of this sample was covered by a uniform coating free of salt accumulation. The sample coated in the electrolyte containing Na2B4O7 ()) had the least uniform coating. As shown in the image, the lack of coating on some parts of the surface of this sample was due to weak adhesion and separation of the coating from the substrate after its removal from the electrolyte and immersion in distilled water at the end of the process. Although the coating prepared in the electrolyte containing NaF ()) had a uniform appearance, it had a rough surface. This coating was also brighter than the other coatings.
Figure 1. Macroscopic image of the samples coated in different electrolytes: (a) An, (b) Ap, (c) As, (d) Ab and (e) Af.
3.3. Microscopic morphologies of the coatings
The surface microstructures of the coatings fabricated using different electrolytes are given in . It is obvious that the use of different additives in the base electrolyte had significant effects on the surface microstructures of the coatings. All of the coatings had porous structures with the micro-pores in a volcanic crater shape, which is one of the characteristics of PEO coatings that is caused mainly by micro-discharges. The microstructure of the coating using the electrolyte containing NaF ()) was different from those of the coatings prepared using the other electrolytes. This coating had a small number of very large micro-pores and many micro-cracks. In fact, the NaF additive decomposed into Na+ and F− ions in the electrolyte. The partial conversion of the F− ion into hydrofluoric acid damaged the passive layer on the surface of the Ti substrate. Ti oxide was degraded in the solution as a result, while F− ions bonded to the Ti to form Ti-F compounds [Citation22]. The release of thermal stress in the plasma discharge channels and rapid cooling of the molten oxide by the surrounding electrolyte during the coating growth process caused surface micro-cracks in the PEO process [Citation8,Citation28]. The coating fabricated by the electrolyte containing NaOH ()), meanwhile, had a uniform structure with well-dispersed micro-pores characterized by the largest number but the smallest size. There were also no micro-cracks on the surface of this coating. These characteristics were related to the creation of regular, uniform sparks during the PEO process. The uniform structure of the coating of the electrolyte containing Na3PO4 ()) also contained well-dispersed micro-pores, but there were larger and fewer in number than in the other sample (An). The differences between the size and number of micro-pores in these two samples were related to the differences in size, intensity and number of sparks produced during the coating processes. In fact, the higher electrical conductivity of the electrolyte containing Na3PO4 led to more severe but fewer sparks than in the (An) electrolyte. This coating also showed no micro-cracks. The high electrical conductivity of the electrolyte containing Na2SiO3 ()) resulted in large irregular, non-uniform sparks and, eventually, in a surface microstructure including a number of micro-pores with non-uniform shapes and distribution. Due to the release of thermal stresses during growth of the coating process, moreover, this sample had surface micro-cracks dispersed throughout the coating (indicated by white arrows). The use of Na2B4O7 in the base electrolyte led to formation of a coating ()) that included micro-cracks and micro-pores with irregular shapes, sizes and dispersion. A high sparking voltage and, subsequently, a high level of discharge energy and thus the formation of large sparks were the reasons why the large micro-pores were formed in this coating [Citation22].
Figure 2. Surface morphologies of the PEO coatings prepared in different electrolytes at a magnification of 1000X: (a) An, (b) Ap, (c) As, (d) Ab and (e) Af.
3.4. Thicknesses of the coatings
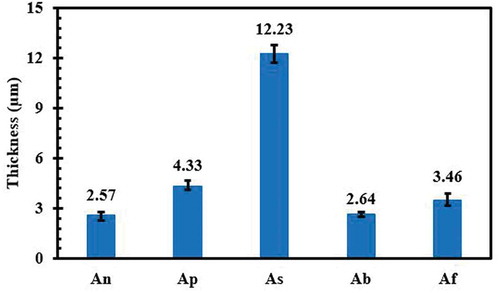
shows microscopic cross-sectional images of areas of the coatings. The electrochemical reactions between the Ti4+ ions, the oxidizing ions such as O2 – and OH – and the electrolyte component ions such as PO43−, SiO23−, (B4O7)2− and F−led to the formation of TiO2 anodic film. In fact, removing the Ti4+ ions from the substrate to the discharge channels produced an oxide film simultaneously through the formation of micro-arcs in the electrolyte [Citation9]. According to the images and the thicknesses of the coatings shown in , it was determined that the coating prepared using Na2SiO3 additive ()) had the greatest thickness (12.23 µm) due to the high electrical conductivity of the electrolyte. In fact, the high electrolyte conductivity resulted in the domination of the coating rate formation over that of anodic dissolution [Citation29]. Despite its significant thickness, this coating was completely irregular and porous. In fact, electric currents require more energy to pass through thick coatings and therefore focus on weak points, leading to an increase in the size of the discharge channels [Citation18]. On the other hand, severe discharges generated during the process due to lack of time prevent the molten oxide from filling the channels completely and increase the growth rate [Citation30]. The thinness (2.64 µm) of the coating of the electrolyte containing Na2B4O7 ()) was due to its low electrical conductivity. There were also discontinuities between this coating and the substrate, which revealed their weak adhesion. The coating prepared in the electrolyte containing NaOH ()) was dense and uniform despite its relative thinness. The coating fabricated using the electrolyte with Na3PO4 ()) was compact and uniform but thicker than (An).
Figure 3. Cross-sectional morphologies of the PEO coatings prepared in different electrolytes at a magnification of 2000X: (a) An, (b) Ap, (c) As, (d) Ab and (e) Af.
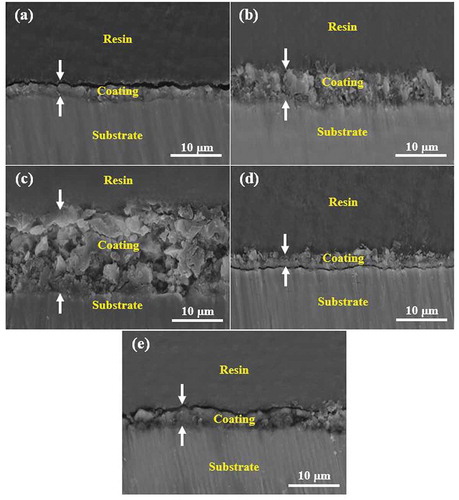
Figure 4. Thicknesses of the PEO coatings formed in different electrolytes.
3.5. Phase compositions of the coatings
The three titania polymorphs include rutile, anatase and brookit [Citation31]. Anatase, as a meta-stable phase, can be transformed into the stable rutile phase at 915°C [Citation31,Citation32]. The reaction of Ti+4 and OH− ions during the coating process due to the high pressure and temperature in the discharge channels leads to the formation of the rutile and anatase phases. The low temperature inside the discharge channels in the early stages of the coating process causes faster formation of the anatase compared to the rutile phase [Citation33]. The rutile phase has greater corrosion resistance, higher density and better mechanical properties because of its higher hardness as compared to the anatase phase [Citation34]. displays XRD patterns of the coated samples. The rutile and anatase crystalline phases were detected in all the XRD patterns. Due to the use of aluminate-based electrolytes, moreover, a small amount of the TiAl2O5 phase was found in the XRD patterns of all the samples. These results were in good agreement with those of our previous study [Citation3]. The TiAl2O5 phase was formed in accordance with the following reactions [Citation7]:
Figure 5. XRD patterns of the PEO coatings formed in different electrolytes.
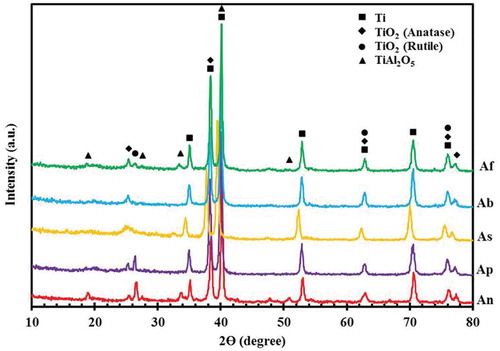
In addition to the phases mentioned above, the peaks of the Ti substrate were also identified due to the porosity and thinness of the coatings and, consequently, the penetration of X-rays into the Ti substrate. The most intense anatase and rutile peaks were detected in the patterns of the (Ab) and (Ap) samples, respectively.
3.6. Corrosion behavior of the coatings
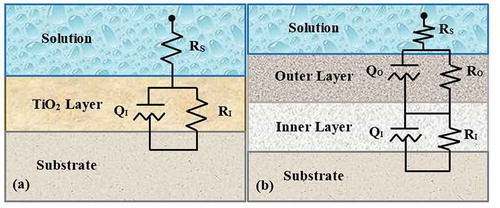
The results of EIS tests are shown in the Nyquist and Bode diagrams in . Due to the formation of an oxide layer on the Ti surface, the Nyquist plot of uncoated Ti had one capacitive semicircle, which illustrated a single time constant ()) in the corresponding electrical equivalent circuit (EEC). On the contrary, there are two capacitive semicircles in the Nyquist diagrams of the coated Ti specimens and, as a result, two time constants in their respective circuits ()). The semicircle that was observed at high frequencies was associated with the porous outer film, while the one appearing at low frequencies contributed to the compact inner film. The voltage applied to the metal and plasma interaction with the metal and electrolyte was responsible for the formation of inner and outer films, respectively [Citation22]. The Bode plot of the uncoated Ti showed capacitive behavior in the low to middle frequency range and resistive behavior in the high frequency range. In the Bode plots of coated specimens, resistive and capacitive behaviors were observed in the high and low frequency ranges, respectively. These results agreed with the data presented in ). The simulation of the impedance data was conducted using the equivalent electrical circuits given in . The circuit given in ) was used for uncoated Ti. In this circuit, RS represented the solution resistance and RI and QI showed the corrosion resistance and constant phase element (CPE) of passive film on the Ti surface, respectively. The other EEC (shown in )) was used for fitting the EIS diagrams of the coated specimens. The RI and RO elements are symbols of the corrosion behavior of the inner and outer films, respectively. Similarly, QI and QO exhibited the CPEs of the inner and outer films [Citation35,Citation36]. As can be seen, the diameters of the semicircles in Nyquist plots of the samples (As), (Ab) and (Af) were smaller than that of uncoated Ti. This behavior showed lower corrosion resistance in these three samples compared to the uncoated sample. The lower corrosion resistance of the deposited coatings in these three electrolytes, might be due to the loss of the passive layer on the Ti surface. The parameters extracted from the EECs are given in . In every coated sample, the corrosion resistance of the inner film (RI) was greater than that of the outer film (RO), and as a result, the main contribution to the corrosion resistance of PEO coatings was to the inner film. These results demonstrate that the coating formed in the electrolyte containing the Na3PO4 additive had the highest corrosion resistance (33.84 × 10⁵ Ω cm2), which was about 53 times larger than that of the uncoated Ti. Using the Na2B4O7 as an additive in the electrolyte resulted in a coating with minimal corrosion resistance (60.80 × 10² Ω cm2). On the other hand, Y0, the admittance constant, showed a minimum for (Ap) (6.74 × 10⁻⁵ Ω−1 sn cm−2) and maximum for (Ab) (7.52 × 10⁻⁴ Ω−1 sn cm−2) samples. An increase in Y0 is considered to be associated with penetration through the inner film of paths that facilitate the diffusion of corrosive species into the coating.
Table 3. Parameters extracted from the electrical equivalent circuits.
Figure 6. EIS plots of uncoated and coated samples after 1800 s immersion in 3.5 wt. % NaCl solutions: (a) the Nyquist and (b) Bode modulus.
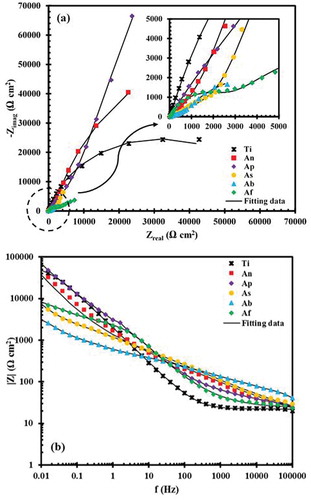
Figure 7. Schematic of the EIS equivalent circuit for (a) uncoated Ti and (b) PEO coatings.
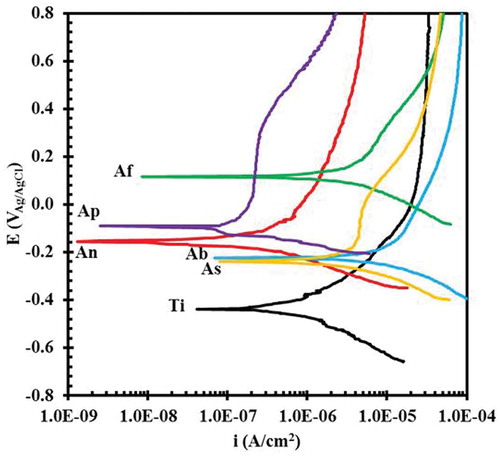
illustrates the PDP plots of the uncoated and coated Ti specimens in 3.5% wt. NaCl solutions. The protectiveness of the oxide layers on the Ti surface is controlled by such parameters as the shifting surface potential, reduction of adsorption activity of corrosive ions and suppression of charge-carrier mobility at the electrolyte-metal interface [Citation37]. As can be seen, compared to the uncoated Ti, the whole polarization plots for the (An) and (Ap) specimens were transmitted to a region with a higher corrosion potential (Ecorr) and lower corrosion current density (icorr). The higher corrosion potential reflects a reduced tendency to corrosion [Citation38]. By contrast, the whole polarization plots for the (As), (Ab) and (Af) samples moved to a more positive corrosion potential but greater corrosion current density as compared with those of the uncoated sample. The extracted PDP plot parameters are listed in . Although both the Ecorr and icorr are necessary to detect corrosion resistance, as a kinetic factor, the corrosion current density is mainly a determinant factor [Citation39]. The lower corrosion current density of the (An) and (Ap) samples therefore implied greater corrosion resistance as compared to that of uncoated Ti. By contrast, the (As), (Ab) and (Af) samples showed weaker corrosion resistance due to higher corrosion current density compared to that of the uncoated sample. The differences among the corrosion behaviors of the various coatings were related to their different structural defects, thicknesses and phase compositions. The penetration of the corrosive environment through the coating to the substrate was the main factor controlling the corrosion of PEO coatings [Citation40]. The significant increase in corrosion resistance of the Ti substrate using NaOH and Na3PO4 additives was due to the formation of compact, uniform coatings, including the small, well-dispersed micro-pores and the absence of micro-cracks. In fact, the higher the numbers of micro-pores and micro-cracks, the higher the degree of Cl− ion penetration. Although the number of micro-pores in the (An) coating was high, this coating had good corrosion behavior due to the small size of these pores and, consequently, the reduction of the penetration rate by corrosive Cl− ions into the Ti substrate. The better corrosion behavior of the (Ap) specimen compared to the (An) specimen was due to the greater thickness of the coating and the presence of larger micro-pores but occurring in a smaller number. The high degree of the rutile phase in these coatings was another factor in their high corrosion resistance. Among all the specimens, the (Ap) sample had the lowest corrosion current density (8.80 × 10⁻⁸ A cm−2) and, therefore, the highest corrosion resistance. By contrast, the (Ab) sample showed the greatest corrosion current density (1.17 × 10⁻⁵ A cm−2) and the weakest corrosion resistance. The poor corrosion resistance of this coating was related to its high porosity and presence of micro-cracks, weak adhesion between the coating and Ti substrate, thinness and high degree of the anatase phase. In fact, the thinness and weak adhesion of this coating resulted in its easy separation from the substrate and the greater penetration of Cl− corrosive ions it permitted. The corrosion resistance of the (As) sample, despite its significant thickness, was low due to the relatively large micro-pores and the micro-cracks opening paths between the Cl− corrosive ions and the substrate. This showed that structural imperfections are more important than thickness in achieving good corrosion protection [Citation31]. The undesirable structure of the (Af) sample, which contained large micro-pores and many micro-cracks, resulted in poor corrosion protection. Nevertheless, this coating possessed the most positive corrosion potential (0.114 V).
Table 4. Data extracted from the potentiodynamic polarization plots.
Figure 8. PDP plots of uncoated and coated samples in 3.5 wt. % NaCl solutions.
4. Conclusions
The roles played by different additives in the corrosion resistance and microstructures of PEO coatings on pure Ti substrates using aluminate-based electrolytes was studied. The results are presented as following:
The color and appearance, sparking voltage and spark characteristics, surface and cross-sectional morphologies, phase compositions and corrosion behavior of the coatings varied with changes in the type of additive.
The structures of coatings formed using electrolytes containing NaOH and Na3PO4 additives were uniform and compact with well-dispersed micro-pores and freedom from micro-cracks. These specifications were related, moreover, to the formation of regular, uniform sparks in the coating process. The high electrical conductivity of the electrolyte containing Na2SiO3 led to the formation of a coating containing relatively large micro-pores with irregular shapes and distribution. Because of the thermal stresses release in the growth process, this coating had micro-cracks. The microstructure of the electrolyte coating containing NaF had a small number of very large micro-pores and many micro-cracks caused by the F− ion.
All the coatings consisted of rutile, anatase and a small number of TiAl2O5 phases.
The coating formed using the electrolyte containing Na3PO4 indicated the lowest corrosion current density (8.80 × 10⁻⁸ A cm−2) and highest corrosion resistance (33.84 × 10⁵ Ω cm2) among all the samples. This coating showed superior corrosion resistance compared to the uncoated substrate. The good corrosion behavior of this coating resulted from its compact, uniform structure with low porosity and high rutile phase content. By contrast, using Na2B4O7 as an additive to the base electrolyte caused the formation of a coating with the highest corrosion current density (1.17 × 10⁻⁵ A cm−2) and the lowest corrosion resistance (60.80 × 10² Ω cm2). The coating’s porous structure with micro-cracks, weak adhesion to the substrate and high level of the anatase phase were the factors that weakened it against corrosion.
Disclosure statement
No potential conflict of interest was reported by the authors.
References
- Babaei M, Dehghanian C, Vanaki M. Effect of additive on electrochemical corrosion properties of plasma electrolytic oxidation coatings formed on CP Ti under different processing frequency. Appl Surf Sci. 2015;357:712–720.
- Di S, Guo Y, Lv H, et al. Microstructure and properties of rare earth CeO2-doped TiO2 nanostructured composite coatings through micro-arc oxidation. Ceram Int. 2015;41:6178–6186.
- Fattah-Alhosseini A, Keshavarz MK, Molaei M. Plasma electrolytic oxidation (PEO) process on commercially pure Ti surface : effects of electrolyte on the microstructure and corrosion behavior of coatings. Metall Mater Trans A. 2018;49:4966–4979.
- Babaei M, Dehghanian C, Babaei M. Electrochemical assessment of characteristics and corrosion behavior of Zr-containing coatings formed on titanium by plasma electrolytic oxidation. Surf Coat Technol. 2015;279:79–91.
- Tao XJ, Li SJ, Zheng CY, et al. Synthesis of a porous oxide layer on a multifunctional biomedical titanium by micro-arc oxidation. Mater Sci Eng C. 2009;29:1923–1934.
- R.S. Williamsona, Disegi J, Janorkar AV, et al. Effect of duty cycle on the crystallinity, pore size, surface roughness and corrosion resistance of the anodized surface on titanium. Surf Coat Technol. 2015;277:278–288.
- Kaan S, Muhaffel F, Baydogan M. Effect of incorporating carbon nanotubes into electrolyte on surface morphology of micro arc oxidized Cp-Ti. Appl Surf Sci. 2014;318:10–14.
- Cheng YL, Wu XQ, Xue ZG, et al. Microstructure, corrosion and wear performance of plasma electrolytic oxidation coatings formed on Ti-6Al-4V alloy in silicate-hexametaphosphate electrolyte. Surf Coatings Technol. 2013;217:129–139.
- Hariprasad S, Ashfaq M, Arunnellaiappan T, et al. Role of electrolyte additives on in-vitro corrosion behavior of DC plasma electrolytic oxidization coatings formed on Cp-Ti. Surf Coat Technol. 2016;292:20–29.
- Durdu S, Levent S, Korkmaz K. Characterization and mechanical properties of the duplex coatings produced on steel by electro-spark deposition and micro-arc oxidation. Surf. Coatings Technol. 2013;236:303–308.
- Vakili-Azghandi M, Fattah-Alhosseini A, Keshavarz MK. Effects of Al2O3 nano-particles on corrosion performance of plasma electrolytic oxidation coatings formed on 6061 aluminum alloy. J Mater Eng Perform. 2016;25:5302–5313.
- Venkateswarlu K, Rameshbabu N, Sreekanth D, et al. Role of electrolyte additives on in-vitro electrochemical behavior of micro arc oxidized titania films on Cp Ti. Appl Surf Sci. 2012;258:6853–6863.
- Montazeri M, Dehghanian C, Shokouhfar M, et al. Investigation of the voltage and time effects on the formation of hydroxyapatite-containing titania prepared by plasma electrolytic oxidation on Ti – 6Al – 4V alloy and its corrosion behavior. Appl Surf Sci. 2011;257:7268–7275.
- Yerokhin A, Parfenov EV, Matthews A. In situ impedance spectroscopy of the plasma electrolytic oxidation process for deposition of Ca- and P-containing coatings on Ti. Surf Coat Technol. 2016;301:54–62.
- Wang H, Zhu R, Lu Y, et al. Effect of sandblasting intensity on microstructures and properties of pure titanium micro-arc oxidation coatings in an optimized composite technique. Appl Surf Sci. 2014;292:204–212.
- Aliasghari S, Němcová A, Skeldon P, et al. Influence of coating morphology on adhesive bonding of titanium pre-treated by plasma electrolytic oxidation. Surf Coat Technol. 2016;289:101–109.
- Liu X, Li G, Xia Y. Investigation of the discharge mechanism of plasma electrolytic oxidation using Ti tracer. Surf Coat Technol. 2012;206:4462–4465.
- Stojadinovi S, Vasili R, Petkovi M, et al. Plasma electrolytic oxidation of titanium in heteropolytungstate acids. Surf Coat Technol. 2011;206:575–581.
- Bayati MR, Golestani-Fard F, Moshfegh AZ, et al. In situ derivation of sulfur activated TiO2 nano porous layers through pulse-micro arc oxidation technology. Mater Res Bull. 2011;46:1642–1647.
- Vakili-Azghandi M, Fattah-Alhosseini A, Keshavarz MK. Optimizing the electrolyte chemistry parameters of PEO coating on 6061 Al alloy by corrosion rate measurement: response surface methodology. Measurement. 2018;124:252–259.
- Molaei M, Fattah-Alhosseini A, Gashti SO. Sodium aluminate concentration effects on microstructure and corrosion behavior of the plasma electrolytic oxidation coatings on pure titanium. Metall Mater Trans A. 2017;49:368–375.
- Shokouhfar M, Dehghanian C, Baradaran A. Preparation of ceramic coating on Ti substrate by plasma electrolytic oxidation in different electrolytes and evaluation of its corrosion resistance. Appl Surf Sci. 2011;257:2617–2624.
- Sundararajan G, Krishna LR. Mechanisms underlying the formation of thick alumina coatings through the MAO coating technology. Surf. Coat. Technol. 2003;167:269–277.
- Quintero D, Galvis O, Calderón JA, et al. Effect of electrochemical parameters on the formation of anodic films on commercially pure titanium by plasma electrolytic oxidation. Surf Coat Technol. 2014;258:1223–1231.
- Teng F, Tai I, Wang M, et al. The structures, electrochemical and cell performance of titania films formed on titanium by micro-arc oxidation. J Taiwan Inst Chem Eng. 2014;45:1331–1337.
- Khan RHU, Yerokhin A, Li X, et al. Surface characterisation of DC plasma electrolytic oxidation treated 6082 aluminium alloy : effect of current density and electrolyte concentration. Surf. Coat. Technol. 2010;205:1679–1688.
- Liang J, Srinivasan PB, Blawert C, et al. Electrochemical corrosion behaviour of plasma electrolytic oxidation coatings on AM50 magnesium alloy formed in silicate and phosphate based electrolytes. Electrochim Acta. 2009;54:3842–3850.
- Durdu S, Deniz ÖF, Usta M. Characterization and formation of hydroxyapatite on Ti6Al4V coated by plasma electrolytic oxidation. J. Alloys Compd. 2013;551:422–429.
- K. Venkateswarlu, Rameshbabu N, Sreekanth D, et al. Role of electrolyte chemistry on electronic and in vitro electrochemical properties of micro-arc oxidized titania films on Cp Ti. Electrochim Acta. 2013;105:468–480.
- Wang Y, Liu Z, Ouyang J, et al. In fluence of electrolyte compositions on structure and high- temperature oxidation resistance of microarc oxidation coatings formed on Ti 2 AlNb alloy. J Alloys Compd. 2015;647:431–437.
- Vangolu Y, Arslan E, Totik Y, et al. Optimization of the coating parameters for micro-arc oxidation of Cp-Ti. Surf Coat Technol. 2010;205:1764–1773.
- Wang H, Zhu R, Lu Y, et al. Preparation and properties of plasma electrolytic oxidation coating on sandblasted pure titanium by a combination treatment. Mater Sci Eng C. 2014;42:657–664.
- Durdu S, Usta M. The tribological properties of bioceramic coatings produced on Ti6Al4V alloy by plasma electrolytic oxidation. Ceram Int. 2014;40:3627–3635.
- De Viteri VS, Bayón R, Igartua A, et al. Structure, tribocorrosion and biocide characterization of Ca, P and I containing TiO2 coatings developed by plasma electrolytic oxidation. Appl Surf Sci. 2016;367:1–10.
- Roknian M, Fattah-Alhosseini A, Omid S. Study of the effect of ZnO nanoparticles addition to PEO coatings on pure titanium substrate : microstructural analysis, antibacterial effect and corrosion behavior of coatings in Ringer ’ s physiological solution. J Alloys Compd. 2018;740:330–345.
- Roknian M, Fattah-Alhosseini A, Gashti SO. Plasma electrolytic oxidation coatings on pure Ti substrate : effects of Na3PO4 concentration on morphology and corrosion behavior of coatings in Ringer,s physiological solution. J Mater Eng Perform. 2017;27:1343–1351.
- Yerokhin AL, Nie X, Leyland A, et al. Characterisation of oxide films produced by plasma electrolytic oxidation of a Ti ᎐ 6Al ᎐ 4V alloy. Surf. Coat. Technol. 2000;130:195–206.
- Aliofkhazraei M, Gharabagh RS, Teimouri M, et al. Ceria embedded nanocomposite coating fabricated by plasma electrolytic oxidation on titanium. J Alloys Compd. 2016;685:376–383.
- Fattah-Alhosseini A, Gashti SO, Molaie M. Effects of disodium phosphate concentration (Na2HPO4.2H2O) on microstructure and corrosion resistance of plasma electrolytic oxidation (PEO) coatings on 2024 Al alloy. J Mater Eng Perform. 2018;27:825–834.
- Dzhurinskiy D, Gao Y, Yeung W-K, et al. Characterization and corrosion evaluation of TiO2 : n-HA coatings on titanium alloy formed by plasma electrolytic oxidation. Surf Coat Technol. 2015;269:258–265.